May 10, 2019 Trend 784 Explaining the Dow's current value, surrounded by anxiety, with three graphs [From Mr. Tetsuo Inoue's newsletter]
From the investment e-newsletter “Trends in the Market” by Tetsuo Inoue, provided by GogoJungle, here is a partial excerpt from this morning’s issue.
Ahead of the 25% Tariff hike announced at 13:01 Japan time, there were various reports last night as well, but President Trump said, "I have received a letter from Chairman Xi Jinping. A telephone talks might take place," and "an agreement within this week is still possible." Although the Dow partially recovered about 370 dollars from its intraday low, it could not fully bounce back, and closed down about 138 dollars from the previous day, as further preparation for the "activating the 25% for the final 3.25 trillion dollars" (sorry, I mis-stated as 32,250 earlier) became evident.
Today in “Sign,” two of five signals on the Nikkei average showed buy signals; however, as indicated in the title, these are from two Fast Stochastics and do not have much meaning on their own. More significant is the trend line, the +5% level of the total three divergences, which, after turning down, dropped for three consecutive days to around 22,070 yen, approaching the 22,000 yen level. Even if it rebounds now, it suggests it will take time to establish at the 22,000 yen level.
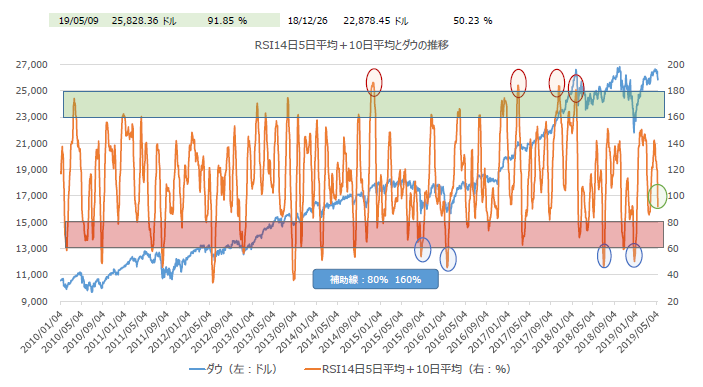
As for the Dow, the RSI 14 days, which is the only buy signal on the “Sign” (three days in a row) has fallen to 28.269% today, below 30%. The duration of staying below 30% has typically been about 4 to 6 trading days, after which it tends to rebound, and the index similarly bottoms out once and volatility subsides, so this is worth watching.
Additionally, please look at the RSI total chart in Graph 2; the current decline has not yet reached the sub-80% levels experienced five times since last year (the last was the Apple shock at the start of the year). This morning’s figure is 91.85%. We will continue to monitor this along with the standalone RSI 14-day value.
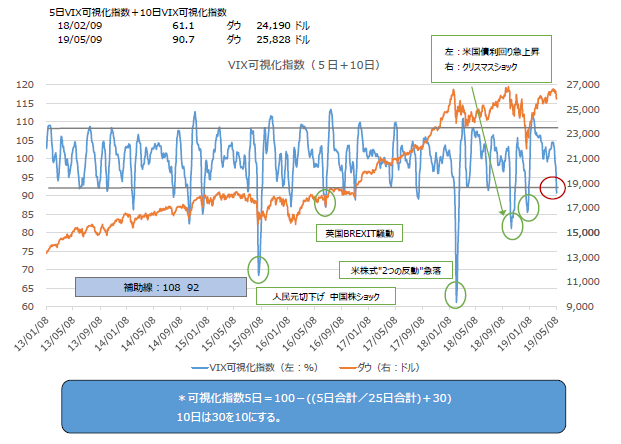
In the meantime, as noted in “MD,” the VIX has recorded 19 for three days in a row, and the VIX visualization value in Graph 1 is 90.7, below the legal speed limit of 92. While this is still a marginal level compared with the 3.2% U.S. Treasury yield shock in October last year or Trump’s Christmas market turmoil (three cabinet resignations) shock, once this bottoming out is confirmed, it would also suggest a rebound in the index.
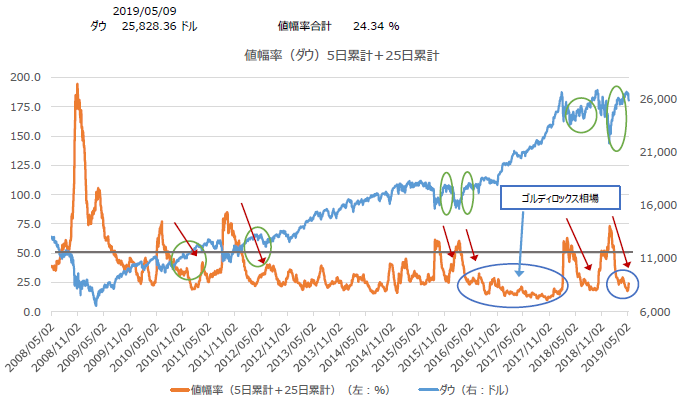
Now, I am attaching the “Dow Range Rate (Visualization)” graph as Table 3, which shows that this time the movement has been a purely autonomous rebound, a level you would hardly notice as significant, indicating that after incorporating this episode, Goldilocks Again remains a plausible scenario.
From “Trends in the Market” (Tetsuo Inoue)quoted.
There are ongoing developments in U.S.-China talks and remarks by President Trump, but let’s scrutinize the information and keep a close eye on the markets. (Editorial Department)