

NK225 Futures MTF Dow Theory Four Scenario Analysis Report 2026-08-19
NK225 Futures MTF Dow Theory Analysis Report
Date and Time: August 19, 2026 06:05 JST / Night Session
Current Price: 66,060 JPY
Target: For intraday session (Wednesday, 8/19)
Conclusion
In short, after reaching 69,110 intraday on 8/18, the price split the 15-minute minor low of 68,930 at the close and then plunged without forming a rebound. The night session started at 67,430, fell to 67,070, recovered to 67,400, but could not sustain, closing at the day’s low of 66,060. The daily candle is a large bearish candle at −2.19%. The 1H and 15m are in a downtrend with downward waves; the 4H also shifted to a down wave, and the breakout above 67,670 failed as it broke back below it.
The near-term bias is for selling rallies. The first potential bounce range is 66,350 (15m pivot price, 15m 20 EMA band) to 66,480; if this stalls, it favors a continuation short. If 66,350 is recovered on a 15m close, an autonomous rebound could occur, and a close above 67,040 (1H pivot price) could end the downward wave. Support targets are 65,880, 65,510, and 64,980; breaking 64,680 (4H minor low) would turn the 4H downward as well.
4H Analysis
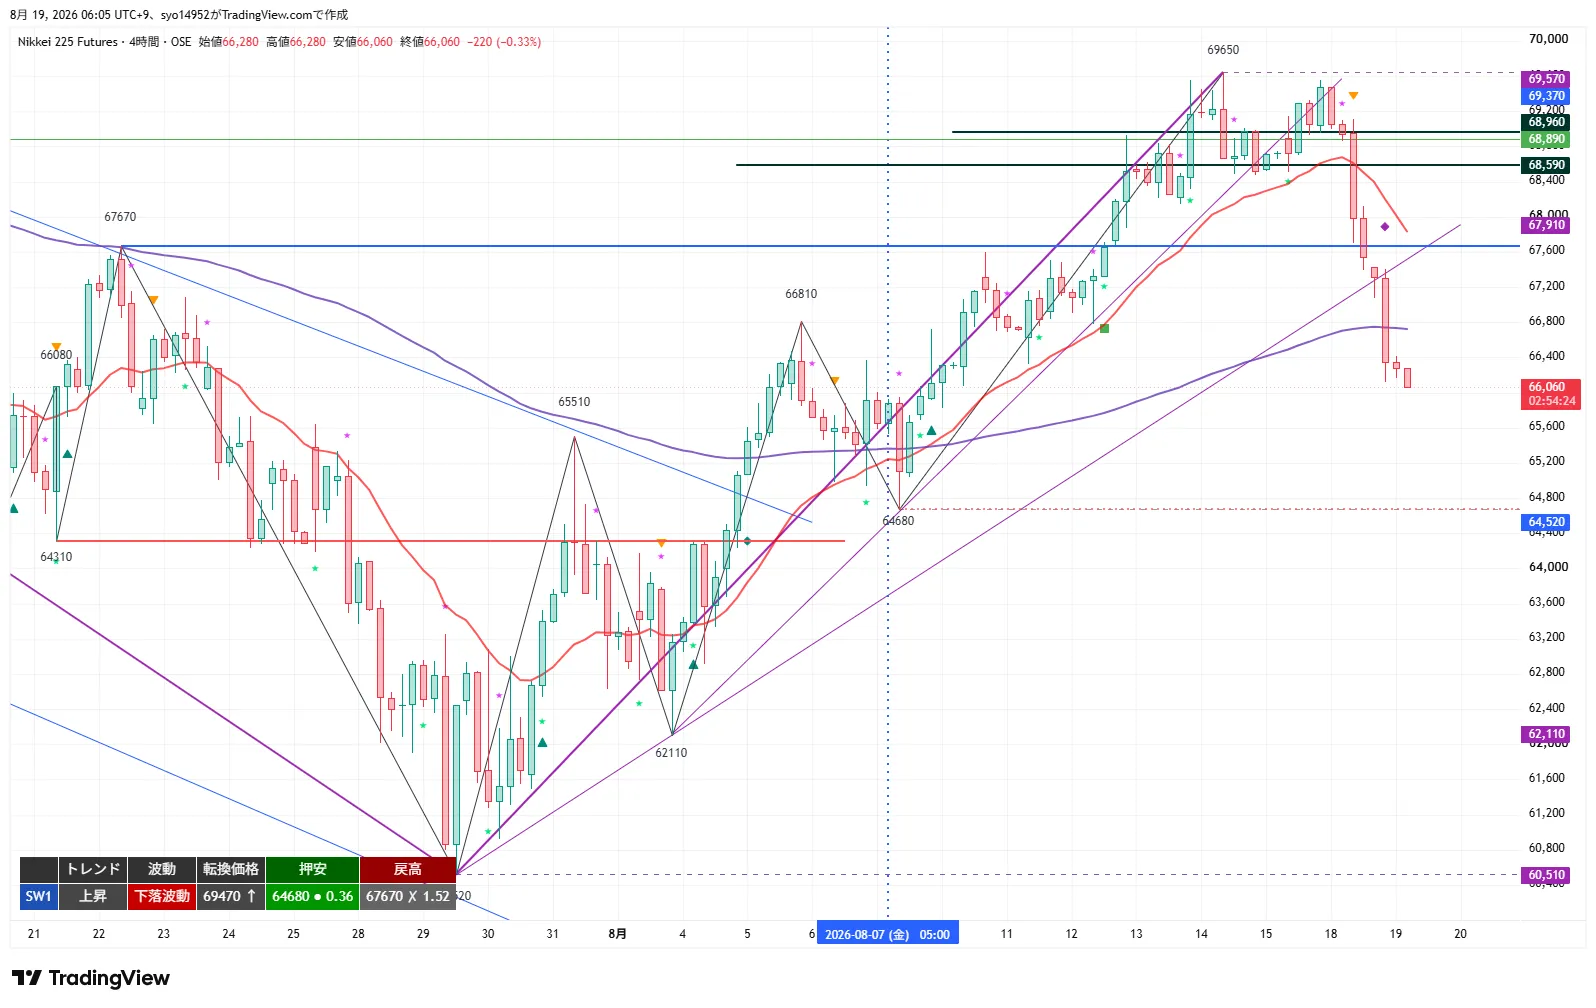
The 4H trend remains upward, but the wave has turned downward. After peaking at 69,650 and pulling back, it broke back below the previously broken 67,670 on a closing basis, causing the 4H breakout to fail. The 20 EMA (near 67,900) has turned negative, and the price is below the 120 EMA (around 66,750 on the daily). After a strong rise, crossing below MA bands suggests a shift to range or corrective phase; treat accordingly.
Support levels: 65,880, 65,510, 64,980, with 64,680 (4H minor low) as a pivotal point. If broken on a close, the 4H would turn downward. Resistance remains until a close above 67,670, at which point the bounce would be confirmed; until then, selling rallies remains preferable. The conversion price 69,470 is more than 3,400 away from the current price, making a return to an uptrend unlikely in the near term.
1H Analysis
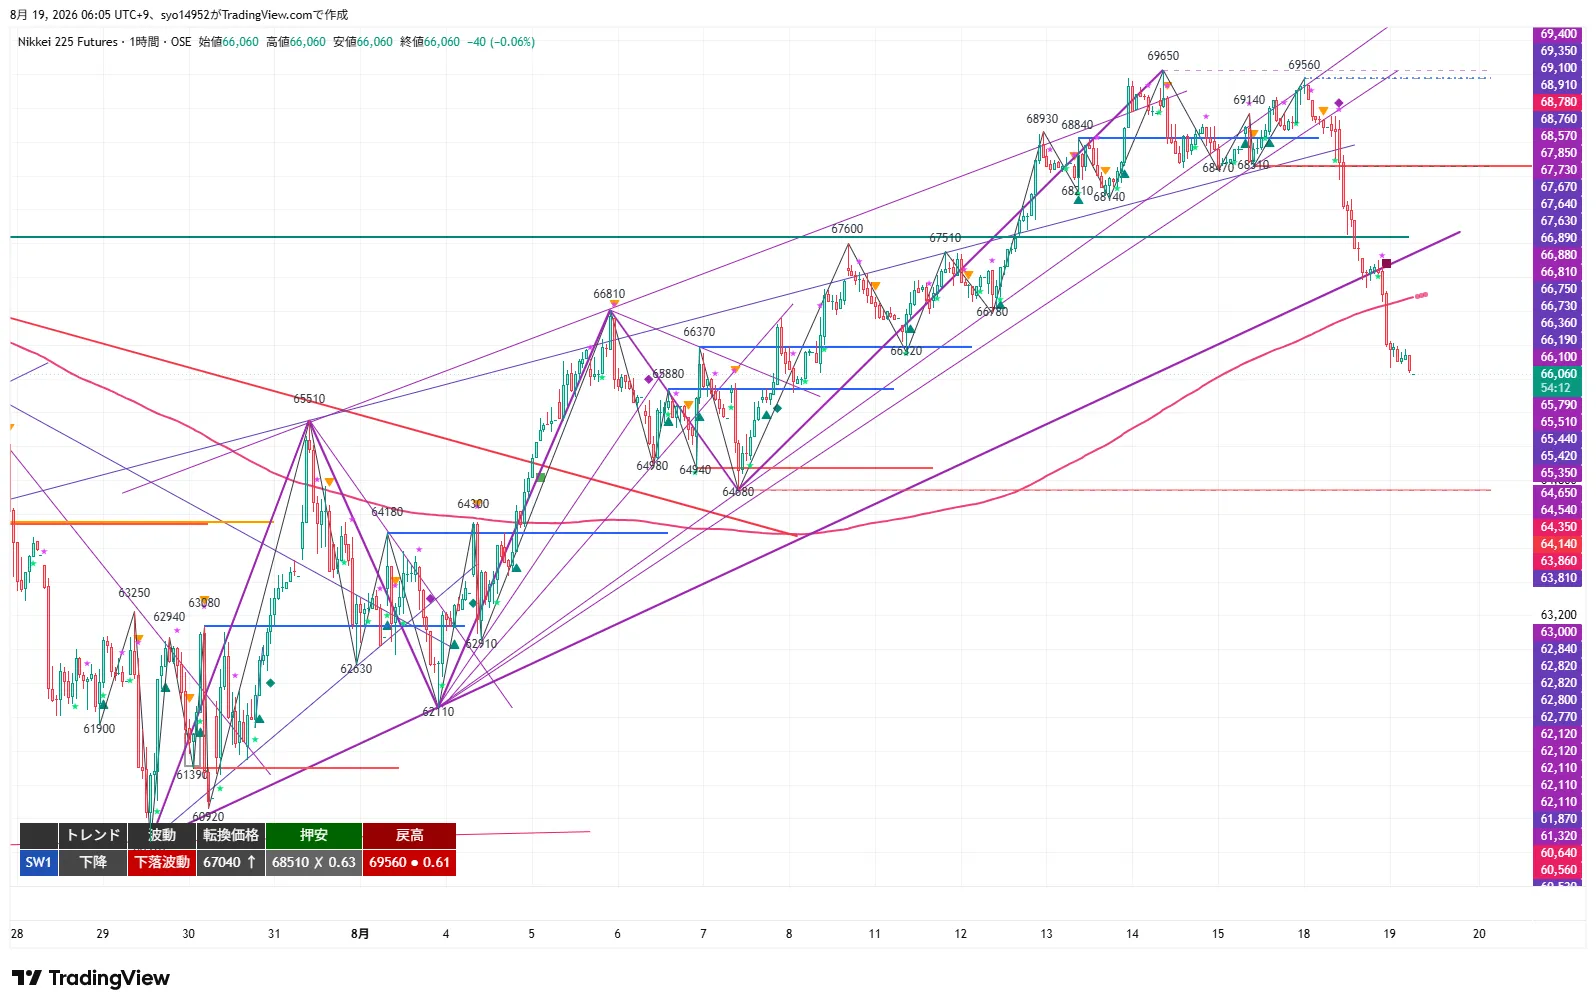
The 1H has turned into a downtrend and downward wave after breaking 68,510 on a close. After the intraday collapse on 8/18, there was no meaningful rebound; the price hit a low of 66,060 at the close after stalling at 67,400. The 20 EMA and 80 EMA (4H 20 EMA equivalent at around 67,900) are both negative, and the price is below them; the 480 EMA (daily 20 EMA around 66,750) is also breached, so MA alignment is fully downward.
Pivot price is 67,040. A recovery past this on a 1H close is required to shift the downward wave to an uptrend. Until then, the pullback buying is considered a trend-following play, with realistic bounce zones at 66,350–66,480, and 66,780–66,810. Support targets are 65,880, then 65,510 and 64,940 in stages.
15m Analysis
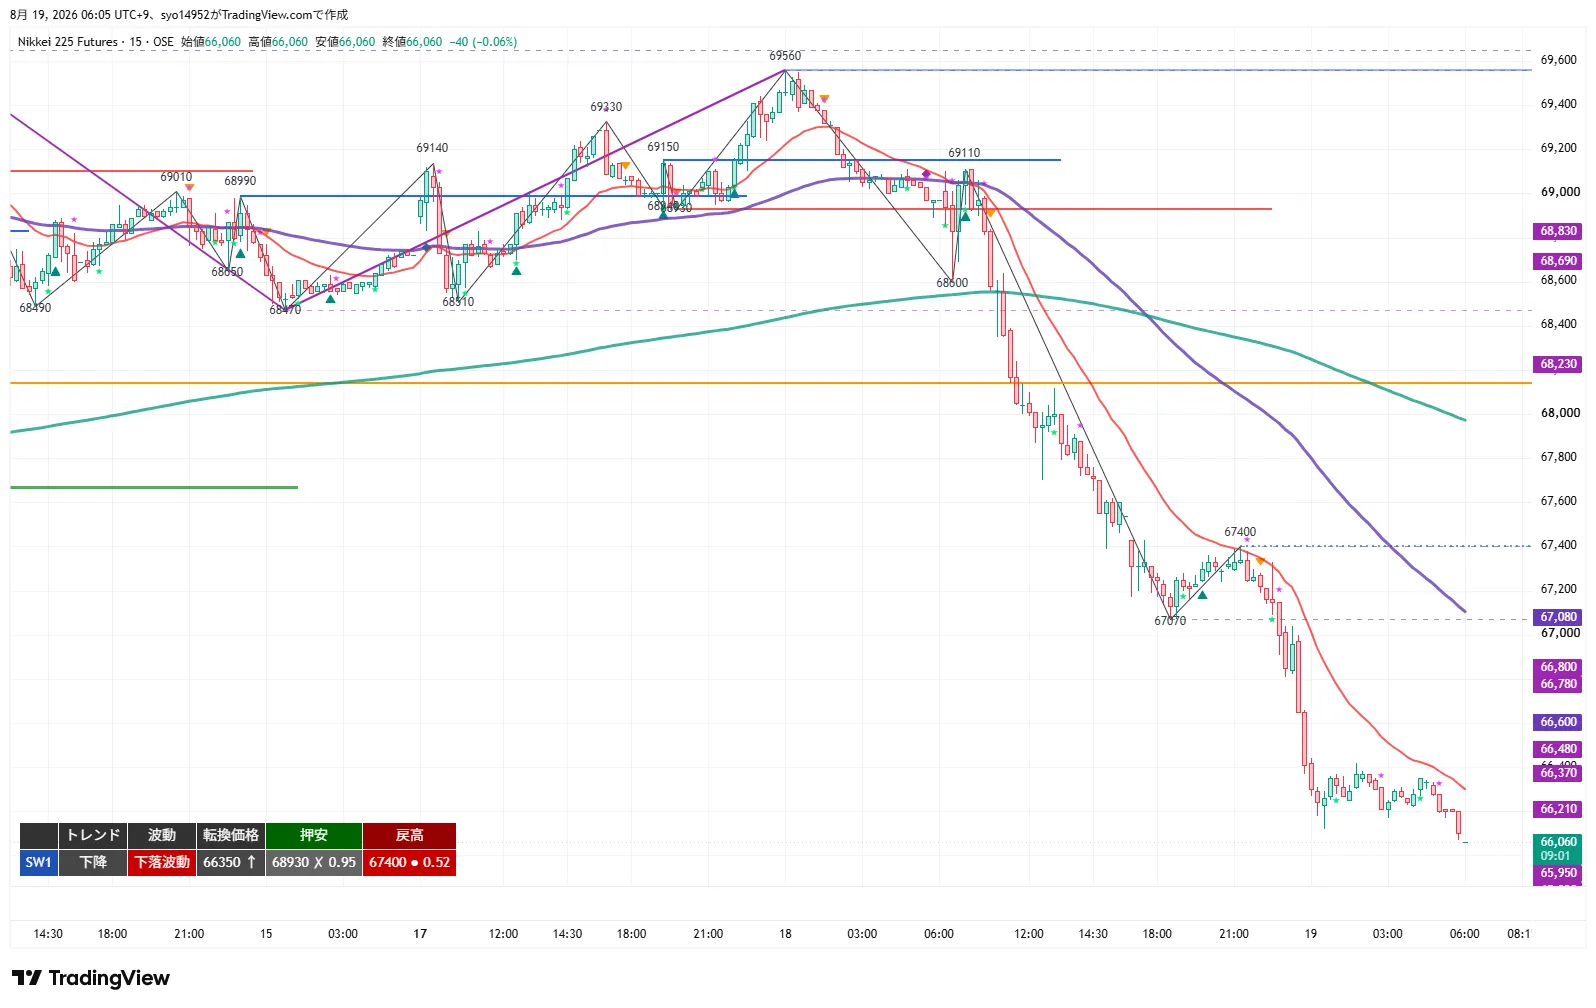
The 15m is in a downtrend downward wave. After peaking at 69,110 intraday on 8/18, it broke the minor low of 68,930, then continued down through 68,600, 67,070, 67,400, to 66,060, with both swing highs and swing lows progressively lower. Night session late saw a brief sideways move between 66,210 and 66,480, but it ultimately broke lower to close at the day’s low.
The 20 EMA around 66,350 is near the pivot price 66,350; this marks the first branching point. The 80 EMA (roughly 67,080) and the 320 EMA (around 68,000) are higher and still sloping downward. A quick initial rebound at or near the open is likely, but until 66,350 is recovered on a close, treat as a pullback/dip within the downtrend.
MTF State
- 4H: Uptrend / Downward wave. Pivot 69,470; support 64,680; resistance 67,670 (return high). Broke back above 67,670 but closed below it, so breakout failed. 20 EMA is negative, price below 120 EMA.
- 1H: Downtrend / Downward wave. Pivot 67,040; support 68,510 (X); return high 69,560. All MAs negative and price below, with 480 EMA breached.
- 15m: Downtrend / Downward wave. Pivot 66,350; support 68,930 (X); return high 67,400. All MAs negative and price below.
- Consistency: 1H and 15m align on downside, 4H also in a downward wave. Direction is largely aligned for selling rallies (trend-following); buying would be contrarian and only confirmed by a clear rebound.
Key Prices
- 67,910 JPY: Resistance on the way up. Upper bound for the rebound.
- 67,670 JPY: 4H old rebound high. Fell through on a close; breakout failure suggests resistance turned into support.
- 67,400 JPY: 15m rebound high.
- 67,070 JPY: 8/18 Night session low. Broken, now a resistance turned support.
- 67,040 JPY: 1H pivot price. Primary level strengthened; exits from zones 3 and 4.
- 66,810 JPY: 1H pivotal level (around 8/6 high). Zone 3 upper bound.
- 66,600 JPY: Near-term consolidation upper limit.
- 66,480 JPY: Near-term reversal point. Zone 3, part 1 upper bound.
- 66,350 JPY: 15m pivot price; 15m 20 EMA band. Short-term critical bifurcation.
- 66,210 JPY: Near-term consolidation lower bound (already broken).
- 66,060 JPY: Current price; night session low and close. Low close.
- 65,950 JPY: Immediate pivot. Zone 2 upper bound.
- 65,880 JPY: 1H minor low of 8/7; Zone 3 T1.
- 65,510 JPY: 8/5 high area = support turned. Zone 3 T2 and Zone 4 T1.
- 64,980 JPY: 8/7 low area. Zone 4 T2.
- 64,680 JPY: 4H minor low. If broken, 4H also turns downward.
- 64,520 JPY: 4H turning point. Final downside target.
Trading Ideas
① Breakout Following (Long)
- Trigger: Break above 66,350 (15m pivot price, 15m 20 EMA band) on a 15m close.
- Entry price: 66,350. After the breakout, look for a pullback toward the breakout level or around the inclined 20 MA on a short time frame (back-entry).
- Actual entry price: 67,050 (1H close recovery).
- Stop loss: 66,040 for the ahead position, 66,340 for the main position. Fully exit at 65,940.
- Targets: 66,810 (partial take + price move), 67,400.
- RR: T1 (66,810) = 1.5 / T2 (67,400) = 3.4.
- MFE protection: exit at break-even or small profit with +200, or secure at least +100 with +300 trailing. Since all timeframes are in a down wave for a rebound play, protect early.
② Buy the Dip (Long)
- Standard conditions: Zone 1 65,880–65,950 (8/7 1H low to just below pivot), Zone 2 65,440–65,510 (8/5 high area = support turned). Confirm a clear rebound within the zone on a 15m close.
- Early entry price: 65,930 (if entering from deep dip zone, set stop at 65,340).
- Main entry price: 66,350 (1H close recovery).
- Stop loss: 65,760 for the ahead position, 65,430 for the main position. Fully exit at 64,660.
- Targets: 66,350 (partial take + price move), 66,810–67,040.
- RR: T1 (66,350) = 2.5 / T2 (66,810) = 5.2.
- MFE protection: exit at break-even or small profit with +200, or secure at least +100 with +300 trailing. As this is a contrarian strategy, prioritize protection and avoid chasing.
◎ ③ Sell the Rally (Short)
- Standard conditions: Zone 1 66,350–66,480 (15m pivot price & 15m 20 EMA band ~ near the recent reversal point), Zone 2 66,780–66,810 (1H pivot point & 8/6 high area). Confirm stall pattern within the zone on a 15m close.
- Early entry price: 66,420 (if entering from Zone 2, replace stop with 66,890).
- Main entry price: 66,030 (1H close below).
- Stop loss: 66,620 for the ahead position, 66,490 for the main; fully exit at 67,050.
- Targets: 65,880 (partial take + price move), 65,510–64,940. 65,880 is a point where RR drops below 1.0, so treat as a passing point.
- RR: T1 (65,880) = 2.7 / T2 (65,510) = 4.6.
- MFE protection: exit at break-even or small profit with +200, or secure at least +100 with +300 trailing. Since near-term the price tends to rebound after a local low, secure progressively to avoid false rebounds.
④ Breakout Following (Short)
- Trigger: Break below 66,050 (Night low / close 66,060) on a 15m close.
- Early entry price: 66,050. After the break, look for a pullback toward the breakout price or toward the inclined 20MA on a short time frame (back-entry).
- Main entry price: 65,870 (1H close below).
- Stop loss: 66,270 for the ahead position, 66,360 for the main; fully exit at 67,050.
- Targets: 65,510 (partial take + price move), 64,980 / 64,680. 65,880 is a point where RR is below 1.0, so treated as a passing point.
- RR: T1 (65,510) = 2.5 / T2 (64,980) = 4.9.
- MFE protection: exit at break-even or small profit with +200, or secure at least +100 with +300 trailing. After the low is broken, beware of false breaks and sharp rebounds.
Actions at Present
- Most important Line 1: 66,350 – 15m pivot price & 15m 20 EMA band. If the rebound stalls here, use Zone 3; if a close above on a 15m close occurs, switch to strategy 1.
- Most important Line 2: 66,060 – Night low / close. If broken on a 15m close, indicate 65,510 direction in Zone 4. A break of 64,680 (4H minor low) would turn 4H downward.
Entry prices, triggers, and stops are set based on chart shapes at close times (pivot prices, minor lows, and swing highs for each timeframe). If the structure evolves over time, unless there is a higher-timeframe structural change, adjust entry prices using the down-to-up wave transition prices of the lower timeframes (e.g., if a shorter timeframe temporarily enters an up wave before turning down), and adopt the option that aligns more closely with the actual condition.
※ Because of the low close, the price tends to see a rebound soon after the market opens. For shorts, the basic approach is to wait for a rebound before entering, and to avoid chasing during continued declines until a clear 15m close breach confirms the move.
※ This report is for information purposes and not a recommendation to buy or sell; investment decisions are your own responsibility.