

Is it essential in technical analysis?! What is Dow Theory? Technical Analysis Fundamentals Course #5
Hello! I am SAKU!
Previous article looked into the basics for reading charts, including "how to draw waves"!
And in this article, we will cover extremely important concept of “Dow Theory” that is essential for learning technical analysis!
Since it is a very important theory that forms the foundation of technical analysis, let’s study it thoroughly!!
What is Dow Theory
Dow Theory is a theory proposed by American securities analyst and journalist Charles Henry Dow for evaluating price movements in the stock market.
Dow Theory consists of the followingsix principles and is used for recognizing market conditions, creating trading plans, assumptions, and one of the reasons for entry.
Although proposed over 100 years ago, it is still known as a valid theory today.
① The market price reflects all events
② Averages must confirm each other
③ Trends must be confirmed by volume
④ There are three types of trends
⑤ Primary trends consist of three phases
⑥ A trend continues until a clear reversal signal occurs
All are important, but especially crucial are laws ④, ⑤, and ⑥. (The order is arranged for easy explanation)
Reading only the text won’t make sense (sweat)
Let’s look at them one by one.
・① The market price reflects all events
Market price is determined by the consensus of participants to buy or sell at that price.
Prices are determined by participants’ consensus, creating price movement. And past price movements become material for current participants’ psychology and directional judgment.
Price moves result from a combination of fundamental factors such as economic conditions and market psychology among others.
→ In other words
All information is contained in the chart’s price movements, and past movements signal future price movements.
What this means is that charts contain many pieces of information, so you don’t need to perform complicated fundamental analysis;technical analysis that analyzes price movements alone is enough.
・② Averages must confirm each other
In Dow’s era in the United States, there were strong interrelations between industrial production and railroad-related businesses, so their stock prices influenced each other.
Applying this to the FX world…
・Average price represents market strength.
→ You can judge market strength by the position of actual price relative to the average price (use multiple moving averages, etc.).
・Compare other indicators with strong interrelations.
→ Interest rates and stock indices (fundamental factor analysis)
・Compare individual currency pairs.
→ For example, in a situation where USD/JPY rises, EUR/JPY falls, and EUR/USD falls,
USD/JPY rises … Scenario ① USD is stronger than JPY
EUR/JPY falls … Scenario ② EUR is weaker than JPY
EUR/USD falls … Scenario ③ EUR is weaker than USD
From these, you can infer the relative strength of the currencies pairs involved: USD > JPY > EUR. That’s the idea!
・③ Trends must be confirmed by volume
Volume refers to the action of investors (the total quantity traded on the market over a certain period).
However, in FX trading, you cannot confirm volume in the precise sense (in stocks you can analyze volume or order book).
Some brokers offer services to confirm volume (e.g., Click 365), but those are not real-time and show data over a period.
As a substitute for volume, oscillator indicators (RSI, Stochastics, etc.) can be used to reference overbought/oversold. Some people use Volume indicators (Tick Volume) too!
By the way, I sometimes use RSI or Volume indicators, but I rarely make trading decisions based on oversold/overbought alone. I’ll discuss this in another opportunity.
・④ There are three kinds of trend
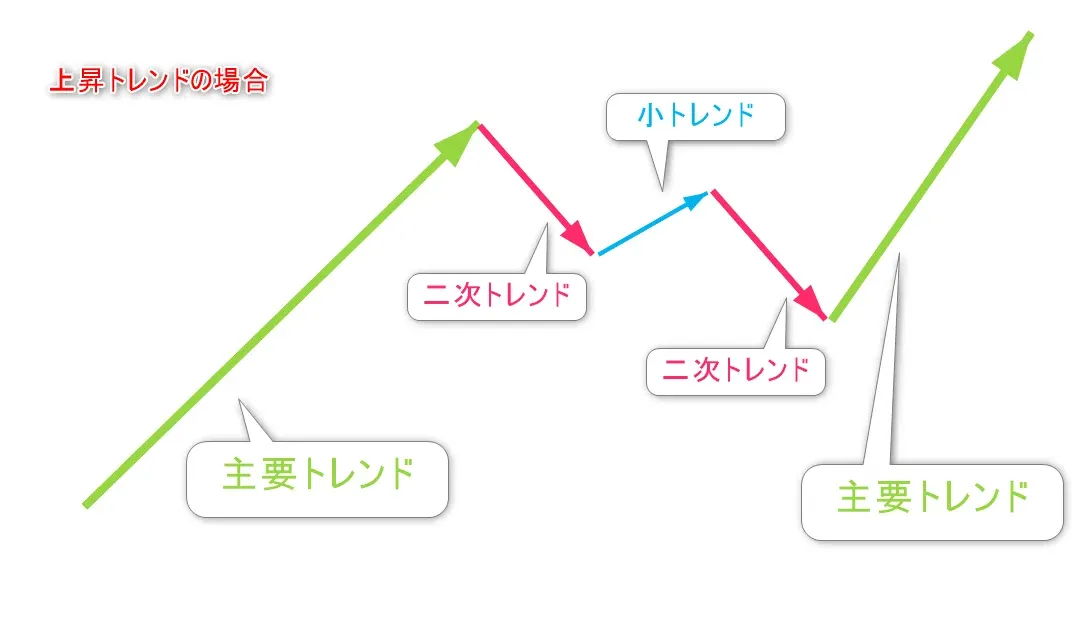
Trends consist of primary trend, secondary trend, minor trend and three kinds.
Primary trend・・・ main price movement in the trend direction
Secondary trend・・・ corrective price movement opposing the primary trend
Minor trend・・・ corrective price movement opposing the secondary trend (same direction as the primary trend)
Trends indicate the overall market direction (bullish or bearish), but they do not move in a straight line. For example, in an uptrend, overall it rises, but actual price moves up and down in waves.
If you don’t truly sense this, you might enter a buy during an uptrend and get scared by a pullback, triggering a stop loss, then the price rises in your intended direction afterward.
Considering the overall trend, think carefully whether the current movement is continuing in the trend direction (impulsive wave) or a temporary decline (corrective wave). (The discussion of impulsive vs corrective waves touches on Elliott Wave Theory, which I’ll cover another time)
In short, Even though we call it an uptrend, it doesn’t mean it goes up nonstop!That’s the idea!
・⑤ Primary trend consists of 3 phases
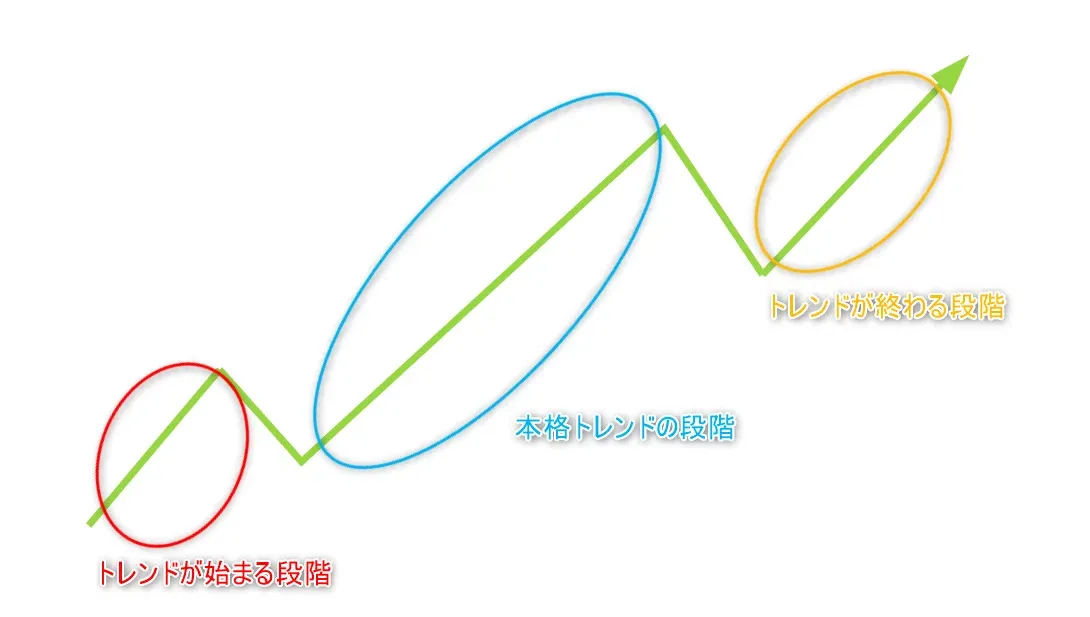
In a primary trend, ① the phase where the trend begins, ② the phase of a full-fledged trend, ③ the phase where the trend ends and three phases exist. (The following explains based on an uptrend)
① Phase where the trend begins・・・ leading investors begin buying.
Often still in a decline at this stage, and since the trend hasn’t clearly formed yet, those who start buying here might build the future trend. It requires some skill and wealth; otherwise it could just be counter-trend.
② Phase of a full-fledged trend・・・ many investors align toward buying, and the trend gains momentum. This is the main target.
③ Phase where the trend ends・・・ leading investors and others who had bought begin to take profits, and the trend gradually ends.
Over months or years in a very long time span, there comes a period when the economy is talked about positively in the media.
Amateurs start buying as the media enthralls them, but from an investor’s perspective, this is the time to take profits. It is okay to aim for short-term gains knowingly.
“In a market, you are born from pessimism, grow in skepticism, mature in optimism, and disappear in happiness.”
There is a market adage, and if you fall for the crowd’s manipulation you’ll end up with a loss.
One thing to note here is not to confuse ④ “There are three kinds of trends” with ⑤ “There are three phases”. Please do not mix them up!!
※ In Elliott Wave Theory, these trend phases correspond to impulsive waves 1, 3, 5, but this theory is deep and complex, so you don’t need to worry about it right now.
・⑥ Trends continue until a clear reversal signal occurs
This is obvious. Until price action clearly shows that the trend has ended, the trend is considered ongoing.
Knowing the definition of trends helps beginners avoid meaningless counter-trend trades. It is very important to be able to determine when a trend starts and ends.
That’s all about Dow Theory!
It is a must-have extremely important theory in technical analysis, so read the article several times until you truly understand it!
Occasionally you may see the word “trend.” You might wonder what it means.
The definitions of trend, its end, and trend reversal are also extremely important, so I’d like to explain them in detail in the next article!
Details of the author’s trading method are here ↓
MTF Multi-Time Frame Analysis Essentials(Discount until August 31, 2026 23:59 is ongoing!)
Next article here↓