

Is it essential in technical analysis?! What is Dow Theory? Technical Analysis Fundamentals Course #5
Hello! This is SAKU!
Previous article examined the foundational concept of "how to draw waves" that underpins chart reading!
In this article, we will discuss extremely important concept of "Dow Theory" Dow Theory.
Dow Theory is a very important theory that forms the foundation of technical analysis, so let's study it thoroughly!!
What is Dow Theory
Dow Theory is a theory proposed by Charles Henry Dow, an American stock market analyst and journalist, for evaluating price movements in the stock market.
Dow Theory consists of the following six laws and is used for recognizing market conditions, creating trading plans, making assumptions, and as a basis for entry decisions.
Although proposed over 100 years ago, it is still known as a valid theory today.
① The market price discounts all information
② Averages must confirm with each other
③ Trends must be confirmed by volume
④ There are three kinds of trends
⑤ Primary trends consist of three stages
⑥ Trends continue until a clear reversal signal occurs
All are important, but especially crucial are rules ④, ⑤, and ⑥. (The order is arranged for easier explanation)
Reading only the words alone is meaningless, right (sweat)
Let's look at them one by one.
・④ There are three kinds of trends
Market price is determined by the consensus of participants to buy or sell at that price.
Prices are determined by participants' agreement, generating price movement. And past price movements serve as the psychological state and directional clues for current participants.
Price movement results from a mix of fundamental factors such as economic conditions, and market psychology among other factors.
→ In other words
All information is embedded in chart price movements, and past movements foreshadow future movements.
What this means is that because charts contain many pieces of information, you can rely on technical analysis to analyze price movement without needing to perform difficult fundamental analysis!Price movement analysis alone is sufficient.
・② Averages must confirm with each other
In Dow’s era in the United States, industrial production and railway-related businesses had strong interdependencies, so their stock prices influenced each other.
Applied to the FX world...
・Average price represents market strength.
→ By looking at the position of actual price relative to the average, you can judge market strength (using multiple moving averages, etc.).
・Compare with other indicators that have strong interrelations.
→ Interest rates, stock indices, etc. (fundamental factor analysis)
・Compare individual currency pairs.
→ For example, in a scenario where USD/JPY rises, EUR/JPY falls, and EUR/USD falls,
USD/JPY rises – assumption ①: USD is stronger than JPY
EUR/JPY falls – assumption ②: EUR is weaker than JPY
EUR/USD falls – assumption ③: EUR is weaker than USD
From these, we can infer the relative strength at that moment is USD > JPY > EUR. That’s the idea!
・③ Trends must be confirmed by volume
Volume refers to the action of investors (the total quantity traded within a certain period).
However, in FX trading, you cannot confirm real volume in the exact sense. (In stocks, you can analyze volume or read the order book.)
Some brokerage services provide volume data (like Click 365). However, it is often not real-time but shows data for a certain period.
As a substitute for volume, oscillator indicators (RSI, Stochastics, etc.) can be used to gauge overbought or oversold conditions. Some people use Volume indicators (Tick Volume) as well!
For reference, I sometimes use RSI or Volume indicators, but I rarely make trading decisions based on simple overbought/oversold signals. I’ll share more on this in a future article.
・④ There are three kinds of trends
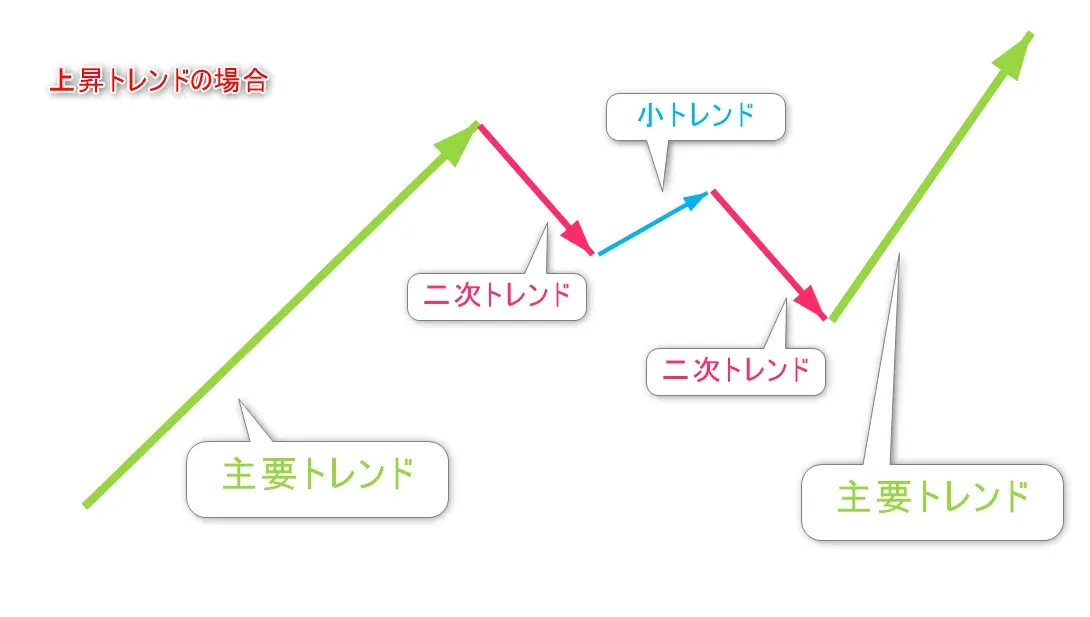
The trends are primary trend, secondary trend, minor trend, three kinds.
Primary trend・・・ main price movement in the trend direction
Secondary trend・・・ opposing movement that corrects the primary trend
Minor trend・・・ opposing movement that corrects the secondary trend (same direction as the primary trend)
Trends indicate the stronger market direction (bullish or bearish), but they do not move in a single direction all the time. For example, in an uptrend, overall prices rise, but actual movements go up and down in waves as they rise.
If you don’t grasp this as a feeling, you might buy during an uptrend and then fear a pullback, triggering a stop-out, only to see the market move higher in your intended direction afterward.
Keep the overall trend in mind, and think carefully whether the current movement is moving with the trend (impulse wave) or a temporary decline (correction wave). (The discussion of impulse and correction waves touches on the Elliott Wave Theory, which I’ll cover in another opportunity.)
In short, even in an uptrend, it’s not always a straight rise!That’s the idea!
・⑤ Primary trends consist of three stages
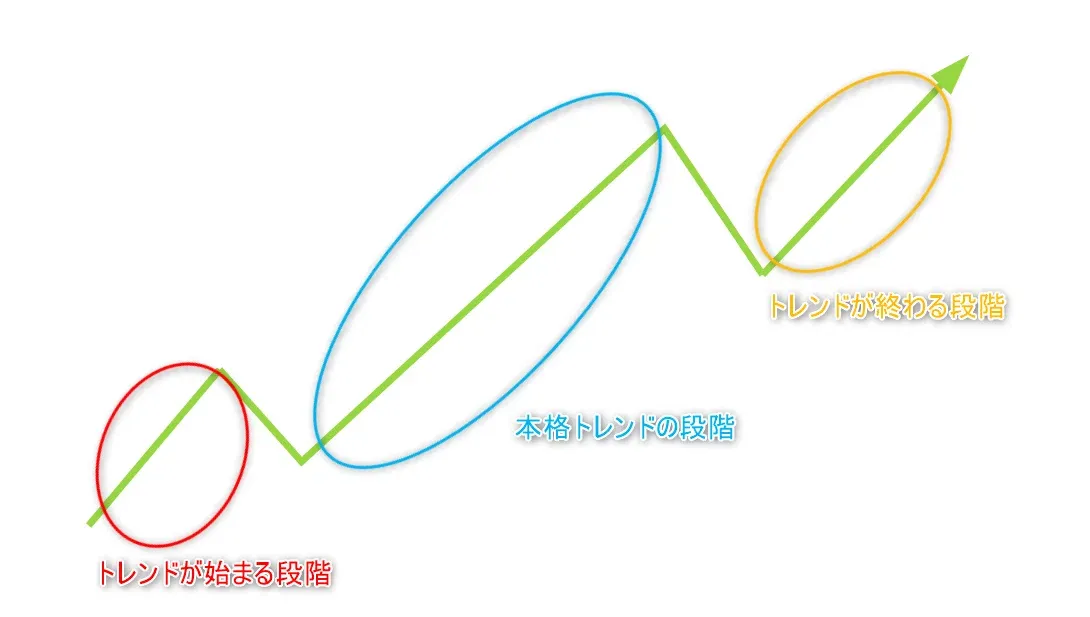
Within the primary trend, ① the stage where the trend begins, ② the stage of a full-blown trend, ③ the stage where the trend ends, three stages exist. (The following explains the uptrend case)
① Stage where the trend begins・・・ early investors start buying.
Here it is often still in a decline, and since the trend hasn’t clearly formed yet, those who start buying at this stage may end up being contrarians unless they have sufficient skill and capital.
② Stage of a full-blown trend・・・ many investors’ eyes begin to align toward buying, and the trend gains momentum. This is the main target area.
③ Stage where the trend ends・・・ early investors who have been buying start taking profits, and the trend gradually ends.
When considering multi-month to multi-year long-term horizons, it’s the period when the economy is performing well and is being talked about in the media.
An amateur may be swayed by the media to buy, but professionally it is the time to take profits. It is reasonable to aim for quick profits when you know what you’re doing.
“The market is born in pessimism, grows in doubt, matures in optimism, and dies in happiness.”
There is a market adage, but if you fall for the crowd’s manipulation, you’ll end up with a bad deal.
Note here: do not confuse ④ “there are three kinds of trends” with ⑤ “three stages.”- and ⑥ three stages with three kinds of trends, please don’t mix them up!!
※ In Elliott Wave Theory, the stages correspond to impulsive waves 1, 3, 5, but the wave theory is deep and complex, so you don’t need to worry about it now.
・⑥ Trends continue until a clear reversal signal occurs
That’s exactly it. Until price movements clearly indicate that the trend has ended, we consider the trend ongoing.
Once you know the definition of a trend, you can avoid meaningless contrarian trades that beginners often fall into. It’s crucial to be able to judge when a trend has started and ended.
That’s all for the explanation of Dow Theory!
It is a must-know, ultra-important theory in technical analysis, so please reread the article several times until you fully grasp it!
You may have wondered, occasionally, what people mean by “trend.”
The definitions of trend, trend termination, and trend reversal are also, again, extremely important, so I’d like to explain them in more detail in the next article!
If you found this article helpful, please give it a like or a heart! It would be a great encouragement!
For details of the author's trading method, click here ↓

【Limited-time launch campaign!】→ MMS Trading Encyclopedia— What is the "structural trap" that individual investors fall into and the Market Microstructure Analysis that reveals the footprints of the big players (A free trial version is also available)

→Key to MTF Multi-Time Frame Analysis (A free trial version is also available)
Next article here↓