
NK225 Futures MTF Dow Theory 4-Scenario Analysis Report 2026-08-18
NK225 Futures MTF Dow Theory Analysis Report
Date and Time: August 18, 2026 06:08 JST / Night Session
Current Price: 68,970 JPY
Target: For the intraday session (8/18 Tuesday)
Conclusion
In summary, during the day on 8/17 the price dipped to 68,510 and then retraced to 69,140; the night session began at 69,290, fell to 68,890, then rose to 69,560 before stalling and closing at 68,970. The 4-hour chart shows an uptrend and rising wave, the 1-hour chart shows an uptrend with a downward wave, and the 15-minute chart shows a range with a down wave, indicating that the higher timeframe direction remains unchanged while the lower timeframe is in a corrective phase.
The current 68,970 sits just above the 15m support at 68,930. If it closes above this level and recovers to 69,110, buy-on-dip strategies become effective; if it closes above 69,560 (the 1H turning price) on a 15m close, follow-through buying on a breakout. Conversely, if 68,930 is broken on a 15m close, the short-term uptrend would be compromised and a correction to 68,590–68,510 could unfold. The 68,510 level represents a lower boundary where 1H support and 4H turning price coincide, acting as a critical lifeline.
4H Analysis
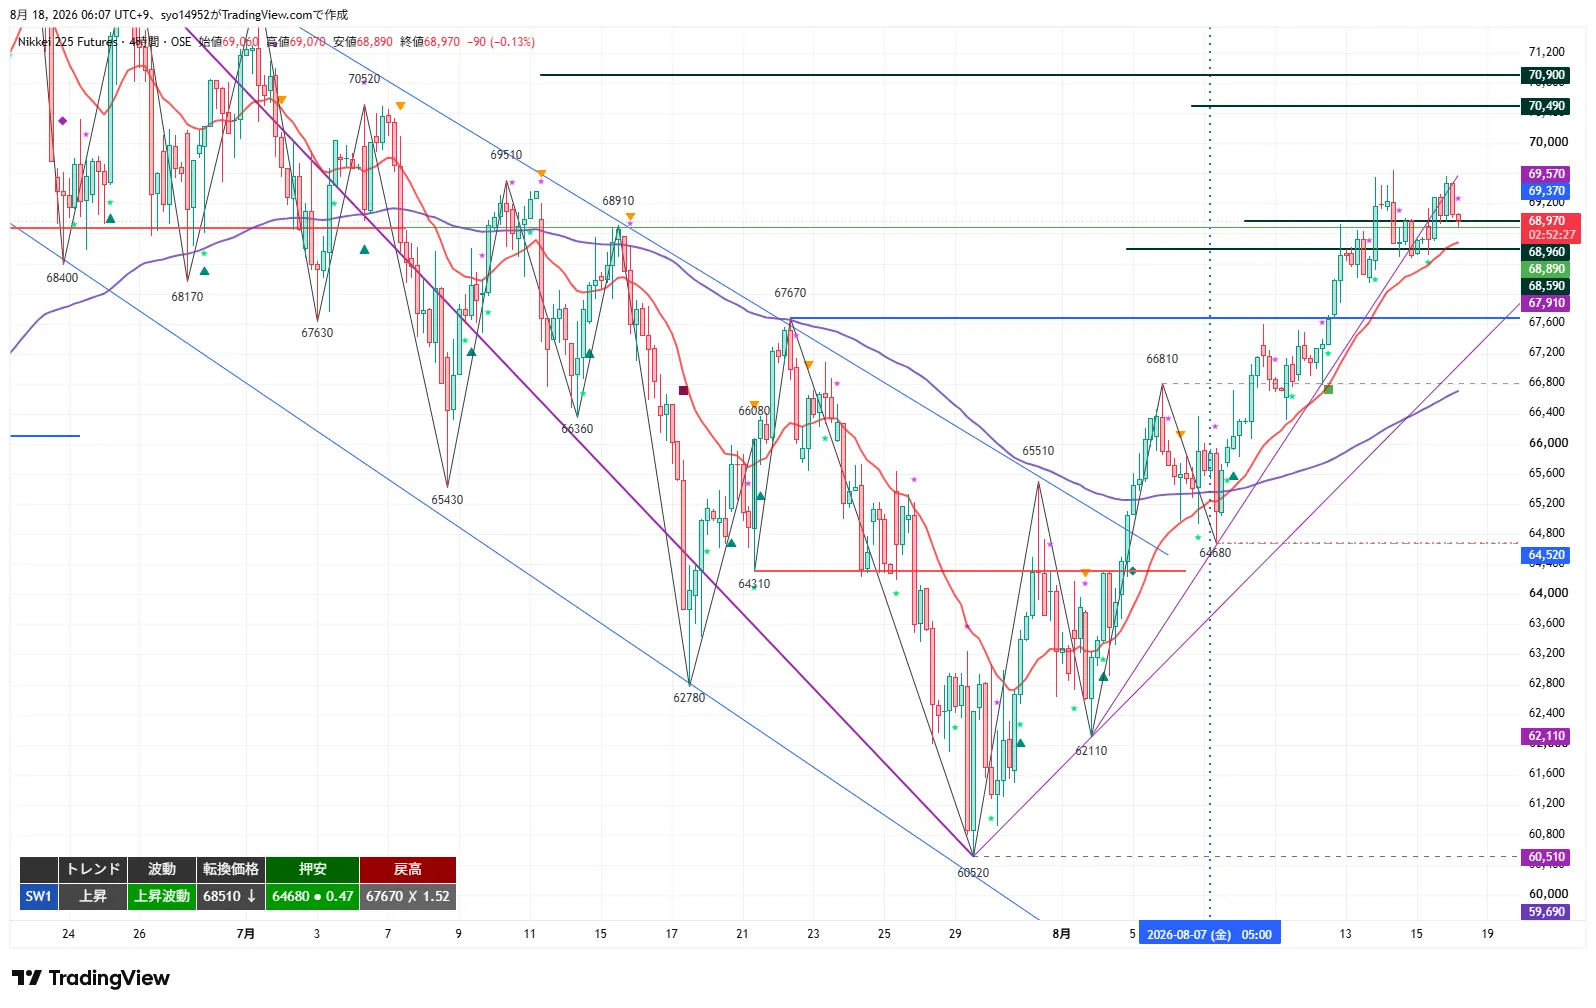
The 4H chart maintains an uptrend and rising wave. From a starting point around 60,520, the price has closed above 67,670 (the previous retracement high), turning that level into support. The 20 EMA/20 SMA near 68,600 is sloping upward with prices above them, and the 120 EMA (roughly equivalent to the daily 20 EMA around 66,700) and the 200 EMA are significantly apart, indicating the bullish structure remains intact.
However, the turning price has risen to 68,510, which coincides with the 1H support. If the 4H rising wave is broken by a close below this level, the lower boundary becomes the sole lifeline. On the upside, 69,650 is a waypoint, with 70,490 and 70,900 serving as progressively higher targets. The most recent leg reached 69,070 and retraced to 68,970; note the increased upper wicks at higher prices.
1H Analysis
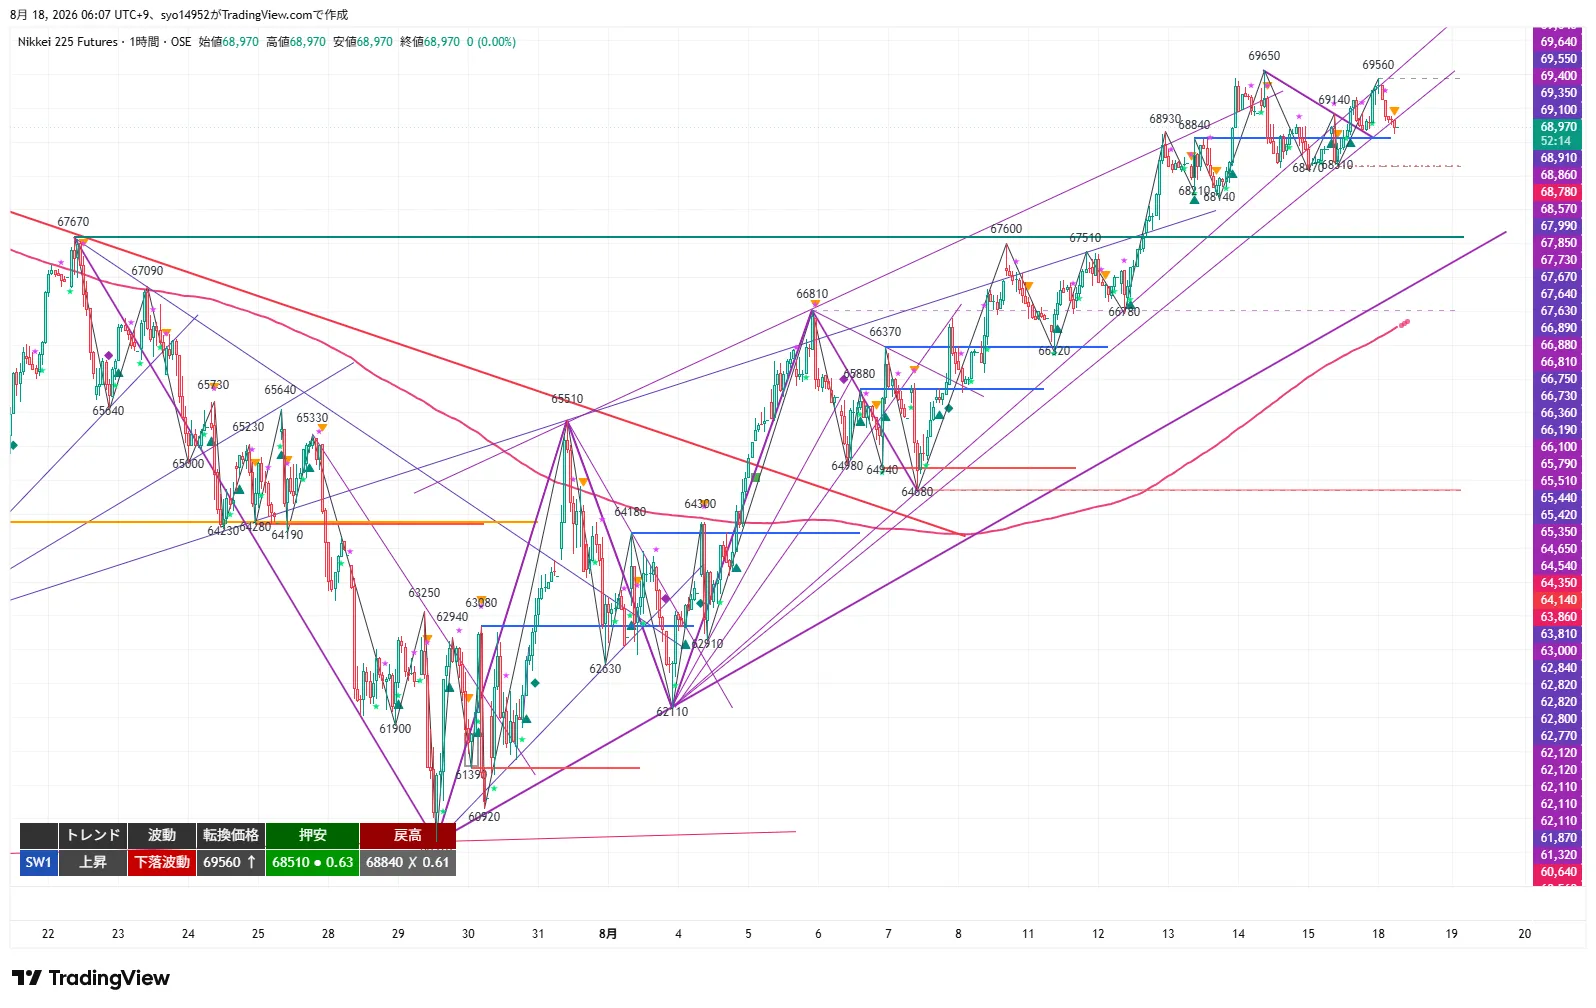
The 1H chart held an uptrend but entered a corrective-downward wave. It dipped to 68,510 during 8/17, rebounded, and extended to 69,560 in the night session, but failed to push new highs and turned down. The slope of the 20 EMA (around 69,100) has flattened, indicating a temporary loss of upside momentum.
If the 1H closes above 69,560, the down wave would turn into an uptrend, with a break above 69,650 enabling a new high. Conversely, a close below 68,510 would also break the 4H turning price, increasing the downside weight. The 80 EMA (4H 20 EMA equivalent around 68,800) is positively sloped and provides support, so the zone from 68,930–68,800 is a likely support area.
15m Analysis
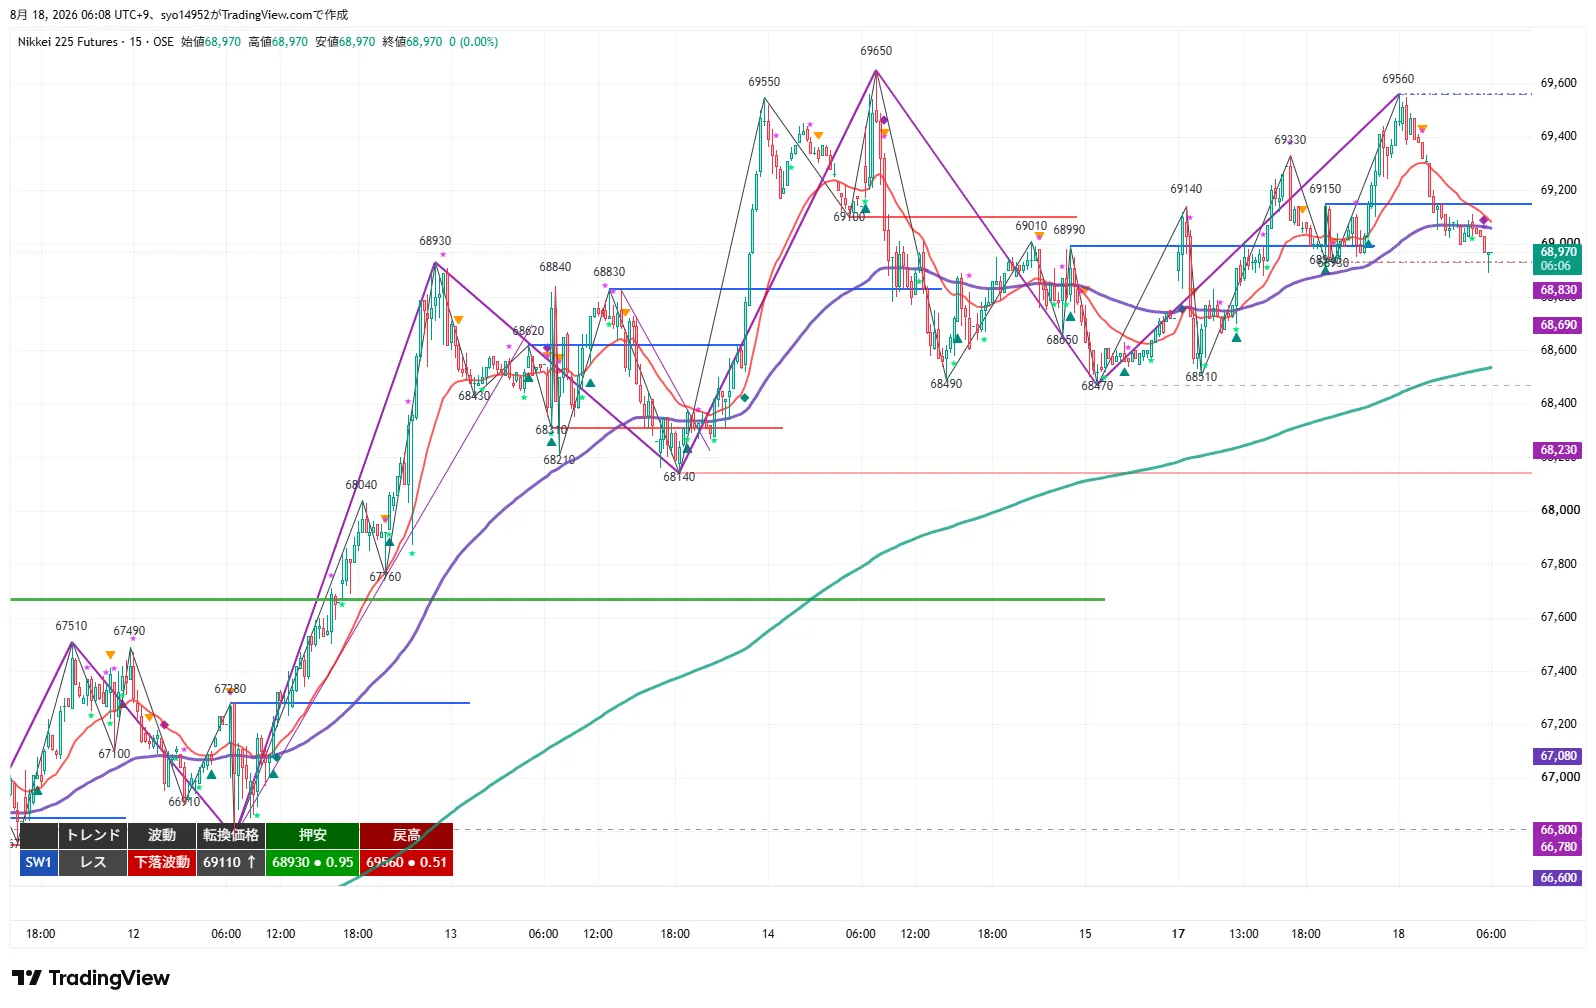
The 15m chart is range-bound with a down wave. The night session started at 69,290, fell to 68,890, then rose to 69,560 and closed near 68,970. The immediate support is 68,930 and resistance at 69,560; current price sits just 40 points above that support.
The 20 EMA around 69,000 is sloping downward, exerting downward pressure, while the 80 EMA (1H 20 EMA around 68,950) and 320 EMA (4H 20 EMA around 68,560) are upward-sloping. Therefore, the first decision point is whether 68,930 closes above; if so, expect a rebound to 69,110 (turning price). If it breaks, expect a correction to 68,590–68,510.
MTF State
- 4H: Up / Upward wave. Turning at 68,510; pullback support at 64,680; retracement high at 67,670 (X). The recent leg started at 69,060 and closed at 68,970, a change of −0.13%. The 20EMA/20SMA are positively sloped.
- 1H: Up / Downward wave. Turning 69,560; pullback support 68,510; retracement high 68,840 (X). 20EMA flat, 80EMA and 480EMA positively sloped.
- 15m: Range / Downward wave. Turning 69,110; pullback support 68,930; retracement high 69,560. 20EMA negative slope; 80EMA and 320EMA positive slope.
- Consistency: 4H up, 1H in correction within an uptrend, 15m in range—higher-timeframe leadership in forming dips. Base strategy is to buy on dips, sell on rallies only until 68,510 is broken.
Important Levels
- 70,900 JPY: Key higher-timeframe resistance on 4H. T2 for scenario 1.
- 70,490 JPY: Key higher-timeframe resistance on 4H. T1 for scenario 1.
- 69,650 JPY: August 14 high. A breakout above would indicate new-high chasing.
- 69,560 JPY: August 18 night high, 1H turning price, 15m retracement high. The most crucial split point for the upside.
- 69,330 JPY: August 17 night retracement high. T1 for scenario 2.
- 69,140 JPY: August 17 intraday high. Inside the first retracement zone.
- 69,110 JPY: 15m turning price. The line that confirms scenario 2.
- 68,970 JPY: Current price / night close.
- 68,930 JPY: 15m support, a key short-term turning point.
- 68,890 JPY: August 17 night low. T1 for scenario 3.
- 68,830 JPY: Lower bound of the pullback zone 1.
- 68,590 JPY: Upper bound of the 4H 20 EMA band and 15m 320 EMA band. T1 for scenario 4.
- 68,510 JPY: 1H pullback support / 4H turning price. Lower boundary lifeline.
- 68,230 JPY: August 13 pullback support range boundary. T2 for scenario 4.
- 67,910 JPY: Upward waypoint.
- 67,670 JPY: 4H old retracement high (closed above) = support turned.
- 64,680 JPY: 4H pullback support. Broad-scale lower bound.
Trading Ideas
① Breakout Following (Long)
- Trigger: Close above 69,560 (8/18 night high, 1H turning price, 15m retracement high) on a 15m close.
- Lead entry price: 69,560. After the breakout, pullbacks near the breakout level or near an upward-sloping 20MA can be timed with short-term entries (back-entry).
- Actual entry price: 69,660 (1H close recovered).
- Stop loss: 69,260 for the leading leg, 69,100 for the main position. Full exit at 68,920.
- Targets: 70,490 (partial take + base price move) and 70,900.
- RR: T1 (70,490) = 3.1 / T2 (70,900) = 4.5.
- MFE Protection: Exit at break-even or small profit at +200; secure at least +100 with +300 or use trailing. Since prices often form upper wicks in the higher price region, protect early.
◎ ② Buy on Dip (Long)
- Standard conditions: Zone 1 is 68,830–68,930 (including Aug 17 night low to 15m pullback low), Zone 2 is 68,510–68,590 (1H pullback low / 4H turning price–4H20EMA band). Confirm rebound shape within the zone with 15m close.
- Lead entry price: 68,900 (if entering from a deep pullback zone, place stop at 68,400 instead).
- Actual entry price: 69,110 (1H close recovered).
- Stop loss: 68,700 for lead, 68,500 for main position. Full exit at 68,130.
- Targets: 69,330 (partial take + base move), 69,560–70,490.
- RR: T1 (69,330) = 2.2 / T2 (69,560) = 3.3.
- MFE Protection: Exit at break-even or small profit at +200; secure at least +100 with +300 or use trailing. Since 1H and 15m are in pullback within a down-move, take partial profits after a round-trip.
③ Sell on Rally (Short)
- Standard conditions: Zone 1 is 69,110–69,330 (15m turning price to Aug 17 night retracement high), Zone 2 is 69,560–69,650 (1H turning price to Aug 14 high). Confirm a stall within the zone with 15m close.
- Lead entry price: 69,150 (if entering from Zone 2, place stop at 69,680 instead).
- Actual entry price: 68,500 (1H close below).
- Stop loss: 69,360 for lead, 68,940 for main. Full exit at 69,570.
- Targets: 68,890 (partial take + base move), 68,510–68,230.
- RR: T1 (68,890) = 1.2 / T2 (68,510) = 3.0.
- MFE Protection: Exit at break-even or small profit at +200; secure at least +100 with +300 or use trailing. Since 4H and 1H are in an uptrend, avoid chasing; do not chase after the move beyond the 20MA in the rally.
④ Breakout Following (Short)
- Trigger: Break below 68,930 (15m pullback low) on a 15m close.
- Lead entry price: 68,930. After the break, time entries near the breakout price or near a downward-tilted 20MA with short-term timeframes (back-entry).
- Actual entry price: 68,500 (1H close below).
- Stop loss: 69,120 for lead, 68,940 for main. Full exit at 69,570.
- Targets: 68,590 (partial take + base move), 68,230 / 67,910.
- RR: T1 (68,590) = 1.8 / T2 (68,230) = 3.7.
- MFE Protection: Exit at break-even or small profit at +200; secure at least +100 with +300 or use trailing. As 4H is in an uptrend, avoid deep chasing; limit to a short-term pullback until breaking 68,510.
Current Action
- Most important Line 1: 68,930 JPY — 15m pullback low. If closed above, it becomes the main line for scenario 2 (69,110 1H close recovery) and the main position; if closed below, switch to scenario 4 and watch 68,590–68,510.
- Most important Line 2: 69,560 JPY — Aug 18 night high / 1H turning price. A close above on 15m indicates scenario 1; a break above 69,650 indicates new-high chasing. Unless breached, 1H remains in a down wave.
Entry prices, triggers, and stops are set based on the chart shape at the close time (turning prices, pullback lows, and retracement highs of each timeframe). If the structure evolves over time, and there is no higher-timeframe structural change, adjust entry prices using the wave turning prices of lower timeframes (e.g., when a short-term timeframe temporarily enters a down wave and later shifts to an up wave), comparing with the initial values and adopting the more accurate one.
※ Since the current price sits just above the 68,930 15m pullback low, the Zone 2 and Zone 4 triggers are likely to be judged almost simultaneously right after the market opens. Both waits for the 15m close confirmation.
※ This report is for information purposes and does not constitute trading advice; please make investment decisions at your own risk.