
NK225 Futures MTF Dow Theory 4-Scenario Analysis Report 2026-08-17
NK225 Futures MTF Dow Theory Analysis Report
Date and time: August 17, 2026 05:48 JST / Night session close
Current price: 68,720 yen
Target: for the intraday session (Mon, 8/17)
Conclusion
In summary, after extending to 69,650 on 8/14 intraday, it fell below 69,100 (reversal point). The 15-minute chart entered a downtrend, the night session started at 68,700, stalled at 69,010, and closed at 68,720. The 4-hour chart maintains an uptrend and rising move, but the 1-hour chart is range-bound with a downward move, and the 15-minute chart shows a downtrend with an upward move, indicating conflicting directions between higher and lower timeframes.
The focus is whether the range of 68,470–68,990 will break to the upside or downside. If price closes above 68,990 (15m pullback high / 1H reversal price) on the 15m close, it suggests a breakout-follow trade; if it rebounds from 68,470–68,570, it’s a buying dip. If 68,470 (4H reversal price) is closed through on the 15m close, the uptrend on the 4H would be undermined, so switch to breakout-following selling. Note the gap at Monday open due to the weekend.
4H Analysis
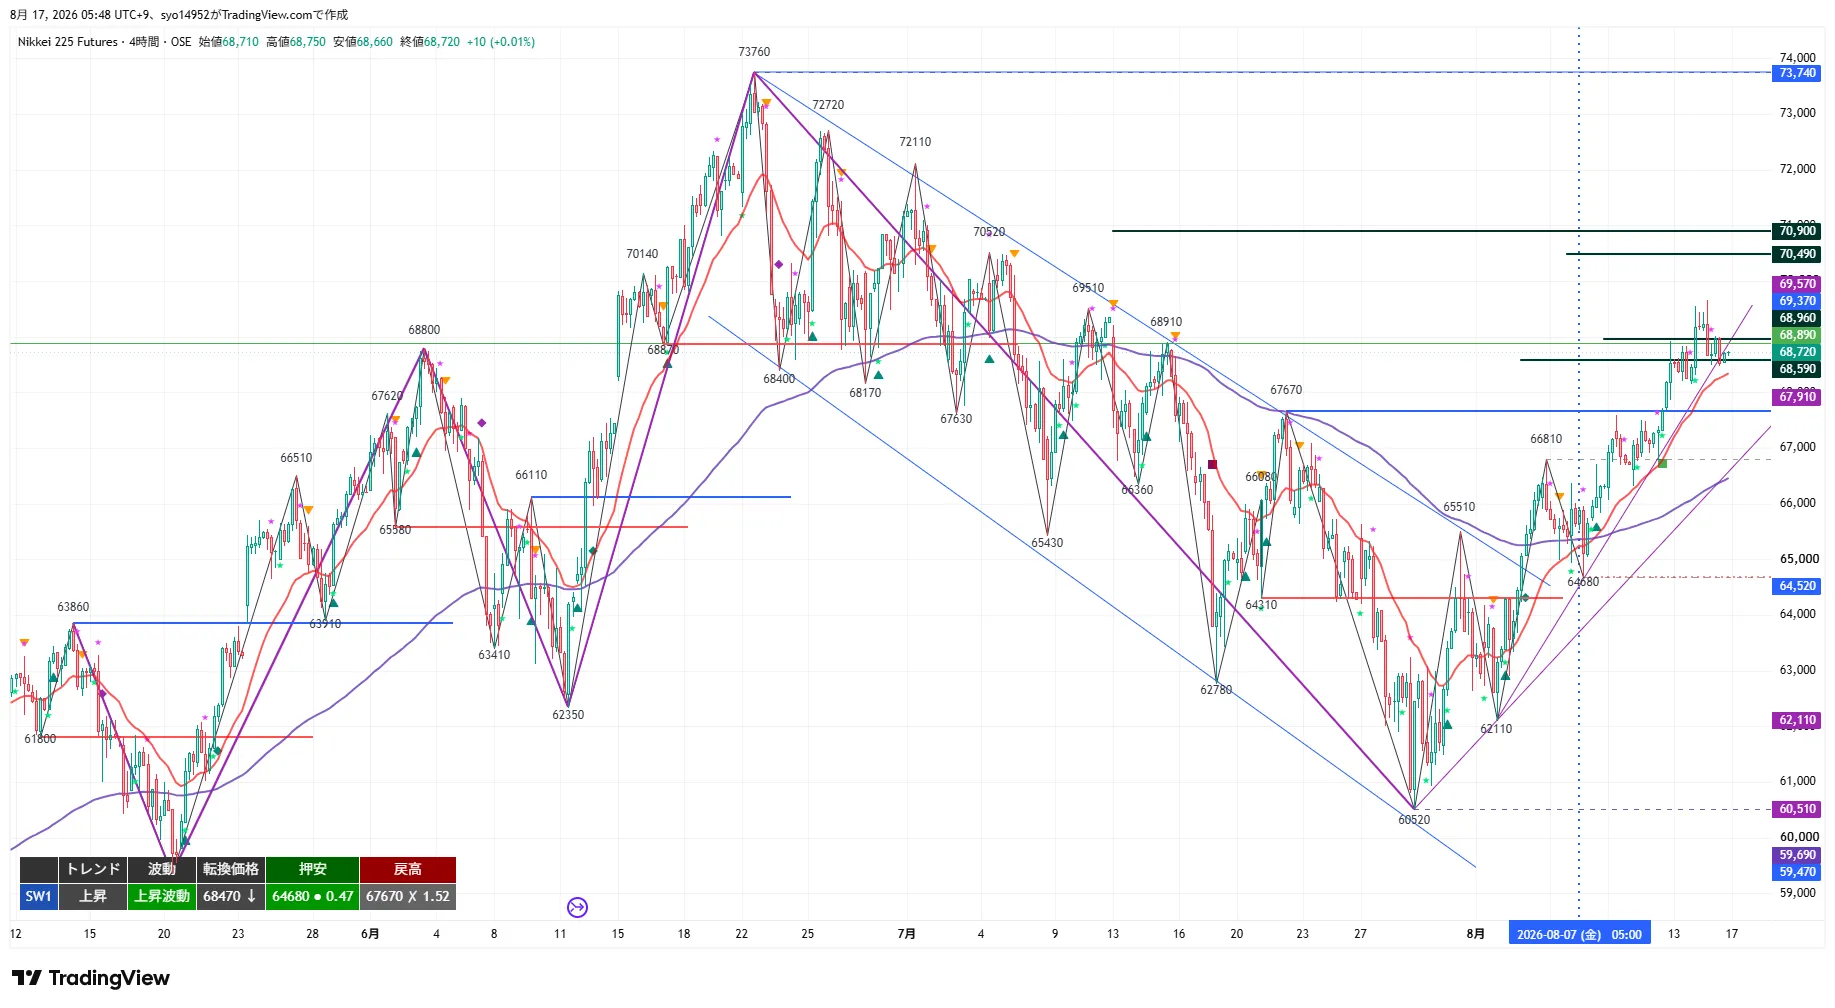
The 4H remains in an uptrend and rising move. From a base around 60,520, price has closed above 67,670 (the previous pullback high), which now acts as a lower support. The 20 EMA/20 SMA are positively sloped and price sits above them; the gap to the 120 EMA (daily 20 EMA equivalent around 67,300) and 200 EMA is large, so the uptrend structure remains intact.
However, the reversal price has risen to 68,470, and closing below this would undermine the 4H rising move. Upside targets include 69,650 (recent high), and then 70,490 and 70,900; downside supports include 68,470, 68,140, and the breakout level at 67,670. The 20 EMA deviation from the price in the high-price zone remains large, so be cautious with chasing higher prices.
1H Analysis
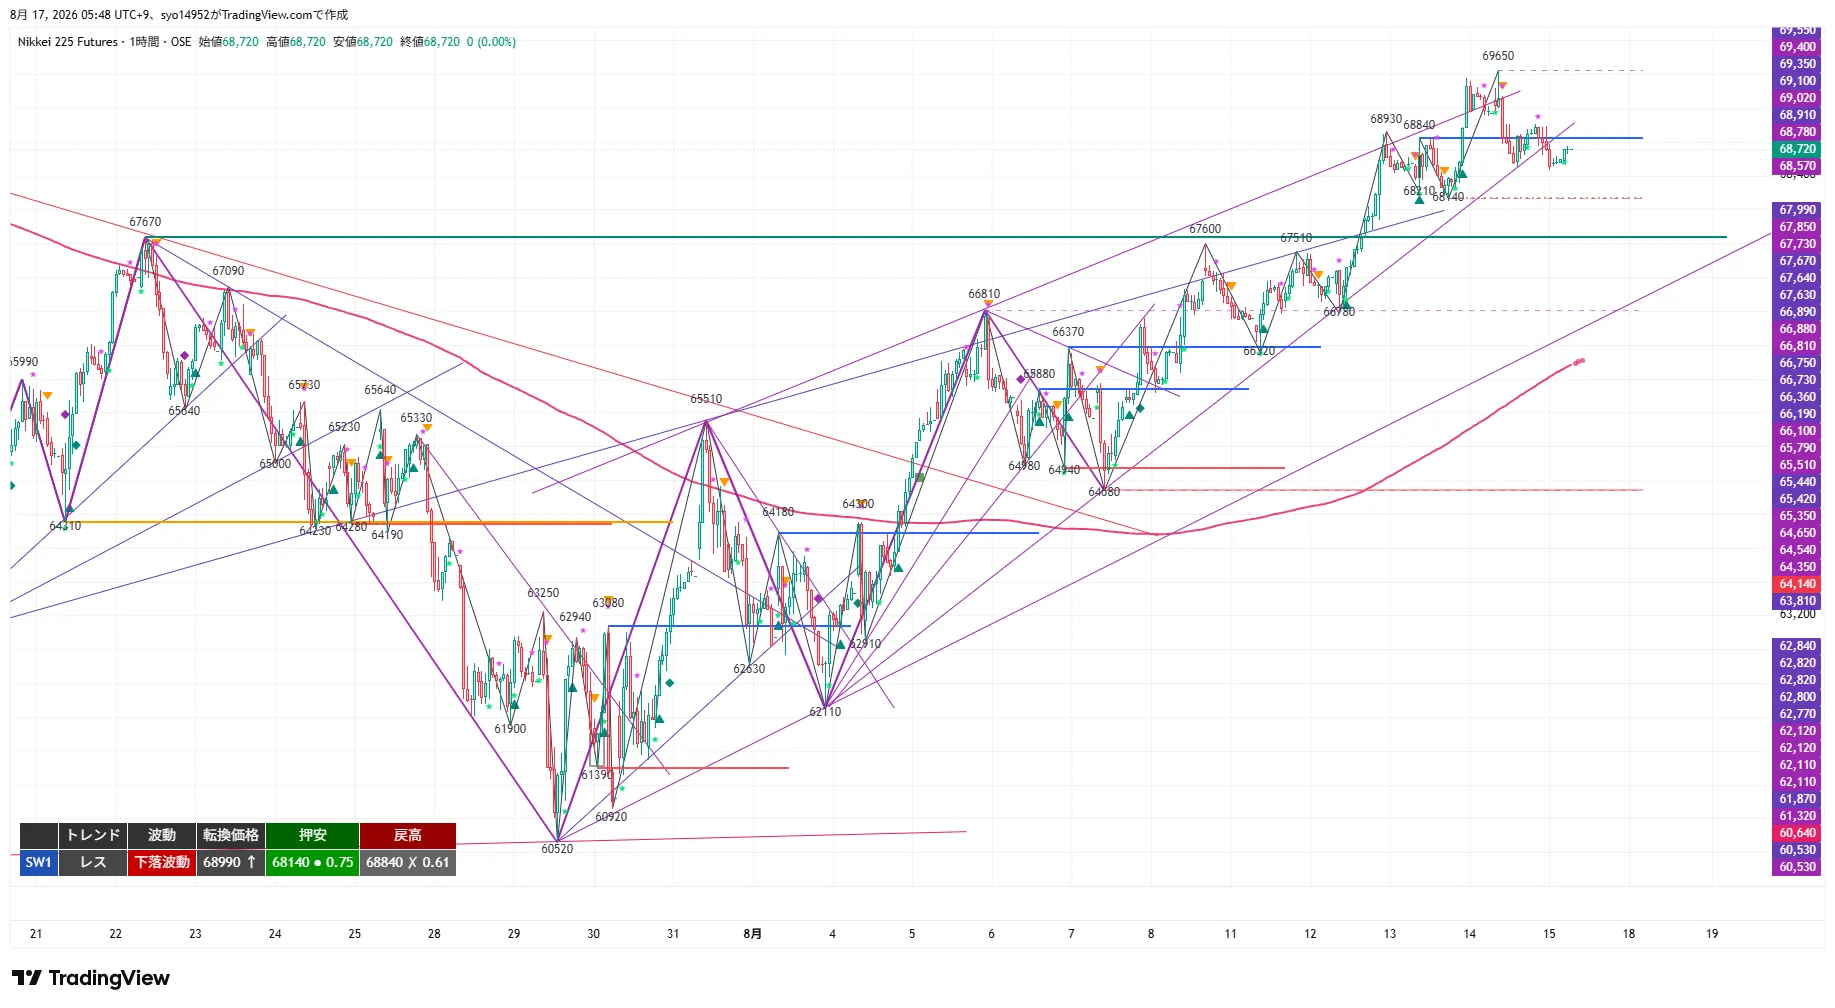
The 1H is in a range and downward move. After breaking 68,140 to the upside and reaching 69,650, the upside momentum faded, leading to a range with support at 68,140 and resistance at 68,990. The 20 EMA is flattening, indicating loss of upward momentum.
If the price recovers above 68,990 on a 1H close, the down move would turn upward and aim for another test of 69,650. Conversely, a close below 68,470 would also break the 4H reversal price and shift the balance downward, with 68,140 acting as the lower bound of the range. The 80 EMA (4H 20 EMA equivalent around 68,400) is positively sloped, so 68,470–68,400 may act as support.
15m Analysis
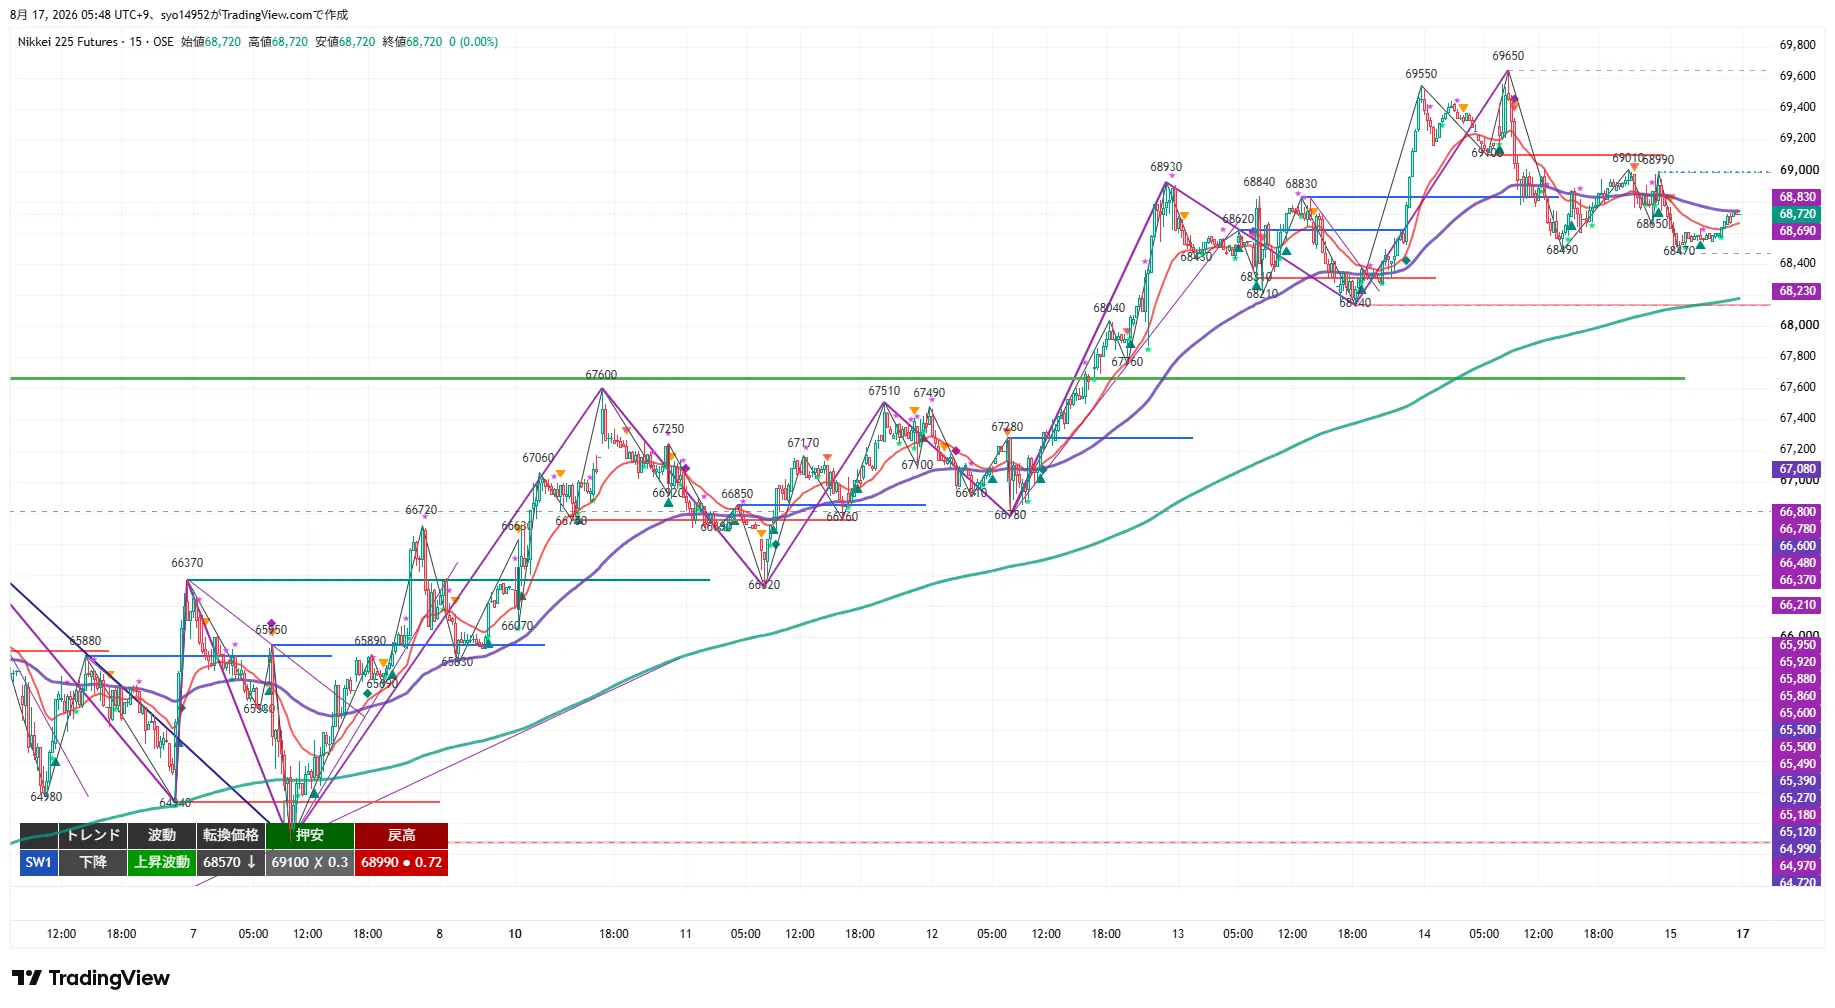
The 15m is in a downtrend with an up move. After peaking at 69,650, it fell to test 69,100 support and closed at 68,720 after a drop to 68,490 and a rebound to 68,990, then another drop to 68,470 before ending at 68,720. In the recent structure, both higher highs and lower lows have been descending.
The 320 EMA (4H 20 EMA equivalent around 68,230) is positively sloped and price sits above it, providing support. The 80 EMA (1H 20 EMA equivalent around 68,830) is negatively sloped and caps the upside. Therefore, the trading range effectively is between 68,230 and 68,830, and the direction will not be decided until a close above 68,990 or a close below 68,470 occurs.
MTF State
- 4H: Up / Rising move. Reversal at 68,470, support at 64,680, and pullback high at 67,670 (X). After closing above 67,670, price reached 69,650 and closed at 68,720 with a +0.01% gain. 20EMA/20SMA are positive.
- 1H: Range / Down move. Reversal at 68,990, support at 68,140, and pullback high at 68,840 (X). 20EMA flat, 80EMA and 480EMA positive.
- 15m: Down / Up move. Reversal at 68,570, support at 69,100 (X) and pullback high at 68,990. 20EMA flat, 80EMA negative, 320EMA positive.
- Consistency: 4H up, 1H and 15m in pullback, indicating a higher-timeframe-led consolidation. Basic strategy is to buy the dip, and to sell rallies only until 68,470 is breached.
Important Prices
- 70,900 yen: 4H higher-level pivot. Next upside target.
- 70,490 yen: 4H higher pivot. First target of T2.
- 69,650 yen: Most recent high (8/14 intraday). First target of T1.
- 69,550 yen: 8/14 night high. Upside breakout point.
- 69,100 yen: 15m support (closed below). Recovery would negate the downward structure.
- 69,010 yen: 8/14 night high. Upper boundary of Return Sell Zone 1.
- 68,990 yen: 15m pullback high / 1H reversal price. Short-term critical bifurcation.
- 68,830 yen: 15m 80EMA (1H 20EMA equivalent) band / 8/13 pullback high. Lower boundary of Return Sell Zone 1.
- 68,720 yen: current price / night close.
- 68,570 yen: 15m reversal price. Short-term down-turning line.
- 68,470 yen: 8/14 night low / 4H reversal price. Lifeline for dip buying.
- 68,230 yen: 15m 320EMA (4H 20EMA equivalent) band. Upper bound of deep pullback zone.
- 68,140 yen: 1H pullback low. Breach releases 1H range lower bound.
- 67,910 yen: Upward turning point in rally. ④ of T2.
- 67,670 yen: 4H previous pullback high (closed above) = support turned.
- 64,680 yen: 4H pullback low. Lower bound of the big picture.
Trade Ideas
① Breakout-follow (Long)
- Trigger: Break above 68,990 (15m pullback high / 1H reversal price) on a 15m close.
- Advanced entry price: 68,990. After breakout, look for a pullback near breakout price or around a tilted 20MA on a lower timeframe (back-entry).
- This entry price: 69,110 (1H close recovered).
- Stop loss: 68,560 for the advance; 68,460 for the entry; fully exit at 68,130.
- Targets: 69,650 (partial take + move entry), 70,490.
- RR: T1 (69,650) = 1.5 / T2 (70,490) = 3.5.
- MFE protection: exit at breakeven or small profit with +200 yen, secure at least +100 yen with +300 yen, or use trailing. Breakouts from the range upper boundary tend to pullback, so protect early.
◎ ② Buy the dip (Long)
- Standard conditions: Zone 1 68,470–68,570 (8/14 night low = 4H reversal price ~ 15m reversal price), Zone 2 68,140–68,230 (1H pullback low ~ 15m 320 EMA band). Look for reversal shape inside the zone on the 15m close.
- Advanced entry price: 68,540 (if entering from a deep dip zone, place stop at 68,040).
- This entry price: 68,990 (1H close recovered).
- Stop loss: 68,360 for the advanced, 68,130 for the main; full exit at 67,900.
- Targets: 68,990 (partial take + move base), 69,650–70,490.
- RR: T1 (68,990) = 2.5 / T2 (69,650) = 6.2.
- MFE protection: exit at breakeven or small profit with +200, secure at least +100 with +300, or trailing. Since this is a dip-buy within a range, take partial profits near the upper bound.
③ Return Sell (Short)
- Standard conditions: Zone 1 68,830–68,990 (15m 80EMA band ~ 15m pullback high), Zone 2 69,100–69,350 (broken 15m pullback low ~ rising pivot). Confirm stall pattern within zone via 15m close.
- Advanced entry price: 68,900 (if entering from Zone 2, place stop at 69,400).
- This entry price: 68,460 (1H close below).
- Stop loss: 69,120 for the advanced, 68,990 for the main; fully exit at 69,660.
- Targets: 68,470 (partial take + move base), 68,140–67,910.
- RR: T1 (68,470) = 2.0 / T2 (68,140) = 3.5.
- MFE protection: exit at breakeven or small profit with +200, secure at least +100 with +300, and avoid chasing deeply as 4H is in an up move against the trend.
④ Breakout-follow (Short)
- Trigger: Break below 68,470 (8/14 night low / 4H reversal price) on a 15m close.
- Advanced entry price: 68,470. After breakdown, look for a pullback near breakout price or around a tilted 20MA on a shorter timeframe (back-entry).
- This entry price: 68,130 (1H close below).
- Stop loss: 68,740 for the advanced, 68,580 for the main; fully exit at 68,990.
- Targets: 68,150 (partial take + move base), 67,910 / 67,670.
- RR: T1 (68,150) = 1.2 / T2 (67,910) = 2.1.
- MFE protection: exit at breakeven or small profit with +200, secure at least +100 with +300, and beware of traps and sharp reversals when selling near the 4H rising move; avoid chasing deeply.
Current Action
- Most important line 1: 68,990 — 15m pullback high / 1H reversal price. If closed above on the 15m close, this becomes scenario ①; if recovered on the 1H close, it becomes scenario ②. If this cannot be exceeded, upside remains heavy.
- Most important line 2: 68,470 — 8/14 night low / 4H reversal price. If a bounce pattern is confirmed, scenario ②; if closed below on the 15m close, switch to scenario ④.
Entry price, trigger, and stop are set based on the chart shape at the close time (reversal prices and pullback lows/highs of each timeframe). If the structure changes over time, unless there is a higher-timeframe structural change, adjust entry prices based on lower-timeframe wave reversal prices (e.g., a short-term chart shifting from a down move to an up move) to better reflect the actual structure and use the more accurate values.
※ Note the Monday open gap due to weekend. If the opening price exceeds the conditions significantly, breakout-following is treated as partially formed and gap-through; dip-buy is not considered valid unless the zone is reached.
※ This report is for information purposes and not investment advice. Please make your own investment decisions at your own risk.