
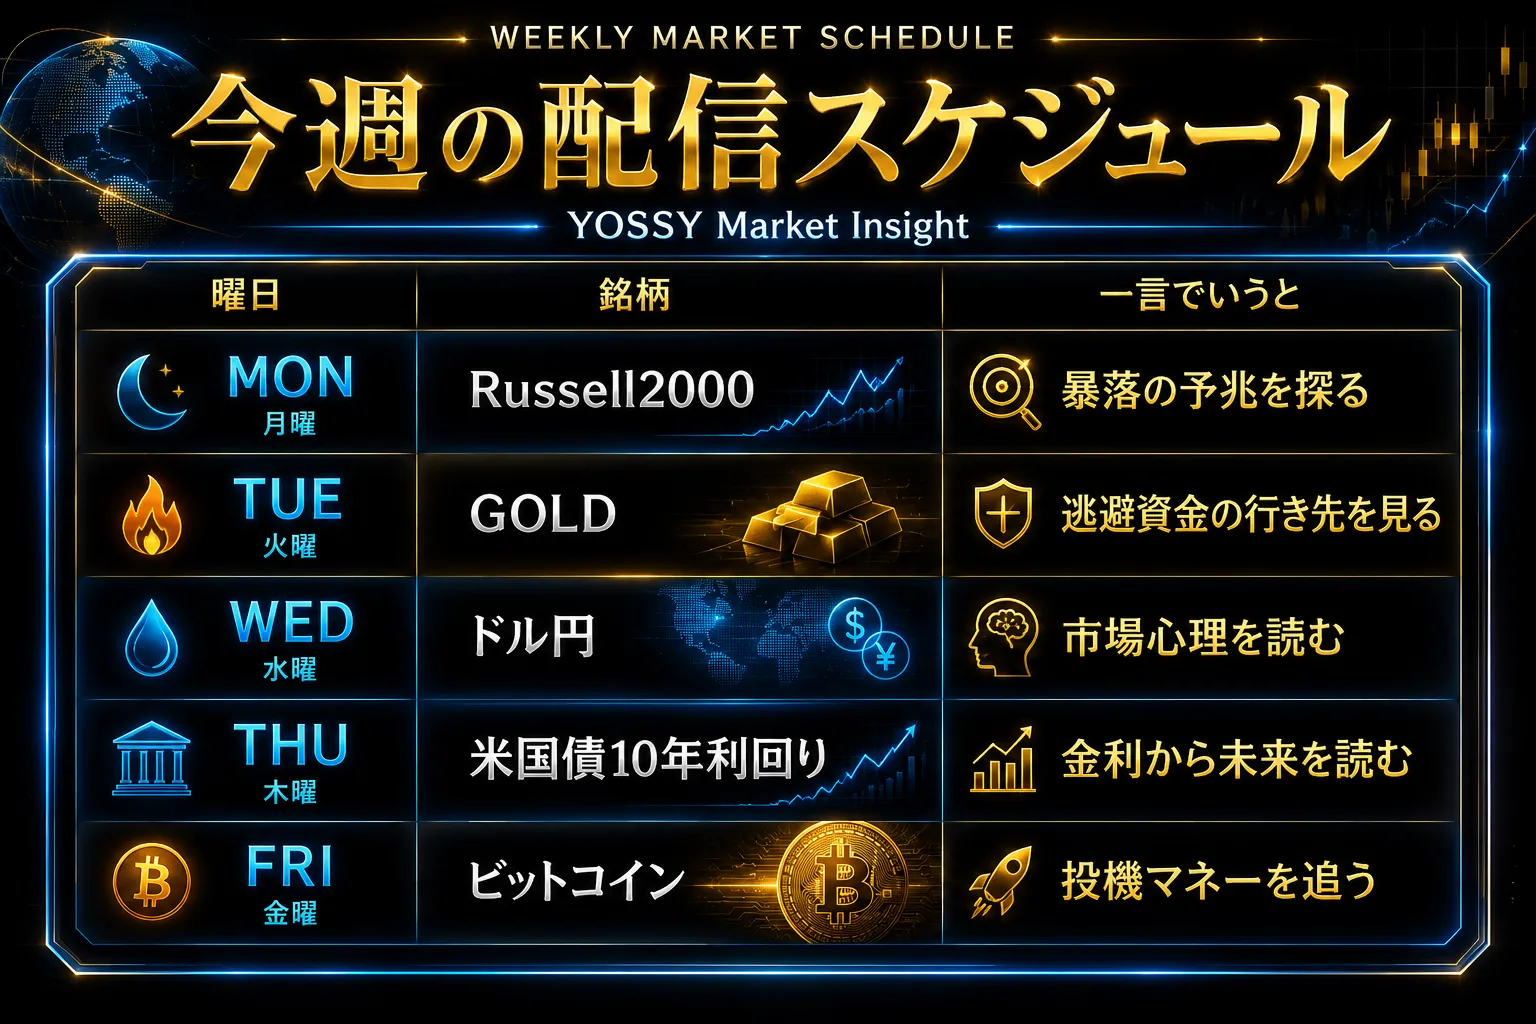
August 17 (Mon): 【BB&HM】 Nikkei 225 vs. Russell 2000
This time
in a downtrend, often called the “canary in the coal mine,”
“Russell2000”
we will compare it.
【Overall Scenario Probability】
This week's overall market is…
“Rise: 65% / Fall: 35%”
*Although the Russell2000 bullish candle and band expansion and the Nikkei 225 daily chart opening tend to push +2σ, there remains caution due to a downward divergence and a harmonic decline scenario for Bitcoin.
*Presented as a reference level.
【This Week's Market Focus Points】
This week's market shows the Russell2000, known as the “canary in the coal mine,” continuing to have bullish candles and band expansion, with the four major US indices overall in a rising environment.
The Nikkei 225's daily band is also opening, and there is a possibility that the +2σ will expand without turning into a resistance band.
On the other hand, a downward divergence for the Russell2000 is also visible, so caution is needed for a potential reversal when a drop occurs.
It is an important phase to carefully confirm the warning points while the signals for ongoing gains are already in place.
Details will be explained in the paid section.
➥The continuation is explained in detail in the members-only report.
If you are not yet registered, please click here ↓
【Unified Version】
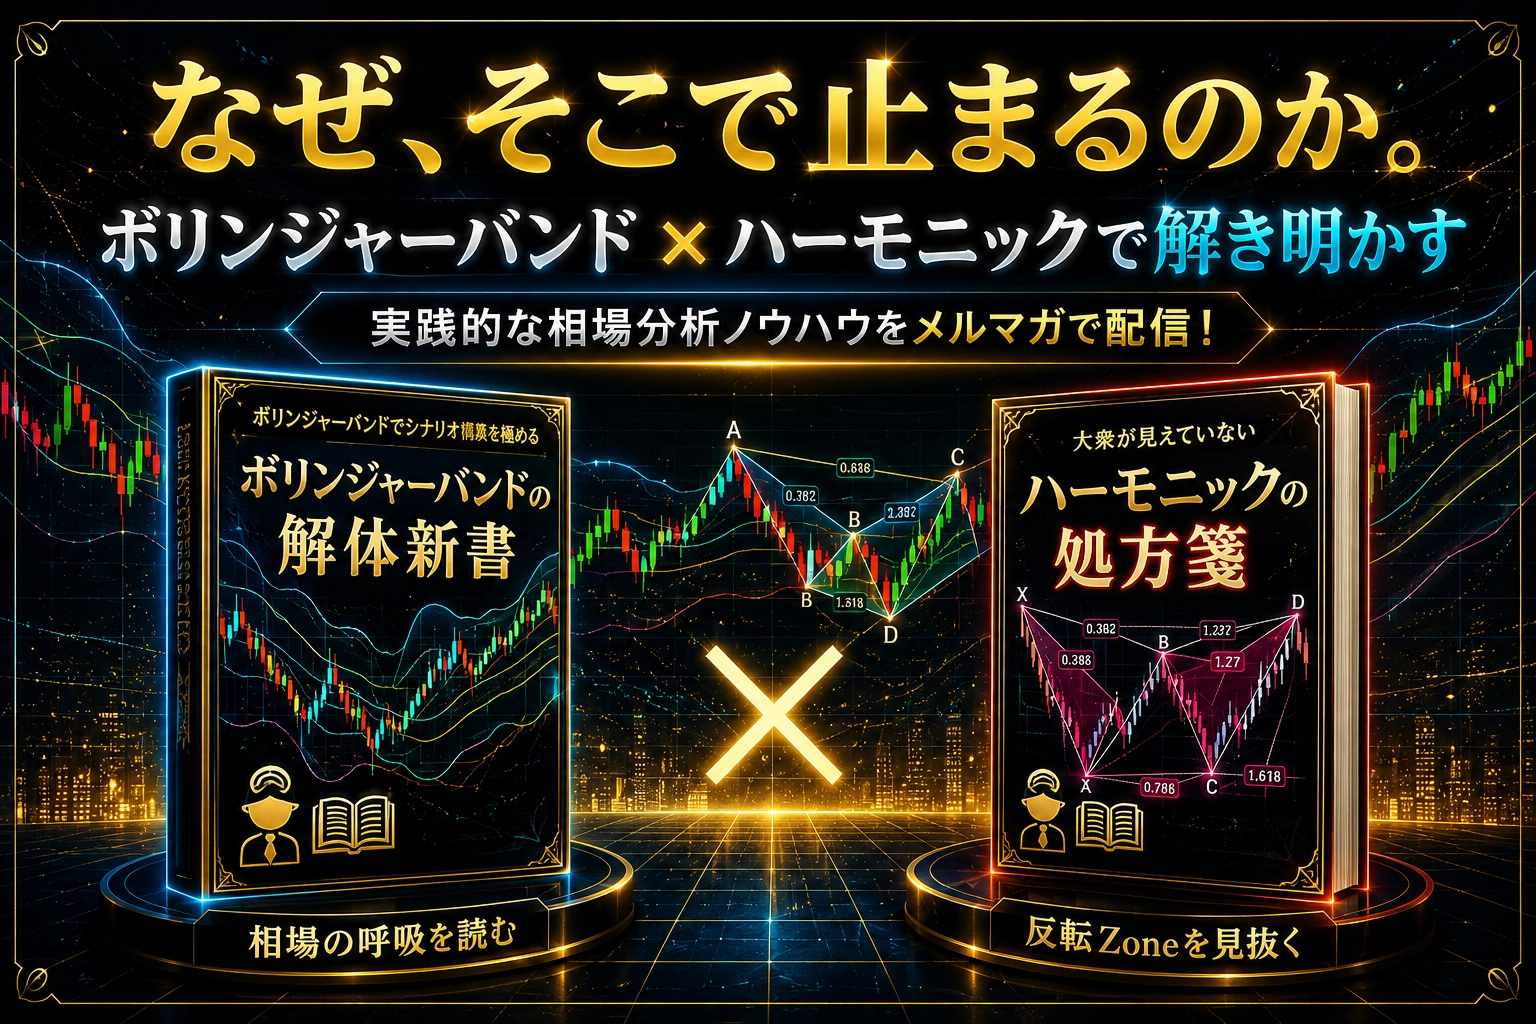
“Why does the market stop there? Boiling Bollinger Bands × Harmonics: a fusion of statistics and geometry to capture turning points with high precision!”
https://www.gogojungle.co.jp/finance/navi/series/1613?via=articles_detail_aside
(※The following is for members only.)
-----------------------------------------------
【Environmental Perception】