

Let’s learn the basic way to read candlesticks! ~How to read charts Part 1~ Technical Analysis Basics Course #3
Hello! This is SAKU!
Previous article discussed the price movement mechanism from the demand-supply perspective,
this time we'll move on to discuss the basic way to read charts across two installments!
Since this is the first step of technical analysis, let's study it properly!
This time we'll start with the basics—the way to read candlesticks!
What is a chart?
In technical analysis,a chart visualizing the price movement of a currency pairis used for analysis.
A chart is like a map without destinations, like a sea chart. In the first place, a chart is a sea chart.
The main price-movement representations are candlesticks, bar charts, line charts, etc., but on this blogcandlestickswill be used as the main depiction.
To analyze by looking at charts, you need not only a basic understanding of candlesticks but also the ability to perceive the price movements depicted by candlesticks on the chart as waves.
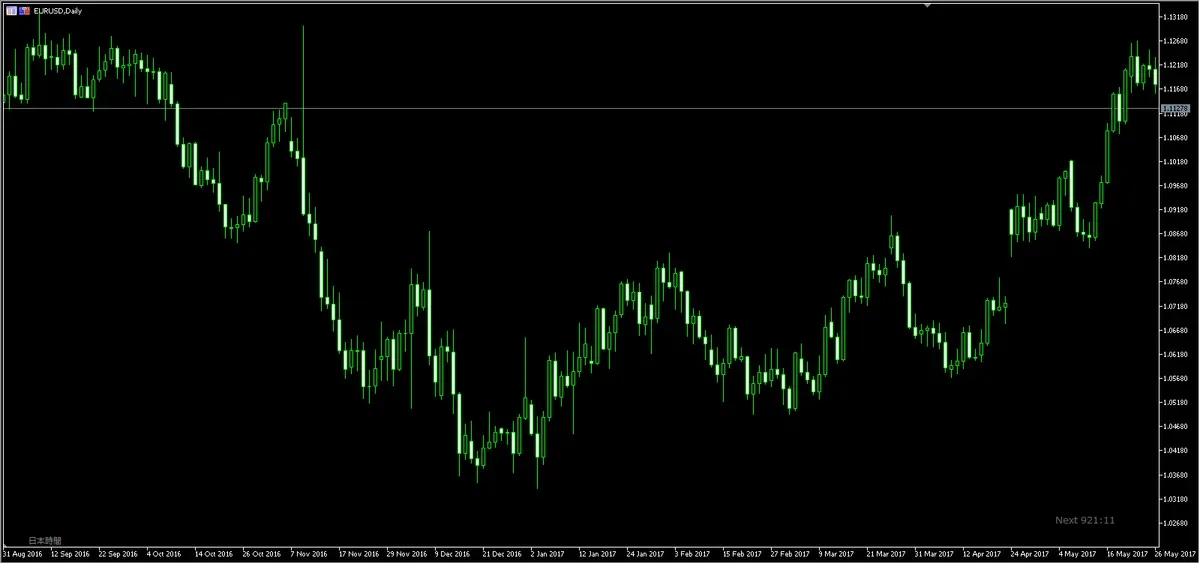
The actual chart screen looks like this. ↓ (MT5 chart software is used)
How to read candlesticks
Candlesticks, whether a single one or several in a group, convey various information.
Candlesticks originated in Japan, and their history traces back to the Edo period.
It is said that the thing that recorded price movements to predict the U.S. market was conceived in the Meiji era as the current candlestick shape.
By the way, in the West, bar charts are mainstream (recently more people are using candlesticks as well, and they are called Candle Stick. It’s just a direct translation of candlestick).
・Four prices
The four together are called four prices: open, low, high, close.
Open・・・the price at which price movement started during that period.
Low・・・the lowest price reached during that period.
High・・・the highest price reached during that period.
Close・・・the price at which price movement ended during that period.
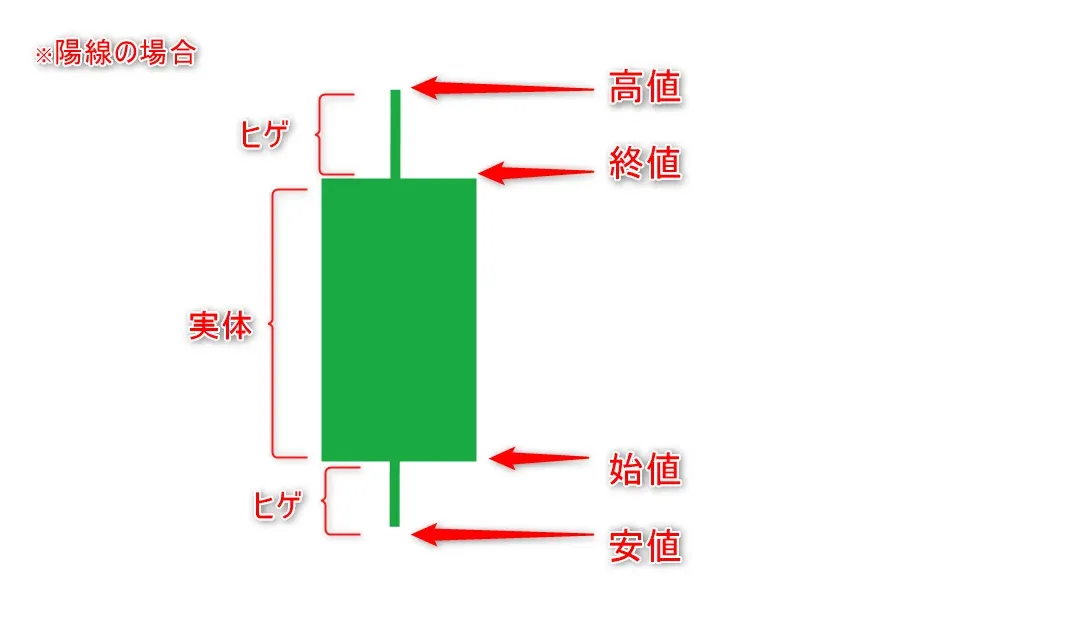
Also, the protruding parts above and below the candlestick are called the wick, and the body part is called the real body.
・Bullish and bearish candles
Candlesticks are broadly classified into bullish and bearish candles.
・Bullish・・・a candlestick whose close is higher than the open
・Bearish・・・a candlestick whose close is lower than the open
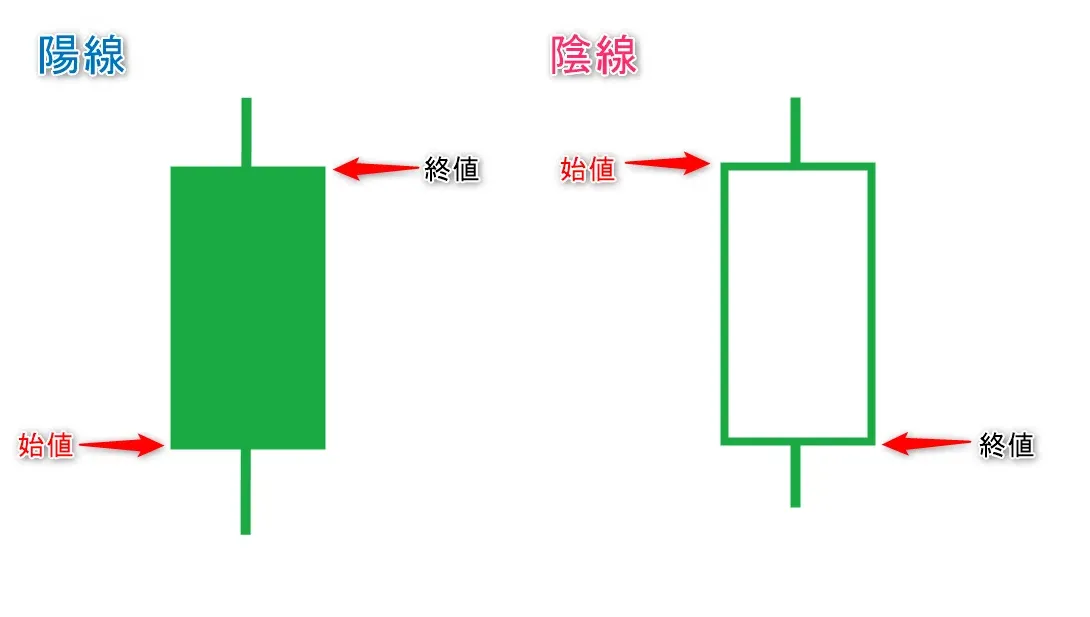
In most charts, there are candlesticks from 1-minute to monthly, visualizing price movement within each period.
In bullish candles, the close ends at a position higher than the open
→ buying pressure is strong
In bearish candles, the close ends at a position lower than the open
→ selling pressure is strong
This is the basic interpretation.
・Candlestick internal price movement
Candlesticks, even a single one, provide various information, and within that single candle, the price movement within that period is contained.
Open, then the low and high are formed, and finally the close is formed.
The candlestick is a visualization of various price movements that occur during that period as one unit (the below diagram shows an example of price movement inside a candlestick).
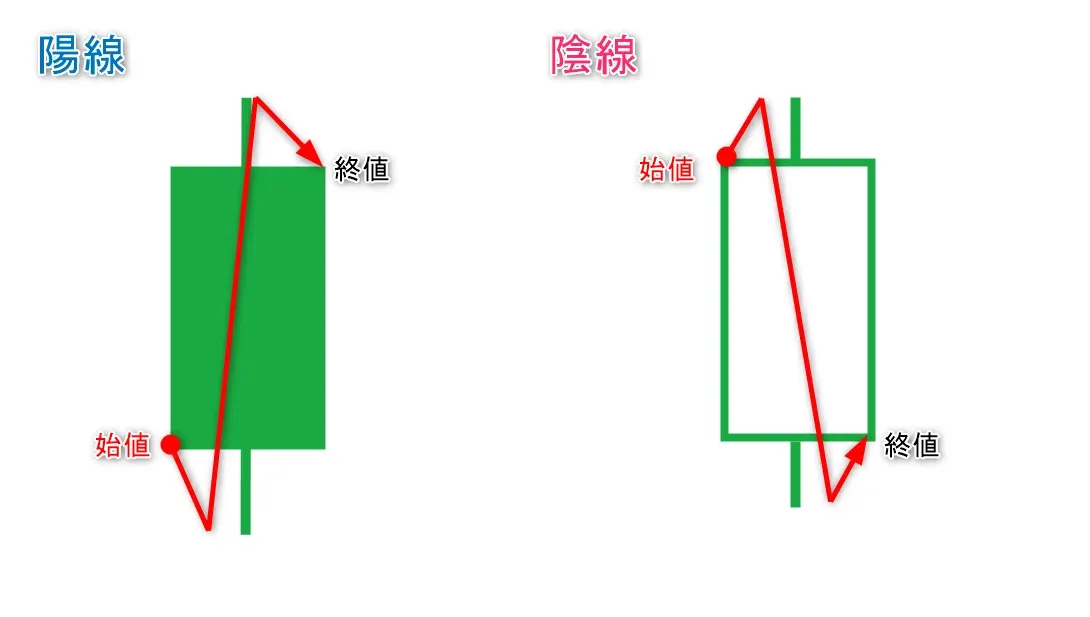
This imagining the price movement inside a candlestick is extremely important for advancing technical analysis, so start building this habit early!
By the way, popular charting software includes MT4 (Meta Trader 4), MT5, TradingView, and platforms provided by various brokers.
Which one is better depends on the person, so use the one that suits you!
Next time we will discuss “the waves of price movement”.
Details of the author's trading method are here ↓
MTF Multi-Time Frame Analysis Essentials(Discount campaign until August 31, 2026, 23:59))
Next article is here↓