
[For Beginners] What are ICT methods? A gentle explanation of how to read charts using Liquidity and FVG
Have you ever seen words like “Liquidity,” “FVG,” and “Order Block” in videos or on social media from overseas traders?
These are concepts commonly used in a trading approach called ICT.
ICT is not a method that follows buy/sell signals from indicators. It reads “where a lot of orders are likely to accumulate” and “where the price movement’s flow may have changed” from high/low positions and the momentum of candlesticks.
However, learning ICT does not guarantee you’ll win every time. This article clearly explains the basic ideas of ICT and the steps beginners should take when viewing charts.
What is ICT?
ICT stands for “Inner Circle Trader.”
It refers to an analysis method centered on price action, publicly shared by Michael J. Huddleston, a US trading educator.ICT Official SiteThere, curricula for understanding price movements in markets such as the forex market are published.
In ICT, price is not simply moving up and down; the idea is that it moves toward price levels where orders are likely to cluster.
One important note is that ICT is not an official theory or standard in finance. It is not a method that directly confirms orders of financial institutions. It is one of several analytical approaches that infer where orders may exist from highs and lows on the chart.
Five basic terms to understand ICT
1. Market Structure
Market structure refers to how the market’s highs and lows are arranged.
Higher highs and higher lows: uptrend
Higher highs and lower lows: downtrend
Moving within a defined range: ranging market
In ICT as well, you first confirm the market direction on a higher timeframe.
For example, if the 1-hour timeframe is in an uptrend, you can prioritize seeking long setups on the 5-minute chart.
2. Liquidity
In ICT, liquidity refers to areas where it’s inferred that many orders have accumulated.
A representative example is past highs and lows.
| Location | ICT term | Orders considered likely to cluster |
|---|---|---|
| Above past highs | Buy-side Liquidity | Stop losses of sell positions, buy orders aiming for a breakout |
| Below past lows | Sell-side Liquidity | Stop losses of buy positions, sell orders aiming for a breakout |
Equal Highs (highs at the same level) or Equal Lows (lows at the same level) are also considered liquidity hotspots.
3. Liquidity Sweep
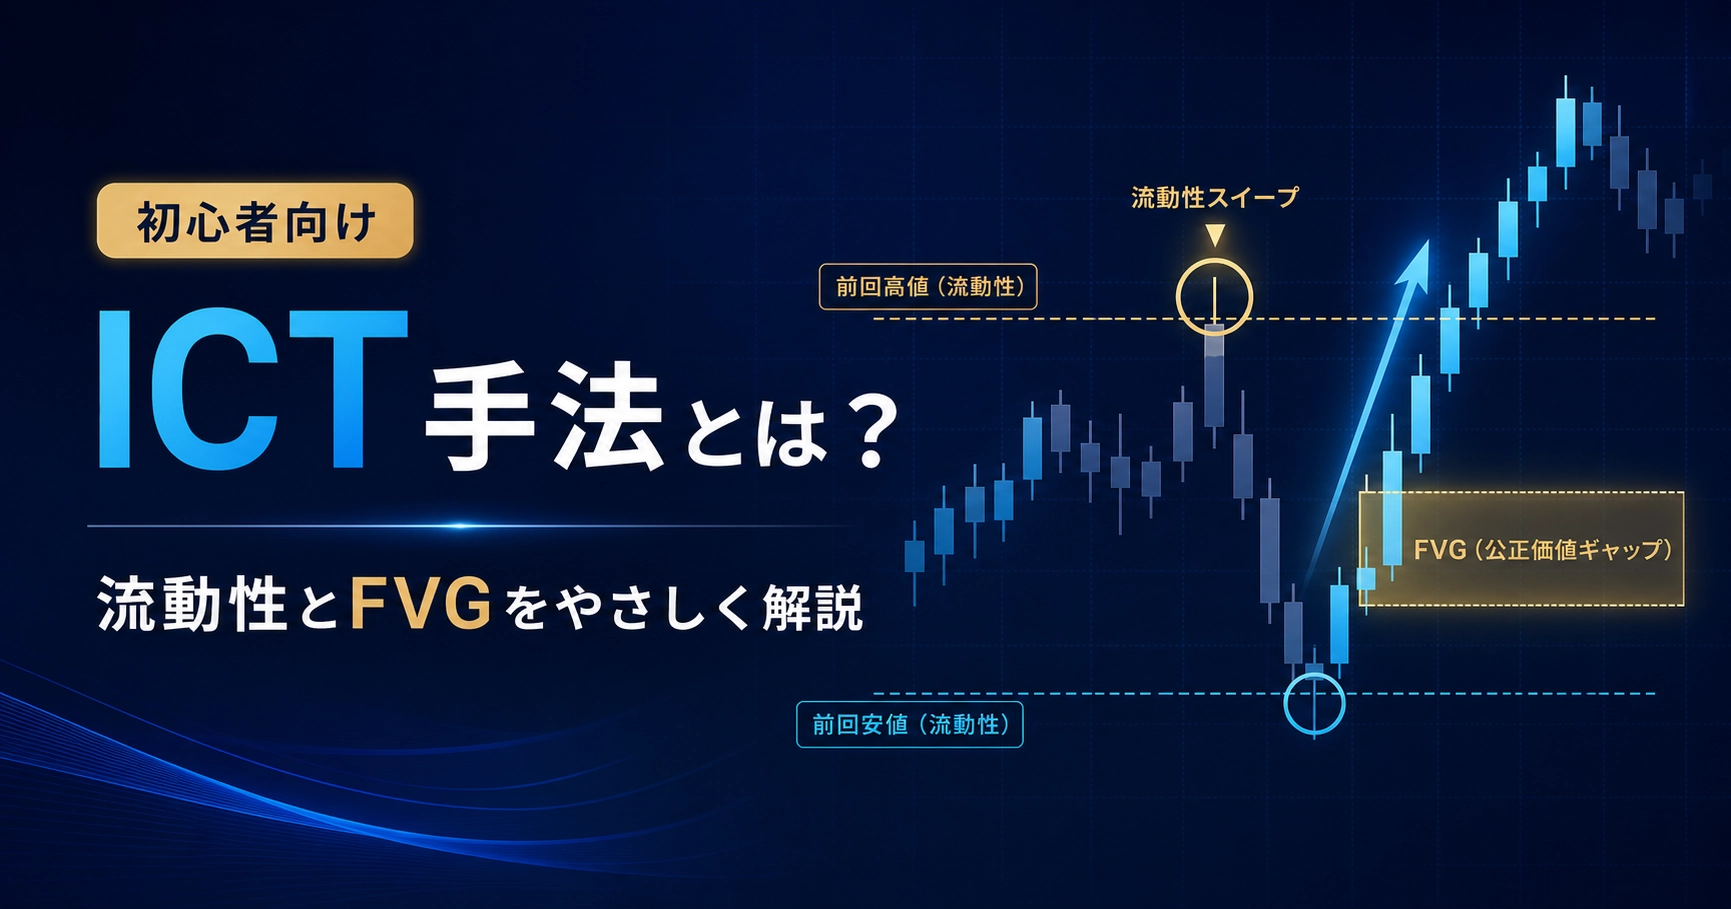
A move where price momentarily breaks past past highs or lows and then quickly returns to the original range is called a “liquidity sweep.”
For example, price slightly dips below a past low and then rises sharply.
In ICT, this is interpreted as possibly having dragged in orders below the low.
However, simply breaking a high or low does not guarantee a reversal. The price may continue in the same direction, so do not base trades on a sweep alone.
4. Displacement and MSS
Displacement is a price move where candlesticks extend strongly in one direction.
When this strong move breaks recent highs or lows and changes the short-term flow, it is called MSS (Market Structure Shift).
When considering buying, check the following order:
Dip below the recent lows once
Price quickly returns
A strong bullish candle forms
It breaks above the recent short-term high
The key is not only that price broke a low, but that upward momentum is confirmed afterward.
5. FVG (Fair Value Gap)
FVG is a price zone created by sharp price moves where candlestick overlaps are minimal.
Typically confirmed using three consecutive candles.
In an up move, there remains a zone between the high of the first candle and the low of the third candle that does not overlap. In a down move, a zone remains between the low of the first candle and the high of the third candle.
In ICT, this price zone is viewed as a place that may not have been fully traded due to the abrupt move, and traders watch how price reacts when it returns to it.
FVG is better used in combination with liquidity sweeps and MSS. You can also check ICT’s official FVG explanation videoOfficial FVG Explanation Videofor more details.
A beginner-friendly way to view things
ICT has many terms, but beginners do not need to memorize them all at once.
First, focusing on the following flow makes it easier to understand.
When considering a long position
Confirm uptrend on a higher timeframe
Look for past highs or highs that match
Wait for price to dip below that low once
Confirm strong move and MSS
Observe pullback to the FVG formed during the up move
If price falls back below the low again, regard the long setup as invalid
Use opposing liquidity, such as past highs, as target candidates
If considering selling, follow the opposite steps.
The important point is not to anticipate based on predictions alone. Wait until you can confirm the sweep, strong move, and structural changes in order.
Try it on a virtual chart
The following numbers are fictional and used to explain the concept.
Suppose a currency pair has a past low of 1.0800.
Price dips to 1.0797 once, then immediately recovers to 1.0800. Thereafter, a strong bullish candle breaks the local high 1.0810, creating an upward FVG between 1.0804 and 1.0807.
In ICT, this can be organized as follows.
Sell-side Liquidity below 1.0800
Downward sweep to 1.0797
Breakthrough at 1.0810: MSS candidate
1.0804–1.0807: FVG to observe as a pullback
Below 1.0797: place where the premise of buying collapses
Past highs: potential targets if price rises
Sometimes price rises without returning to the FVG, or completely breaks below the FVG. Therefore, assuming that “FVG guarantees a rebound” is risky.
Advantages of ICT methods
ICT has the following characteristics:
Can be analyzed primarily with candlesticks
Easier to narrow down where to consider entries
Easier to determine price levels that invalidate assumptions
Pre-organize stop-loss and target levels ahead of time
Easier to formalize waiting conditions
In particular, being able to decide not only where to buy, but also how far price must retreat before your view is invalidated, helps with risk management.
Cautions about ICT
On the other hand, ICT has difficult aspects.
Subjectivity in lines and ranges
Which highs and lows you deem important can change the analysis results. FVG and Order Block can be found easily in hindsight, but real-time judgments can be challenging.
Tendency to add too many terms
ICT includes many terms like Order Block, Breaker Block, Mitigation Block, OTE, etc.
If beginners try to memorize all at once, it may hinder judgment. At first, it’s recommended to limit to about four items: highs/lows, liquidity, MSS, and FVG.
Not every FVG is filled
Prices can return to FVGs, but not always. Even when they return, they may pass through that price zone without rebounding.
Price moves can be volatile around economic data releases
During releases such as policy rates, employment data, and inflation indicators, spreads can widen and price gaps can occur. Even if the chart conditions look right, you may not be able to trade at the expected price.
Recommended practice methods for beginners
Rather than trading with real funds immediately after learning ICT, verify with past charts or a demo account.
Items to record include the following.
Instruments and timeframes
Direction of the higher timeframe
Swept highs or lows
Presence of MSS
Position of FVG
Assumed stop-loss and target levels
Trading costs including spreads
Whether decisions followed the rules
Beyond win rate, also check average win, average loss, maximum consecutive losses, and trading costs such as spreads.
If you change conditions repeatedly during testing, you won’t know what was effective. It’s important to start with one market, one timeframe, and one trading pattern.
Make capital management your top priority
No matter the method, you cannot completely avoid losses.
Before trading, decide a maximum loss you are willing to take per trade, and adjust your position size to stay within that range.
The allowable loss amount can be calculated as follows.
Account balance × your chosen allowable loss rate = single trade allowable loss
For example, if your account is 100,000 yen and you assume an allowable loss rate of 0.5%, a single trade’s allowable loss is 500 yen. This is for illustration and does not endorse a specific loss rate.
In domestic retail FX, there is a maximum leverage regulation of 25x, but using up to 25x is not necessarily safe. The Financial Services Agency also notes that during sharp market moves, losses can exceed the margin requirement.FSA: About so-called foreign exchange margin trading
Also, even if using methods introduced overseas, you do not need to use overseas FX brokers. When trading as a resident of Japan, ensure the broker is properly registered in Japan.FSA warns about unregistered overseas brokersas well.
Summary
ICT is an analytical method that observes liquidity believed to accumulate around past highs and lows, and the subsequent changes in price movement.
For beginners, first memorize the following order:
Confirm the direction on a higher timeframe
Identify past highs and lows
Wait for a liquidity sweep
Confirm strong moves and MSS
Observe a return to FVG
Decide the price at which the premise is invalid and set loss limits in advance
ICT is not a guaranteed method to forecast future prices. It is important to use it as an analytical framework to organize charts and clarify the conditions for considering or declining trades.
※This article provides general information about ICT methods and does not advocate specific financial products or trading. Forex and other margin trading can result in losses of your principal. Actual trading should be done with full understanding of the product mechanics and risks, and at your own judgment and responsibility.