
NK225 futures MTF Dow Theory four-scenario analysis report 2026-08-14
NK225 Futures MTF Dow Theory Analysis Report
Date and Time: August 14, 2026 06:02 JST / Night Session
Current Price: 69,140 JPY
Target: For the intraday session (Fri, 8/14)
Conclusion
The level 68,930 that was the focus yesterday could not be surpassed during the 8/13 intraday; it declined to 68,840 and 68,830, but bounced from 68,140 as a reference point and surged into the night session on 8/14, closing above 68,840 and reaching 69,550. It closed at 69,140, confirming the continuation of the upward breakout. Throughout Friday, the focus will be whether it can rebound above 69,550.
If the 69,550 level is closed above on a 15-minute basis, it would indicate a pursuit of new highs with a long entry; if there is a pullback to 69,100–69,350 and it rebounds, consider buying the dip. For selling, aim to enter around 69,550–69,570 when it cannot sustain above 69,550 and slows down. If 69,100 (turning point) is broken, the recent uptrend would collapse, and if 68,960 (1H turning price) is broken, the 1H uptrend ends; breaking 68,140 would also break the 4H uptrend. After consecutive surges, the distance from the 20 EMA has widened, so protective stops should be raised promptly.
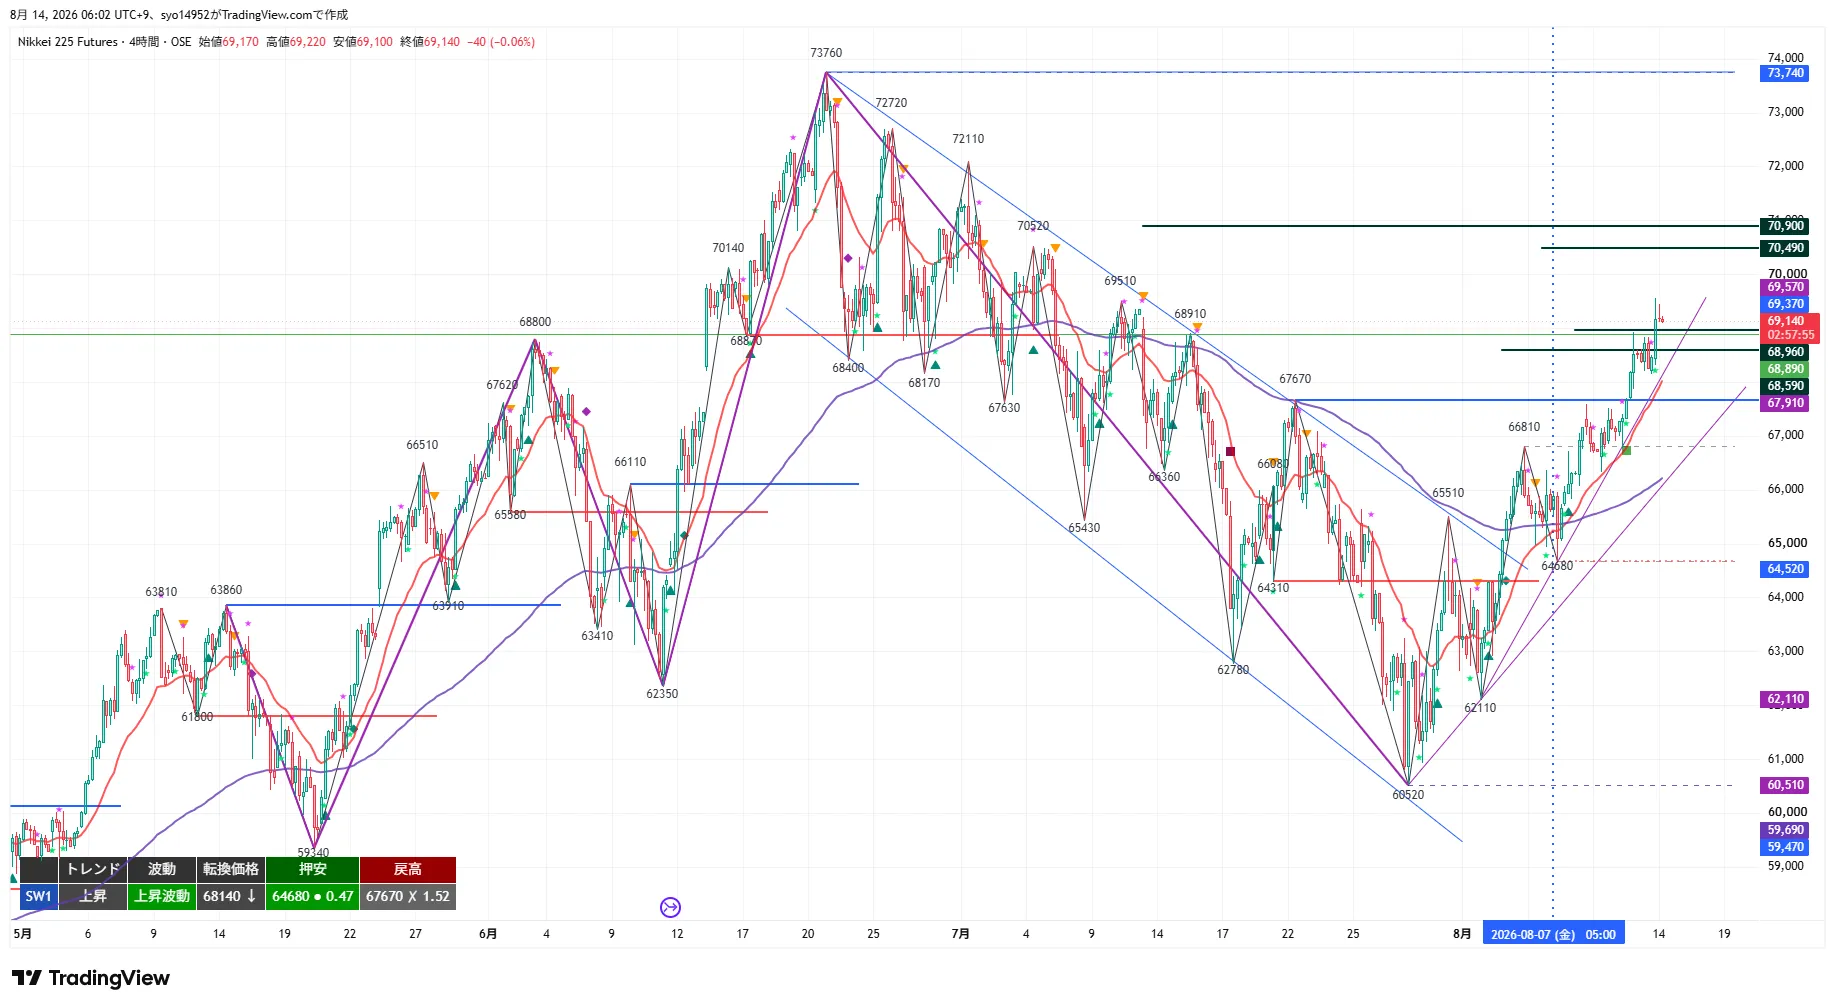
4H Analysis
The 4H chart shows an ongoing uptrend and rising wave. After breaking above the recovery high of 67,670, price continued higher, reaching 69,550 and closing at 69,140. The turning price is 68,140; if the close is below this, the uptrend would be broken. The 20EMA (around 67,900) is rising and price sits above it, but the gap is wide. The 120EMA (daily 20EMA equivalent) is significantly lower; while its alignment is bullish, the move is considered a sharp rise in the high-price zone.
Key resistance levels to note are: 70,490 and 70,900 (upper zone landmarks), 70,520 (July high), beyond which lie 72,110 and 73,760. Support levels: 69,100 (recent turning point), 68,830 (support-turned), 68,140 (turning price), 67,670 (old recovery high = support-turned). As long as 68,140 is not broken, the 4H uptrend structure remains intact.
1H Analysis
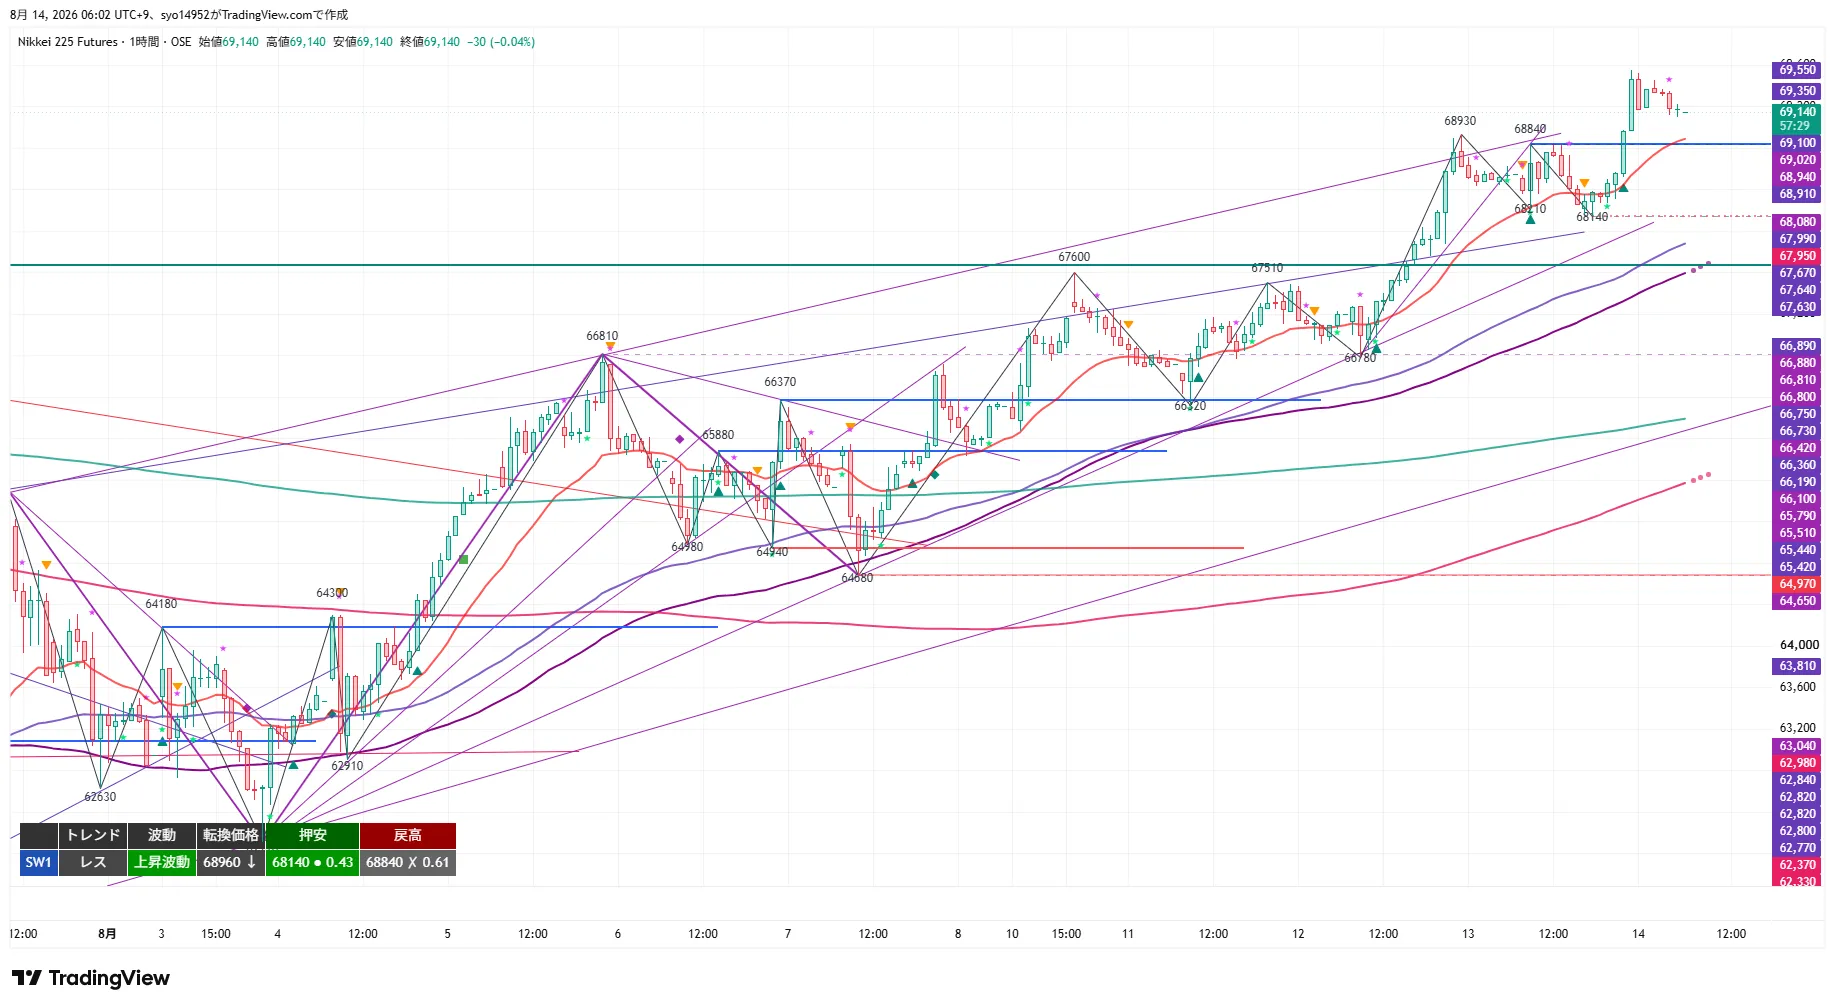
The 1H frame, which is key for structural judgment, shows an uptrend with rising waves within a range. The highs were 68,930, with lower highs at 68,840 and 68,830, but after selling down to 68,140 intraday on 8/13 into the night, it surged and closed above 68,840 to reach 69,550. Since the next upwave clearly surpassed the previous high, the uptrend continuation is reaffirmed. The turning price is 68,960; the recent turning point is 69,100. The 20EMA (around 69,000) is rising and price sits above it; the 80EMA (4H 20EMA equivalent) and the 480EMA (daily 20EMA equivalent) are below price.
Focus: can it close above 69,550? If so, the uptrend continues with new highs. If not, a slowdown would imply trend continuation failure; if 69,100 closes below on the 1H, the latest upmove would be broken, and if 68,960 closes below, the 1H upwave ends. If 68,140 breaks, the 4H upmove would also break.
15m Analysis
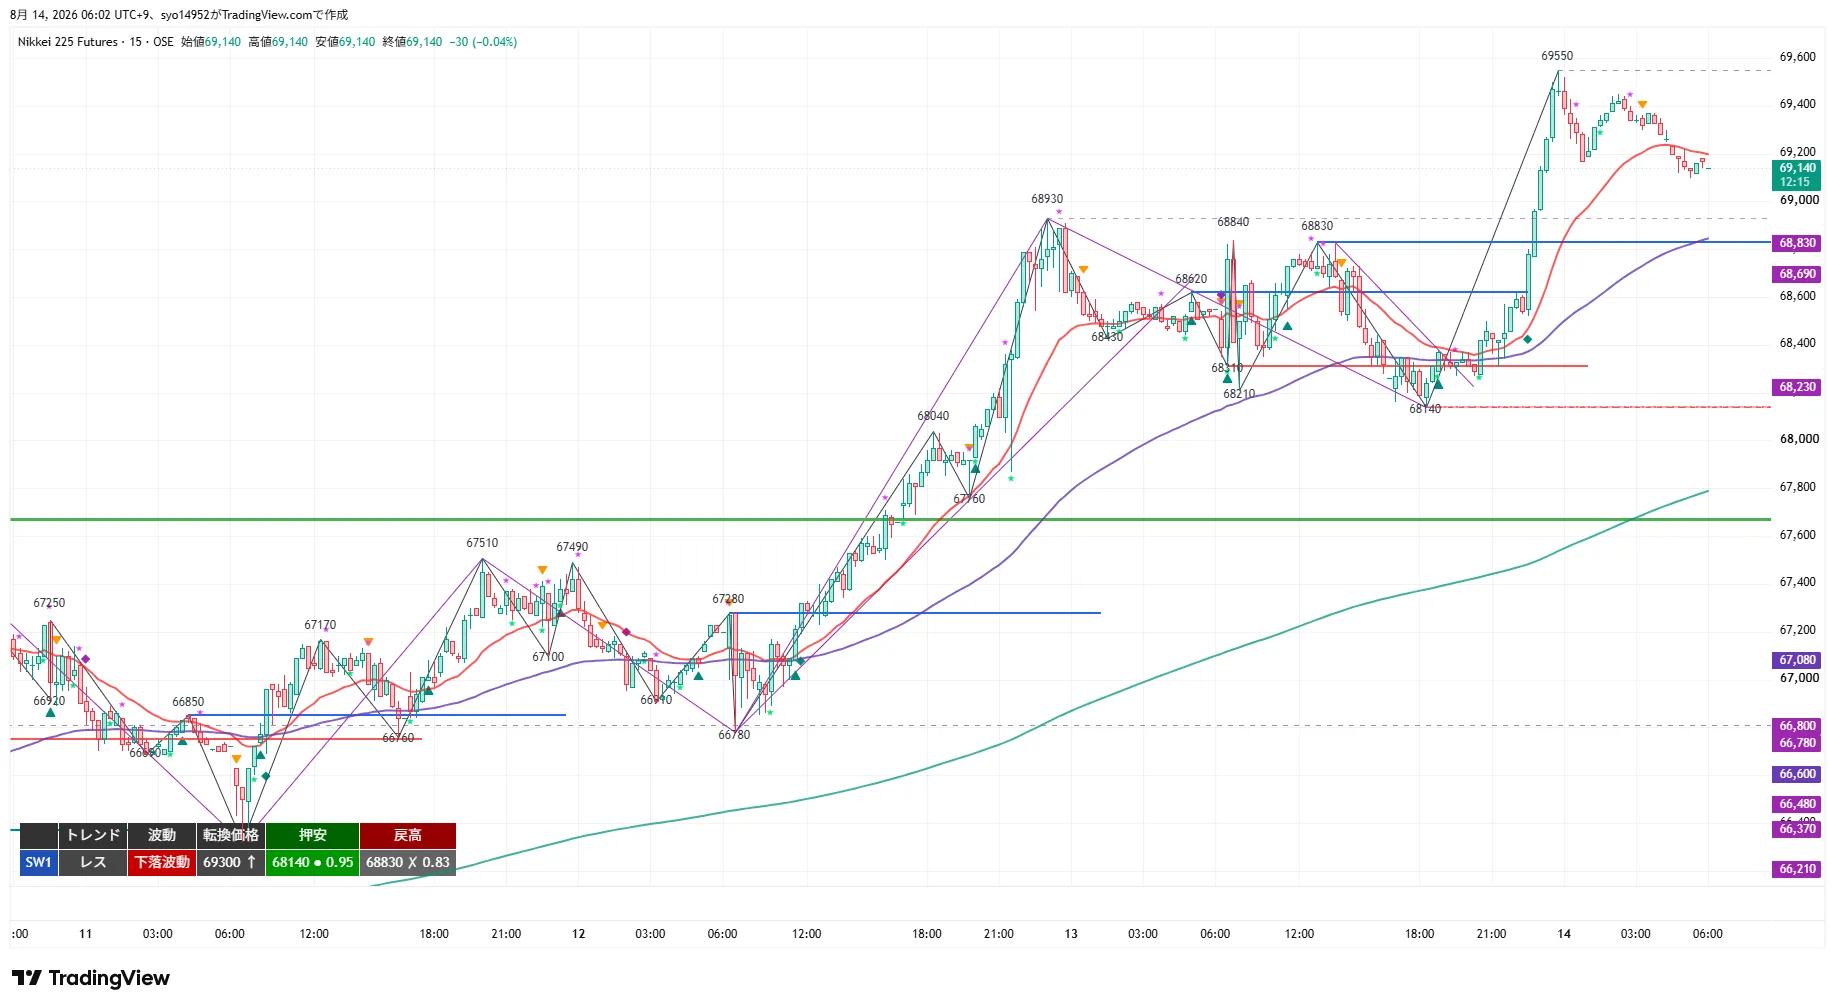
The 15m shows a range with a downtrend within the waves. Turning price is 69,300; the dip low is 68,140, and the rebound high 68,830 has already broken higher. From 68,140 to 69,550, price extended quickly and then pulled back to 69,140 to close. The 20EMA around 69,300 has turned slightly negative just above price, and the 320EMA (4H 20EMA equivalent around 67,800) is significantly lower and has diverged, indicating a gap from the price.
In execution terms, a close above 69,550 signals a breakout trade timing; if price rebounds to 69,100–69,350 and forms a reversal pattern on the 15m close, this offers a dip buy opportunity. If 69,100 closes below, it would indicate a reversal and a shift to selling. After the sharp rise, the 20EMA sits above price, so if pullbacks continue, a recovery to 69,300 would be a sign of renewed upside momentum.
MTF Status
- 4H: Uptrend / rising wave. Reached 69,550 and fell to -0.06% at 69,140. Turning price is 68,140; pullback low 64,680; recovery high 67,670 (X). 20EMA is rising; price remains above it, but the gap is widening.
- 1H: Range / rising wave. Reverted from 68,140 turning point, closed above 68,840, and reached 69,550 = trend continuation reaffirmed. Turning price 68,960; pullback low 68,140; recovery high 68,840 (X). 20EMA rising and price above it.
- 15m: Range / downtrend. From 69,550 to 69,140, closing. Turning 69,300; pullback low 68,140; recovery high 68,830 (X). 20EMA just above price with negative slope.
- Consistency: 4H uptrend / rising wave, 1H range / rising wave, 15m range / downwave; higher-timeframe uptrend remains intact while 15m forms a recent pullback. Core approach is trend-following dip-buying and breakout-following longs; selling targets trend continuation failure and is limited to above recent highs. Moving average bands support dip zones but are not used as breakout criteria.
Important Prices
- 73,760 JPY: Daily recovery high. Upper target (reference).
- 72,110 JPY: July recovery high. Upper price target.
- 70,900 JPY: 4H upper node. Upper limit of Zone 2 of pullbacks.
- 70,520 JPY: July high.
- 70,490 JPY: 4H upper node. Lower limit of Zone 1 of pullbacks.
- 69,570 JPY: Immediate landmark. Upper limit of Zone 1 of pullbacks.
- 69,550 JPY: August 14 Night high. ① Trigger / core position formation / ② Zone 1 core position formation / lower limit of pullback Zone 1 / ④ complete exit.
- 69,510 JPY: July recovery high. Has been broken above and turned to support.
- 69,350 JPY: Upward progression landmark. Upper limit of Dip Buy Zone 1.
- 69,300 JPY: 15m turning price / 15m 20EMA vicinity.
- 69,140 JPY: Current price / Night close price.
- 69,100 JPY: 1H upper landmark / 8/14 Night reversal point. Lower limit of Dip Buy Zone 1 / core formation / trigger.
- 68,960 JPY: 1H turning price. Upper limit of Dip Buy Zone 2 / confirm line for previous advance.
- 68,930 JPY: 8/13 high. Has been broken above.
- 68,830 JPY: 8/13 pullback high (X = breakout already) = support-turned. Lower limit of Dip Buy Zone 2 / ③④ T1.
- 68,140 JPY: 1H / 15m pullback low (4H turning price). ② core loss cut / ③④ T2 / ① complete exit.
- 67,910 JPY: 1H higher-timeframe support.
- 67,800 JPY: 15m 320EMA (4H 20EMA equivalent).
- 67,670 JPY: 4H old recovery high (breached) = support-turned. ② complete exit / ③ T2.
Trading Ideas
① Breakout Follow-Through (Long)
- Trigger: Break above 69,550 (Aug 14 Night high) on a 15m close (new high chase).
- Leading Entry Price: 69,550. After the breakout, pullbacks toward the breakout price vicinity or toward the inclined 20MA on short timeframes (1m, 5m) to lead (back-entry; RR based on breakout price).
- Actual Entry Price: 69,550 recovers on a 1H close = core position formed (double setup).
- Stop-Loss / Invalidations: Leading position below 69,250; core below 69,100. Complete exit below 68,140.
- Targets: 70,490 (partial take + entry price) and 70,900.
- RR: T1 (70,490) = 3.1 / T2 (70,900) = 4.5. Do not treat 69,570 as a true reference point for T1.
- MFE Protection: Exit at +200 in profit or move to breakeven; secure at least +100 with +300, or use trailing. Given the current high-price zone, protect early.
② Dip Buy (Long)
- Standard: Pull back to 69,100–69,350 (recent turning point to uptrend) and confirm a rebound on 15m close. Zone where 15m 20EMA overlaps, increasing rebound likelihood. Deep pullbacks to 68,830–68,960 (8/13 high = support-turned to 1H turning price) would set a stop at 68,530.
- Leading Entry Price: 69,250. After rebound is confirmed on 15m close, ensure price remains above the rising 20MA for lead entry.
- Actual Entry Price: 69,550 (recent high) recovers on 1H close = core formation. Since this equals T1, lead portion partially takes profit and moves entry price; if 1H close recovery is seen on same timeframe, add to core position.
- Stop-Loss / Invalidations: Leading below 68,950; core below 68,140. Complete exit below 67,670 (switch to ④).
- Targets: 69,550 (partial take + entry), 70,490 / 70,900.
- RR: T1 (69,550) = 1.0 / T2 (70,490) = 4.1. T1 is thin; prioritize back-entry; original reward is toward T2.
- MFE Protection: Exit at +200 breakeven or small profit; secure at least +100 with +300, or trailing. The pullback can be fast after a sharp rise, so protect early.
③ Sell the Rally (Short)
- Standard: In the zone 69,550–69,570 (night high to immediate upper node), confirm on a 15m close that price cannot clearly close above 69,550 and slows. Zone 2 becomes 70,490–70,900 (in this case set stop to 71,000).
- Leading Entry Price: 69,600. After confirming slowdown on 15m close, measure near recent highs on 1m/5m to lead (avoid jumping ahead above rising 20MA). Leading position is just above the most recent highs where slowdown is most likely; place stops above the zone.
- Actual Entry Price: 69,100 (turning point) breaks on 1H close = core formation of the recent upmove collapses.
- Stop-Loss / Invalidations: Leading recovers to 69,900; core recovers to 69,550. Complete exit above 71,000.
- Targets: 68,830 (partial take + entry), 68,140 / 67,670.
- RR: T1 (68,830) = 2.6 / T2 (68,140) = 4.9. The true reward is toward T2.
- MFE Protection: Exit at +200 breakeven or small profit; secure at least +100 with +300, or trailing. Do not place sell orders below established levels. Since all timeframes are in uptrend, avoid chasing. If the trigger is confirmed and T1 is reached, skip further actions.
④ Breakout Follow-Through (Short)
- Trigger: Break below 69,100 (1H upper node / night reversal point = supports 69,550 rise) on a 15m close (upward move breaks).
- Leading Entry Price: 69,100. However, since T1 risk-reward is 0.8 and 1.0, raise the trigger. Do not trade on just a 15m close; wait for 68,960 (1H turning price) to close below on 1H to confirm the 1H upmove has broken, then consider pullbacks toward breakout price vicinity or toward the inclined 20MA to lead (back-entry; RR based on breakout price).
- Actual Entry Price: 68,140 (1H / 15m pullback low / 4H turning price) breaks on 1H close = 4H upmove also broken, core formed.
- Stop-Loss / Invalidations: Leading recovers to 69,450; core recovers to 69,100. Complete exit 69,550.
- Targets: 68,830 (partial take + entry), 68,140 / 67,670.
- RR: T1 (68,830) = 0.8 / T2 (68,140) = 2.7. The original reward focuses on T2.
- MFE Protection: Exit at +200 breakeven or small profit; secure at least +100 with +300, or trailing. Do not place sells below the completed level. Since all timeframes are rising, do not chase; only core positions should be pursued after a clear close breach. If T1 has already been reached on the trigger, skip further actions.
Current Action
- Most Important Line 1: 69,550 JPY. Aug 14 Night high. A close above signals a continued breakout long (leading 69,550, core formation recovers at the same 1H close). If not surpassed and it slows, this indicates a trend continuation failure and a move to selling (leading 69,600). Next targets are 70,490 and 70,900.
- Most Important Line 2: 69,100–69,350 JPY. Recent turning point to the uptrend; a rebound is likely in the zone where 15m 20EMA overlaps, implying a dip-buy opportunity (leading 69,250). If 69,100 breaks, trigger ④ (leading 69,100, but confirm 68,960 1H close before leading), and if 68,140 breaks, the 4H uptrend collapses.
Entry prices, triggers, and stops are set based on the chart shape at the close time (turning prices, pullback lows, and rebound highs of each timeframe). If the structure changes over time but higher-timeframe structure remains, adjust entry prices using the turning prices of the lower timeframes (e.g., 15m) to better reflect the actual situation, and adopt the option that best fits reality.
Note: This report is for information purposes and not investment advice. Trading decisions are your own responsibility.