

【Bid?】Understand the price fluctuation mechanism!【Ask?】Technical analysis basics course #2
Hello! I’m SAKU, a trader.
Previous article talked about the theme of "demand and supply,"
this time we will go a little deeper into how those demand and supply affect price fluctuations
“Bid” and“Ask”, and let's unravel from there!
In the latter half of the article, we’ve included a more in-depth explanation about the previous “demand and supply,”
so if you want to understand price movements in the market, that part is also a must-check!
Bid and Ask are the “buying price” and “selling price” of a shop
First, let’s organize the meanings of the words with a very familiar analogy.
The world of FX operates in the same structure as when you visit a city’s brand buy-and-sell shop.
The two prices displayed on the order screen (example in dollars/yen) are the prices from the shop’s (market’s) perspective as follows.
・Bid (bid / sell price):
The price at which the shop will buy from you.
(When you want to “sell” dollars, you are bought at this price)
→ The image of a price tag the shop places on saying “We will buy at this price” (buy wall)
※From your perspective Bid is the “price to sell the product,” but from the shop’s perspective it is the “buying price of the product.”
・Ask (ask / buy price):
The price at which the shop will sell to you.
(When you want to “buy” dollars, you are sold at this price)
→ The image of a price tag the shop places on saying “We will sell at this price” (sell wall)
※From your perspective Ask is the “price to buy the product,” but from the shop’s perspective it is the “selling price of the product.”
Shops are not volunteers, so they always profit by buying cheaply (Bid) and selling high (Ask). Therefore, the relationship is always Bid < Ask, and this price gap is called the spread (something like a fee).
Why do prices move? Two order methods
Now, this is the main topic.
Why do these Bid and Ask move frantically?
Because a clash occurs between the “buy orders” and the “sell orders” of participants in the market.
Orders broadly come in two types: “market orders” (immediate execution at current price)“limit orders” (wait for a specified price)
This is the engine that moves prices.
As a premise, the market for buying and selling always needs the same number of sellers and buyers
There are people who sell to buy, and people who buy to sell. You may think this is obvious, but this is extremely important.
・In the world’s largest ticket resale marketplace
Imagine a very popular artist’s limited tickets being bought and sold in a marketplace.
In the center of the marketplace is an electronic board (order board), where everyone’s waiting orders line up.
Current board state
【Ask (queue of people who want to sell】
People who want to sell at 150.03 yen (10 tickets)
People who want to sell at 150.02 yen (5 tickets)
People who want to sell at 150.01 yen (3 tickets) ← best selling price (best Ask)
--- (There is a wall here) ---
【Bid (queue of people who want to buy】
People who want to buy at 150.00 yen (4 tickets) ← best buying price (best Bid)
People who want to buy at 149.99 yen (8 tickets)
People who want to buy at 149.98 yen (12 tickets)
The current price is Bid: 150.00 / Ask: 150.01. Let’s see how the price moves from this state.
・Mechanism where price goes up (buy orders win)
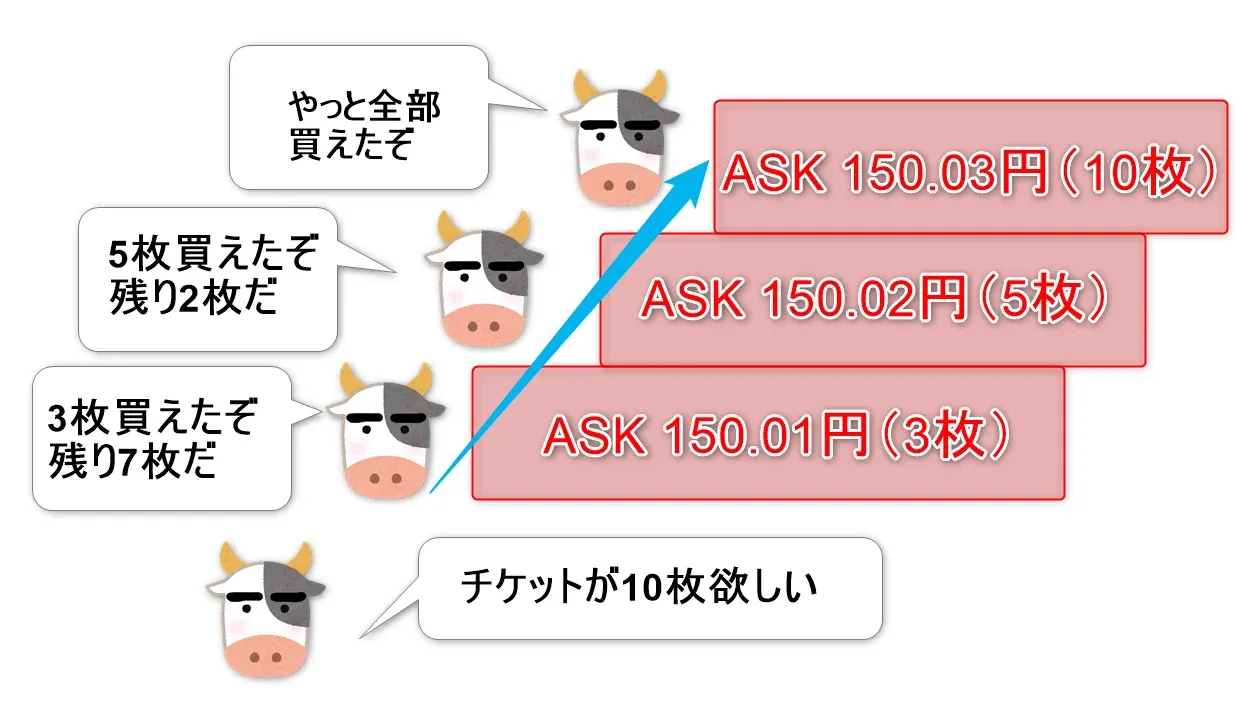
A “huge buyer” who wants the tickets (dollars) right away comes to the marketplace and
places an order like, “I’ll buy as many as I can right now — 10 tickets — no matter the price!” (a strong buy order)
This buy order instantly buys the cheapest selling offers available (Ask: 150.01 yen for 3 tickets).
But there are still 7 more needed.
Next cheapest seller (150.02 yen for 5 tickets) is also bought, still leaving 2 more.
Finally, buying 2 more from the seller at 150.03 yen, the order is fully satisfied.
【What happened as a result?】
Because all sellers at 150.01 and 150.02 yen disappeared, the next displayed cheapest selling price (Ask) jumps to “150.03 yen.”
Seeing the sellers become bullish (high price), the line of buyers (Bid) is also drawn up to “150.02 yen.”
In other words, the immediate “buy orders” exhaust upward the existing “Ask wall,” pushing the price up.
・Mechanism where price goes down (sell orders win)
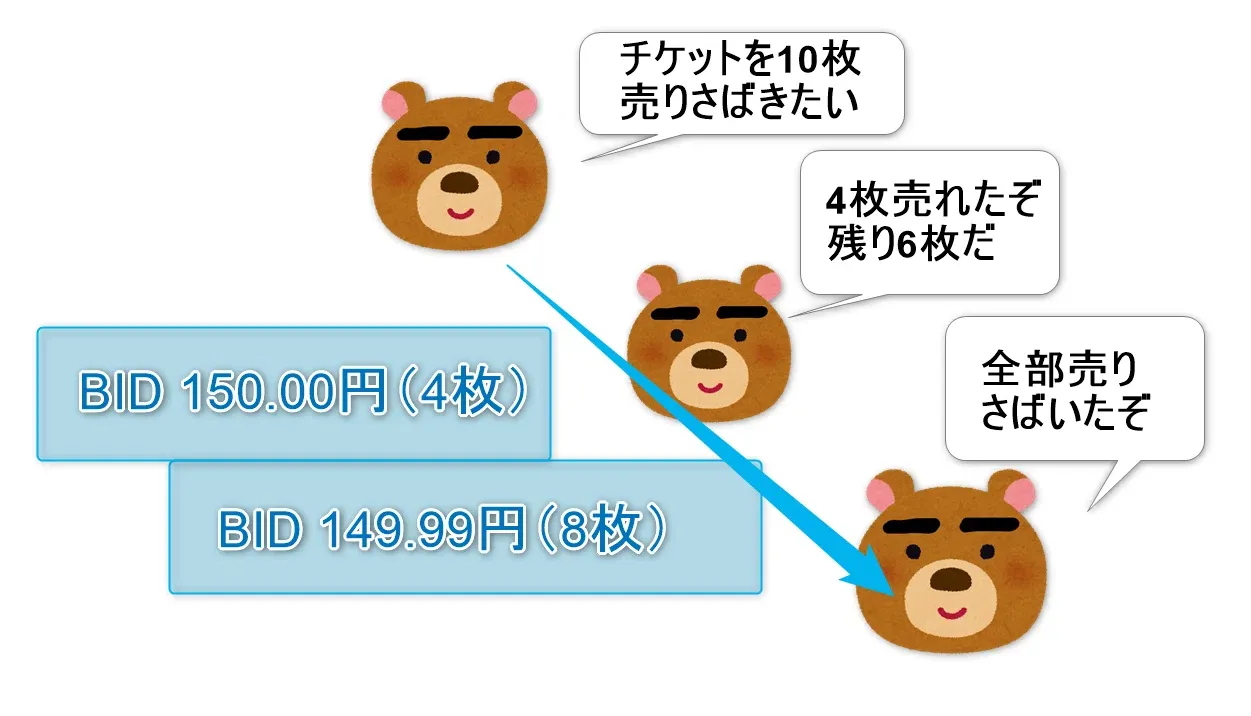
Conversely, a “throw-away seller” who wants to dump the tickets right away comes and places an order like, “I’ll sell 10 tickets now for any price!” (a strong sell order)
This sell order is immediately pushed against the highest bidding buyer (Bid: 150.00 yen for 4 tickets).
Since 6 tickets remain, it forces those waiting at 149.99 yen (8 tickets) to buy 6 of them.
【What happened as a result?】
The gentle buyers at 150.00 yen disappear, and the 149.99 yen tier becomes the next highest Bid.
In other words, the orders to sell immediately push down on the nearby Bid wall, causing the price to fall.
Summary
Exchange rates (Bid and Ask) move not because of economic news itself, but
because the people and AIs who see that news immediately place buy orders (breaking the Ask wall)
or because they immediately place sell orders (breaking the Bid floor)
as a result of physical quantity battles.
Ask climbs higher and higher:
Bid falls lower and lower:
This “wall-to-wall confrontation” is repeated tens of thousands of times per second among computers around the world, and that is the essence of FX price fluctuations!
※補足: Previous article
In the previous article,
[ Rising prices mean bulls are strong — many buyers — high demand; conversely, falling prices mean bears are strong — many sellers — abundant supply. ]
※ This is not precisely accurate, but for simplicity we’re explaining it this way for now. I’ll explain later what’s slightly different, so for now just understand it roughly.]
It was written like that, but more accurately, it’s not that there are more buyers, but that buy orders are larger in quantity, and there are sell orders that respond to that, which pushes prices up.
And when demand is high, there are enough Ask (selling wall, selling limit orders) to meet the buy orders.
In the earlier “ticket resale marketplace” example, it took supply up to 150.03 yen to meet the demand for 10 tickets.
The same applies to selling: it’s not that there are more sellers, but that sell orders are large enough, and there are enough buy orders that respond to them, which pushes prices down.
And supply being high means there are Bid (buy wall, buy limit orders) that respond to it.
In the earlier example, to meet the supply of 10 tickets, demand had to drop to 149.99 yen.
Furthermore, while limit orders can cap price rise or fall, actual price movements occur due to market orders (成行注文).
※ By the way, there is also a “stop order,” which is a trigger-type market order (trigger order) that sells if price falls below a threshold or buys if price rises above a threshold.
For example, a long position’s stop-loss trigger fires a market sell when the price hits the set level.
This area is a bit complex and may be hard to grasp, but it is extremely important for understanding price movements.
(Note: The following content is not very beginner-friendly.)
For example, when considering an uptrend followed by a pullback, during the rise there are obviously many buy orders, but the price could rise only because there are enough sells to absorb that rise, and once the rise stops, buy orders have absorbed into sells.
If the pullback is shallow, temporarily more sells than buys cause the price to pull back, but the bullish trend may still be strong with new buying that resumes after a small drop.
In other words, this pullback is not a bear’s heavy selling but a profit-taking by the bullish camp, and even after a small drop, if there are buyers again, the upward trend remains strong (plus consider the volume at that time).
Thinking about these things from supply and demand balance makes chart price movements more interesting!
Next time, we’ll study chart reading, which is essential in technical analysis!
If you found this article helpful, please like or give a heart! It’s encouraging!
For details on the author’s trading method, see below

【Limited-time early access campaign!】 → MMS Trading Encyclopedia— The true nature of “structural traps” that individual investors fall into and market microstructure analysis to see the footprints of big players — (A free sample version is also available)

→MTF Multi-Time Frame Analysis Essentials (A free sample version is also available)
Next article here →Learn the basic way to read candlesticks! ~ How to read charts Part 1 ~ Technical Analysis Basics #3