

[If you don't know this, you can't start] Extremely important! About demand and supply Technical Analysis Basics Course #1
Hello! I’m SAKU, a trader!
Have you ever heard of“demand and supply”?
I think most of you have heard of it.
But while you may understand the general idea, there are probably few people who understand how it actually applies to trading.
Not only in FX, but for making profits in trading, it is important to have a solid understanding of demand and supply.
Before we dive into technical analysis this time, we will delve into“demand and supply”and how it relates to trading.
What are demand and supply
Demand and supplyare fundamental topics in microeconomics.
This can be seen as the study of the interactions between buyers and sellers that determine prices and quantities of goods traded.
・Demand
Refers to the quantity of goods or services that buyers desire. The quantity demanded is the amount that people are willing to purchase at a specific price.
・Supply
Refers to how much the market is willing to offer for the products in demand.
The quantity supplied refers to the amount that producers are willing to supply when receiving a certain price.
・Law of Demand
There is an inverse or negative relationship between the quantity demanded and price.
In the law of demand, as price rises, the quantity demanded falls, and as price falls, the quantity demanded rises.
You don’t plan to buy a lot of expensive items, but you can buy many cheap items, right?
・Law of Supply
To understand how prices are determined, you need to look at both demand and supply.
Generally, as price rises, the quantity supplied increases, and as price falls, the quantity supplied decreases.
From the perspective of providers of services or products, if they can sell at high prices, they want to sell more; if prices fall, they’re less inclined to sell, right?
・Relationship between demand and supply
Demand and supply interact with each other.
As prices fall, the quantity demanded increases and the supply decreases.
Conversely, as prices rise, the quantity demanded decreases and the supply increases.
The price at which demand and supply balance is called the equilibrium price.
It is the state where the quantity supplied by sellers and the quantity demanded by buyers are in balance.
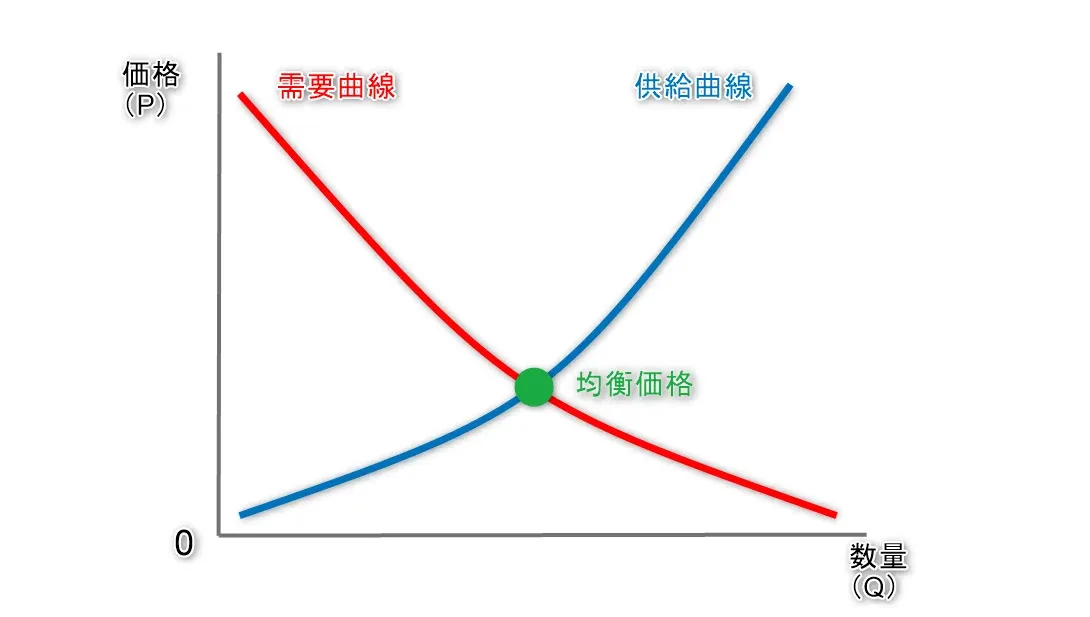
But in reality…
However, in real markets, equilibrium is achievable only in theory, soprices of goods and services continually change in relation to fluctuations in demand and supply.
Imbalances such as excess supply or excess demand occur, causing price and quantity to lose balance.
When prices are too high, excess supply is produced (excess supply).
Producers who want to increase profits (supply side) will keep producing more, but for consumers (demand side), prices are too high, so their buying intent decreases.
Conversely, when prices fall below the equilibrium,excess demandoccurs.
Because prices drop extremely low, many consumers who want to buy want to purchase, while producers (supply side) may find production costs not justified, so the amount produced decreases.
Then consumers have to compete to buy at the cheap price, pushing prices up through demand, and suppliers respond by supplying more, aiming to bring prices toward equilibrium.
So what does this have to do with trading?
After hearing all this,
“Isn’t this just school homework?”
or
“So what does this have to do with trading anyway?”
you may think.
However, this isn’t a long-winded unrelated discussion.
Understanding this basic demand-supply relationship well is very important in trading.
Next, we will look at demand and supply in trading.
Demand and supply in trading
In trading, demand refers tothe buyers, that isthe long side.
By the way, overseas, the buying power is commonly calledthe Bull. It’s the bull, right?
Supply refers tothe sellers, that isthe Short.
By the way, overseas, the selling power is commonly calledthe Bear. It’s the bear, right?
When prices rise, it means the Bull faction is strong — many buyers — high demand; conversely, price falls mean the Bear faction is strong — many sellers — high supply.
*This is not exactly accurate, but for simplicity we’ll explain it this way for now. I’ll explain later in future articles what exactly is different, so for now please understand it roughly.
Traders participate in the market obviously to seek profits.
So the two ways to make a profit are
① buy low and sell high
② sell high and buy back low
These are the two patterns.
①When prices are at a low level, the Bulls (buyers) start entering the market to buy while prices are low. As the Bulls’ influence grows and prices rise, buyers increase further, pushing prices up even more.
However,as prices rise gradually, buyers start to decrease and prices stop rising beyond a certain point.
“Who would buy at such high prices?!”That’s what happens.
Seeing this, Bulls who were buying at lower prices think prices have stopped rising, andthey realize profits and start selling their positions.
②Then, while prices are still high,short selling is attemptedby the Bear faction, and they gradually enter the market, pushing prices down.What happens here is the opposite of ①.
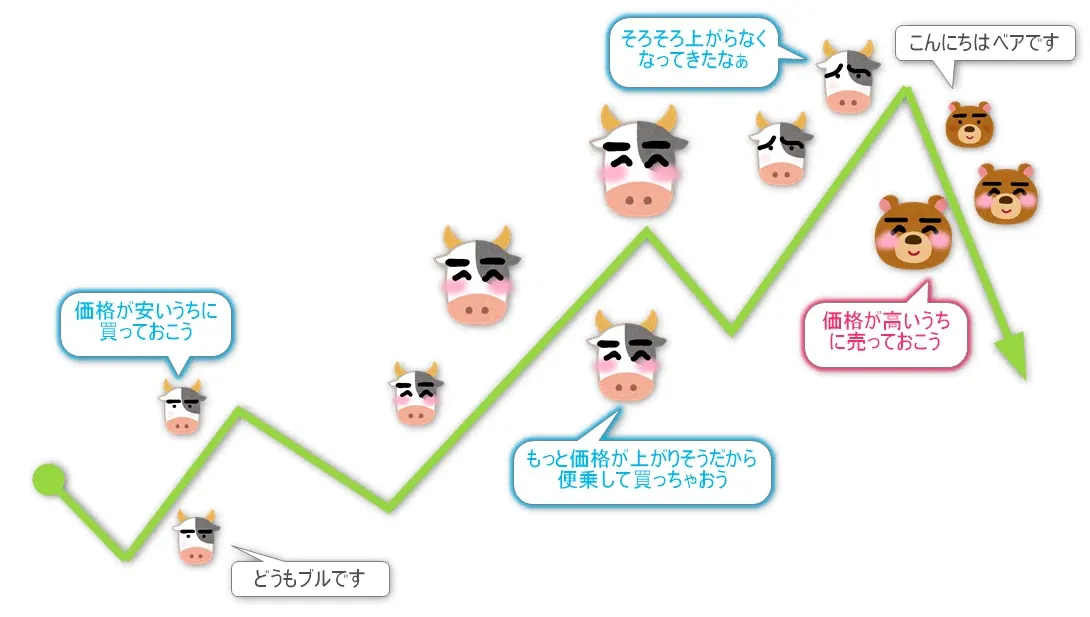
In basic terms, the market repeats this cycle.
Summary
Today we looked at demand and supply, from their basic concepts to their relationship in trading.
Technical analysis can be said to use various knowledge and techniques to discern the balance of these demands and supplies from charts. Now you analyze the chart to understand whether buyers or sellers are dominant and decide when to enter or exit.
Constantlyconsider whether demand is high or supply is highas you trade!
Next time we will delve into the Bid and Ask you often see on order panels!
For details on my trading method, click here ↓
MTF Multi-Time Frame Analysis Essentials(Discount campaign until August 31, 2026, 23:59!)
Next article here→【Bid?】Understanding the mechanism of price fluctuations, 【Ask?】