
[If you don't know this, you can't start] Extremely important! About demand and supply Technical Analysis Basics Course #1
Hello! My name is SAKU, a trader!
Everyone,“Demand and Supply”have you ever heard of it?
I think most people have heard of it.
But while you may vaguely understand the meaning, there probably aren’t many who understand how that applies to trading.
Not only in FX, but to profit in trading, it is important to have a solid understanding of demand and supply.
Before we dive into technical analysis this time, I will delve into the important“Demand and Supply”as it relates to trading and how it connects to trading.
What are Demand and Supply
Demand and supplyare fundamental themes in microeconomics.
This is a study of the interactions between buyers and sellers that determine prices and quantities traded.
・Demand
Refers to the quantity of goods or services that buyers are willing to purchase. The quantity demanded is the amount of product people are willing to buy at a specific price.
・Supply
Refers to how much of a product the market is willing to provide.
The quantity supplied refers to the amount produced by particular producers when they receive a specific price.
・Law of Demand
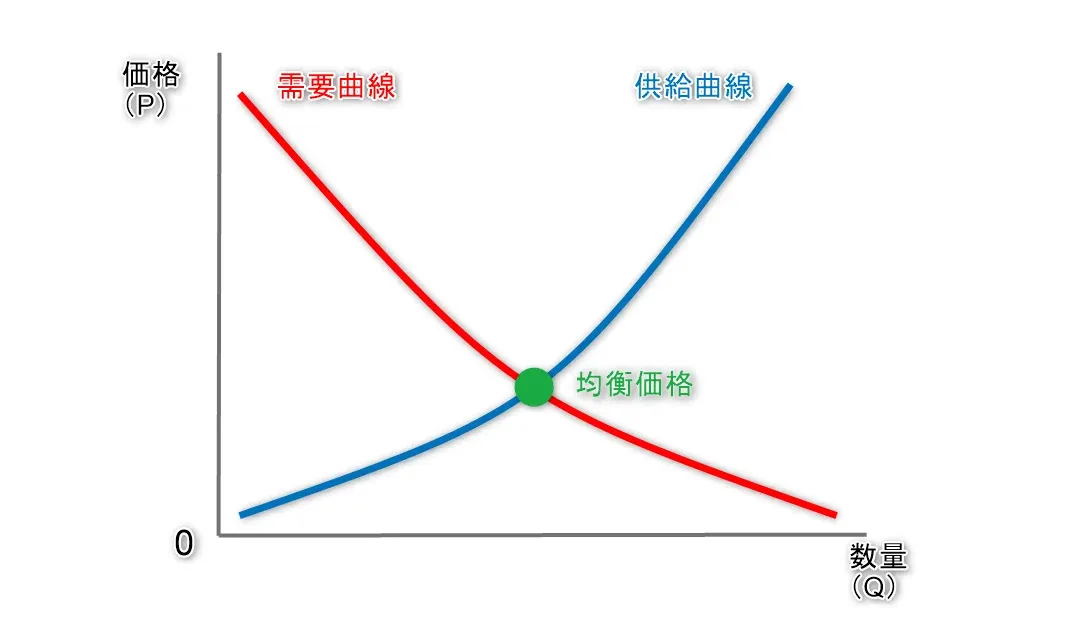
There is an inverse relationship between the quantity demanded and price.
In the law of demand, as price rises, the quantity demanded falls, and as price falls, the quantity demanded rises.
People don’t usually want to buy many expensive items, but they will buy a lot of cheap items, right?
・Law of Supply
To understand how prices are determined, you need to look at both demand and supply.
Generally, as price increases, the quantity supplied increases, and as price decreases, the quantity supplied decreases.
From the perspective of providers of services or products, if prices are high, they want to sell more; if prices fall, they don’t want to actively sell as much, right?
・Relationship between Demand and Supply
Demand and supply interact with each other.
As prices fall, the quantity demanded increases, and the quantity supplied decreases.
Conversely, as prices rise, the quantity demanded decreases, and the quantity supplied increases.
The price at which demand and supply meet is called the equilibrium price.
It is the price where the quantity supplied by sellers and the quantity demanded by buyers are in balance.
But in reality…
However, in actual markets, equilibrium is attainable only theoretically, soprices of goods and services continuously fluctuate with changes in demand and supply.
Imbalances occur when there is excess supply or excess demand, causing price and quantity to become unbalanced.
If the price is too high, excess supply occurs (excess supply).
Producers aiming to increase profits (the supply side) will want to produce more, but from the consumer (demand) side, the high price reduces purchasing desire.
Conversely, if the price falls below the equilibrium price,excess demandarises.
Since prices have become extremely cheap, many consumers (demand) want to buy the goods, while producers (supply) may find production not worth the cost, so the amount of goods produced decreases.
Then consumers must compete to buy at the low price, pushing demand up, and producers, accordingly, supply more to move prices toward equilibrium.
So, how does this relate to trading?
After hearing the above,
“Is this just schoolwork?”
or
“So how does this relate to trading anyway?”
you might think.
But this isn’t a long detour with no relevance.
Grasping this basic demand-supply relationship well is very important in trading.
From here, let’s look at demand and supply in trading.
Demand and Supply in Trading
In trading, demand refers tobuyers, that islongs.
For reference, overseas, the buying side is generally calledbull. It’s the bull market, right?
Supply refers tosellers, that isshorters.
By the way, overseas, the selling side is generally calledbear. It’s the bear market, right?
Rising prices mean the bull side is strong — many buyers — indicating high demand; conversely, falling prices mean the bear side is strong — many sellers — indicating high supply.
*This is not precisely accurate in all details, but for simplicity I’m explaining it this way for now. I’ll explain later what exactly is different, so for now just roughly understand it.
Traders participate in the market to seek profit, of course.
So, how can one make a profit?
① Buy low and sell high
② Sell high and buy back low
These are the two patterns.
①When prices are at a low level, buyers (the bulls) begin to enter the market to buy while prices are rising. As the bulls gain strength and prices rise, more buyers join in, pushing prices up further.
However,as prices rise gradually, buyers start to decrease and eventually prices stop rising beyond a certain point.
“Who would buy at such high prices?!”That’s what happens.
Seeing this, the bulls who were buying at low prices think prices have stopped rising, andlock in profits — i.e., sell off the positions they hold.
②Then, while prices are still high, the bears look toshort selling, andbearishgradually enter the market, pushing prices down.What begins as pattern ① begins to reverse.
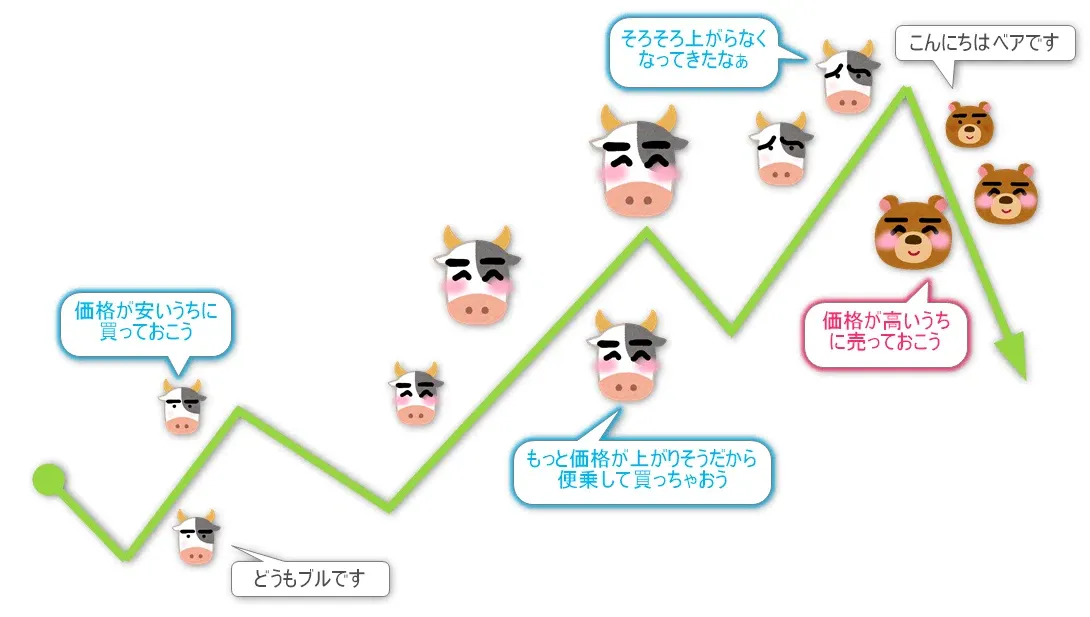
Basically, the market repeats this cycle.
Summary
This time we examined demand and supply, from the basic concepts to their relationship in trading.
Technical analysis uses various knowledge and techniques to interpret this balance of demand and supply from charts. Right now, by understanding whether buyers or sellers are prevailing, you can consider which side to join, and when to enter or exit by analyzing the chart.
Always consider whether demand is high or supply is high when trading!
Next time, we’ll delve into the Bid and Ask you often see on order panels!
If you found this article helpful, please give it a like or a♡! It would be encouraging!
For details on the author’s trading method, see here ↓

【Limited early access campaign underway!】→ MMS Trading Encyclopedia— Market microstructure analysis that reveals the “structural traps” investors fall into and the footprints of big players — (There is also a free trial version)

→The Essence of MTF Multi-Time-Frame Analysis (There is also a free trial version)
Next article here →【Bid?】Understand the mechanism of price fluctuations!【Ask?】