
August 14 (Fri): 【BB&HM】 Nikkei 225 VS Bitcoin
This time
the tendency is to move slightly ahead of the four major U.S. indices
“Bitcoin”
compared to it.
【Overall Scenario Probability】
This week’s overall market is…
“Up: 60% / Down: 40%”
※Although the uptrend of the four major U.S. indices continues and the up-move of the 10-year U.S. Treasury yield below its moving average supports upside via【negative correlation】, the discordant signal from Bitcoin’s downtrend warrants caution
※Presented for reference level.
【This Week’s Market Focus Points】
This week, the four major U.S. indices continue to show an upward bias, and the up-move of the 10-year Treasury yield dropping below its moving average via【negative correlation】 is supporting the upside.
The Nikkei 225 is shifting from a sideways movement (Time Adjustment) in the blue zone to an【Expansion】, and it is key whether it can break above an important resistance level.
On the other hand, Bitcoin is showing downside-dominant signals, and the direction mismatch with the four major U.S. indices makes future market judgment difficult. It’s hard to take your eyes off how this divergence will be resolved through this week’s price action.
Details are explained in the paid section.
➥The continuation is explained in detail in the members-only report.
If you’re not registered yet, please click here ↓
【Integrated Version】
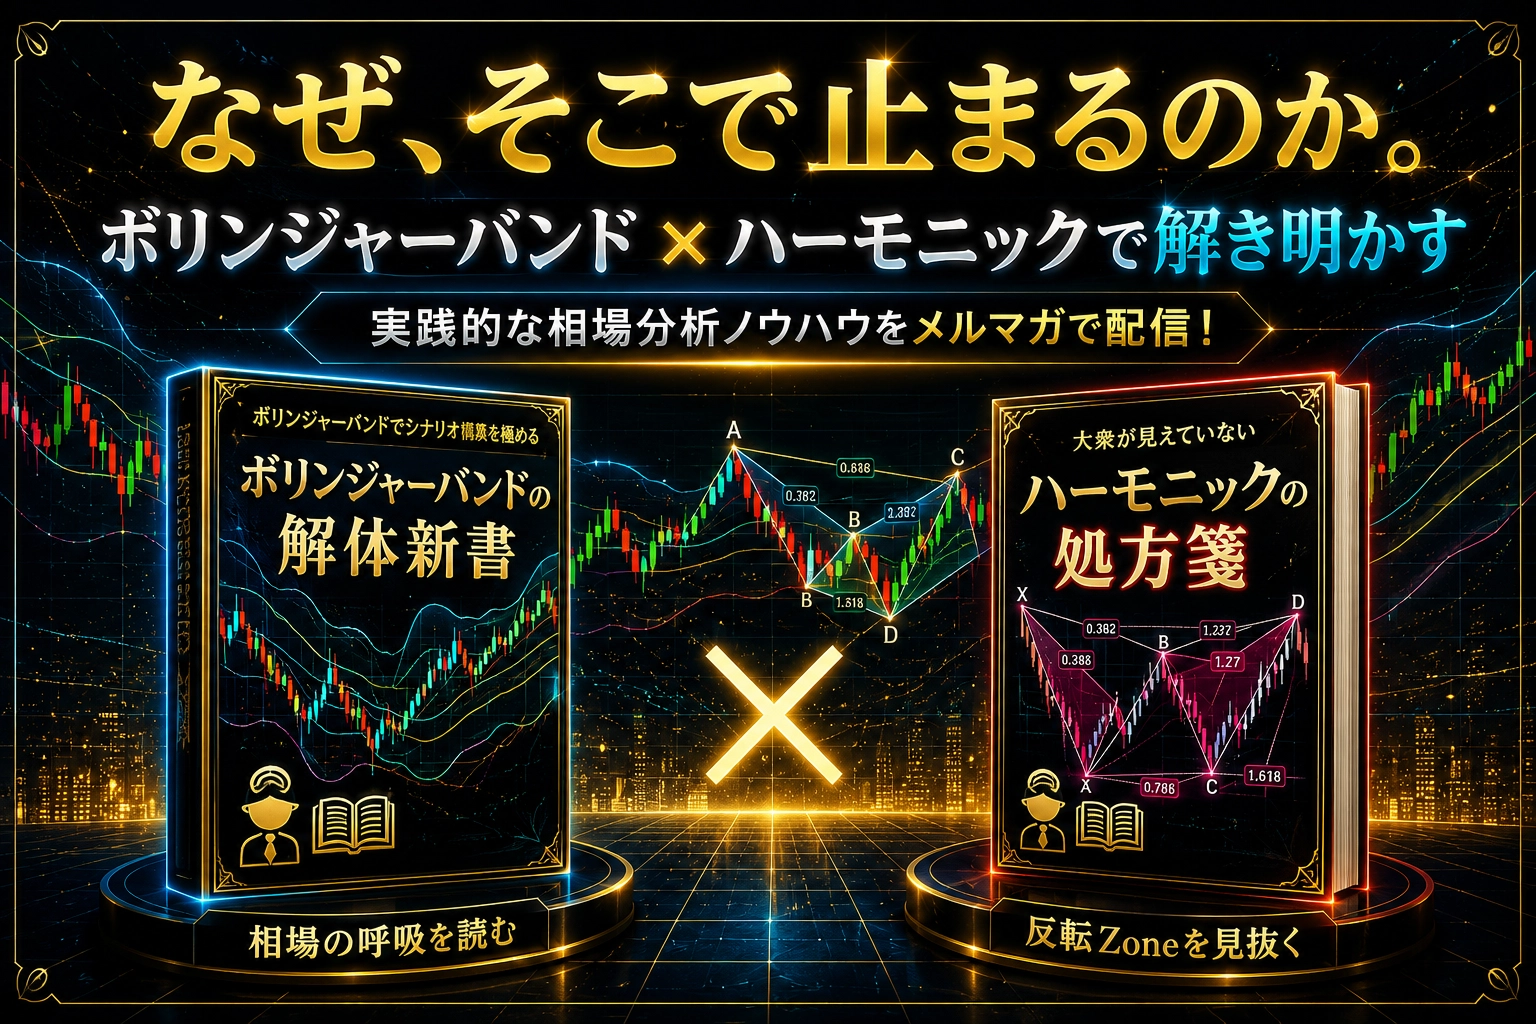
“Why does the market stop there?” Bollinger Bands × Harmonics: Fusion of statistics and geometry to capture turning points in the market with high precision!
https://www.gogojungle.co.jp/finance/navi/series/1613?via=articles_detail_aside
(Note: The following content is for members only.)
-----------------------------------------------
【Environmental Recognition】