

Does the MACD work? After trying 1,350 variations, I found out what the “zero line” really is.
I am Tonochi, working on EA development. I analyze various methods that have troubled me but I had overlooked, with the help of AI, adopting the good ones into EAs, and I publish those that, based on my analysis, do not show an edge in this form. This time is one of them.
The subject isMACD. I think it is, along with RSI, one of the indicators that most people have on their screens.
Here is the conclusion first.By my method of measurement, using MACD as a buy/sell signal to obtain an edge was not possible.I tested 1,350 combinations for short-term/long-term/settling, and there were zero profitable results on the 15-minute chart.
However, that is not the main point this time. While researching, I found thattwo-thirds of the representative uses of MACD had already been answered in the previous Golden Cross verification. The remaining core wereDivergence(price vs. indicator disagreement) andwhether settling has meaning, which were the two items left.
1. What MACD is
The name sounds sturdy, but the content is simple.It is the graph of the difference between the short-period moving average and the long-period moving average.
- MACD line= short moving average (12) − long moving average (26)
- Signal line= the MACD line smoothed by 9 periods
- Histogram= MACD line − Signal line
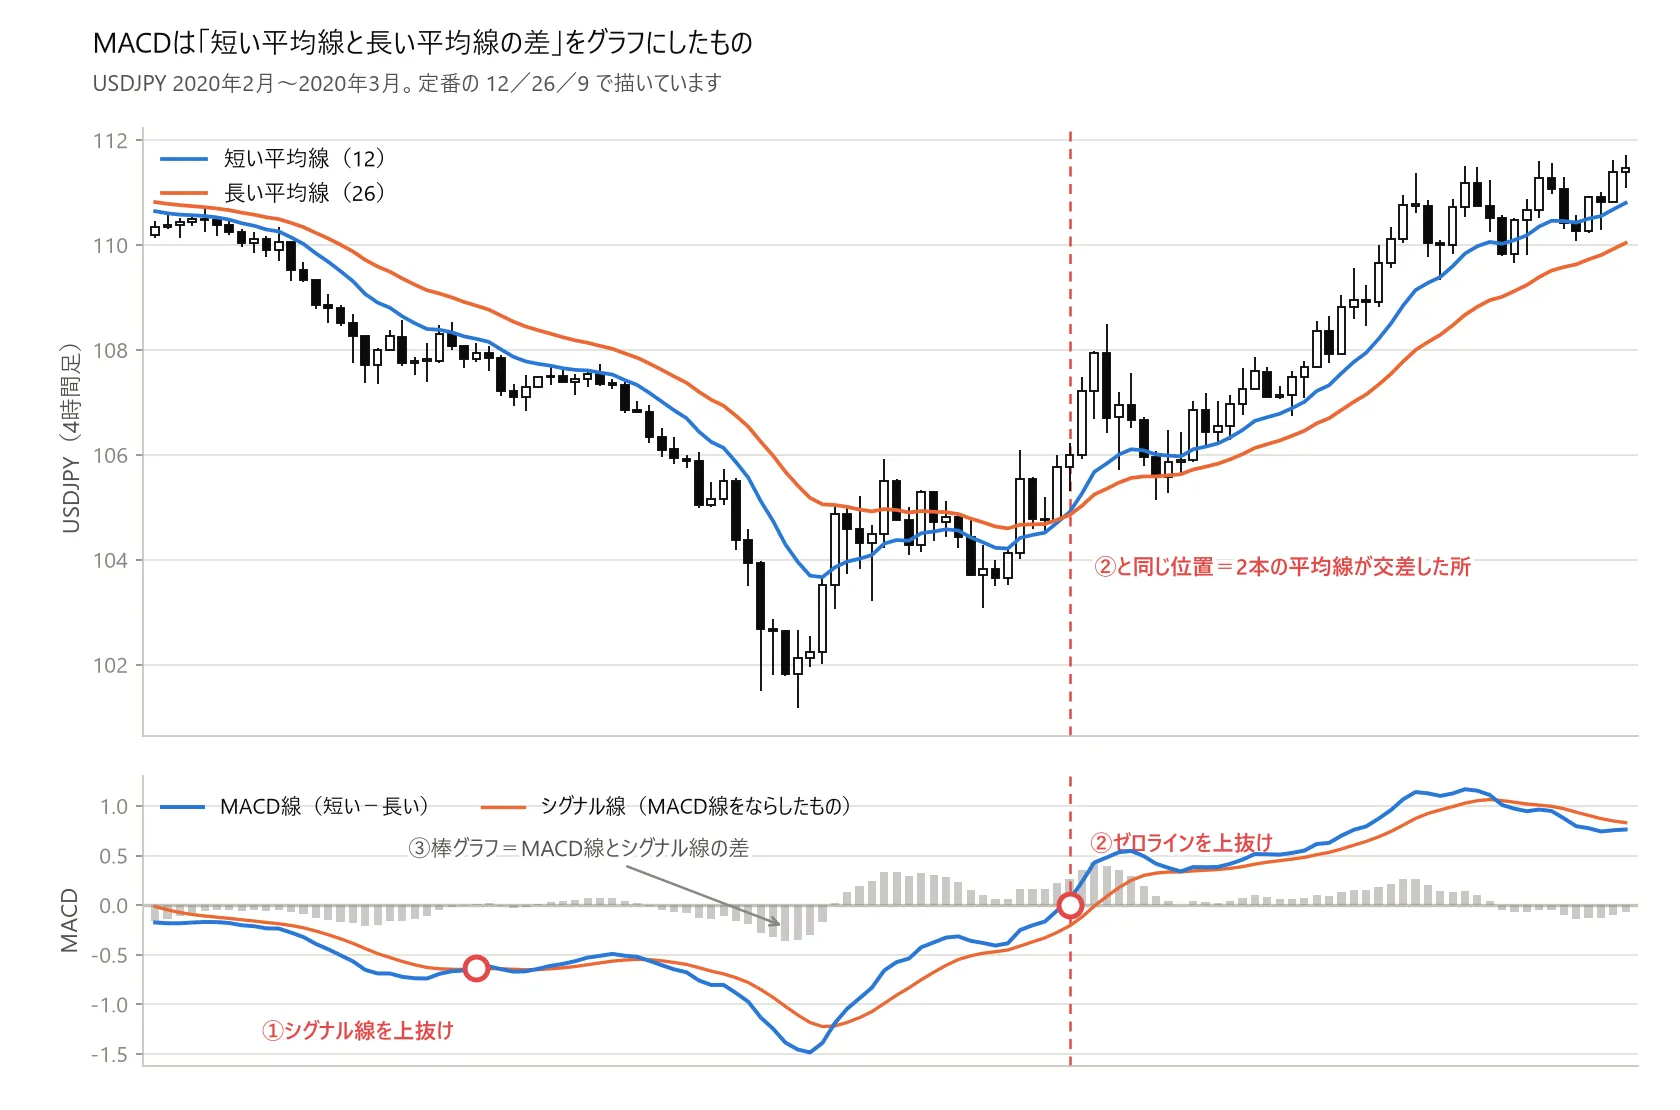
▲Figure 1: USD/JPY 4-hour chart. The top shows candles with the short and long moving averages overlaid. The bottom shows their difference = MACD line (blue) and the smoothed signal line (orange), and the histogram, which is the difference between the two. Points where MACD crosses above the signal line and where MACD crosses above zero are marked.
There are three ways to use it.① Cross with the signal line ② Break of the zero line ③ Divergence(Price makes a new high while MACD does not—momentum fading). The standard numbers are12・26・9.
2. Two-thirds of the usage was already answered previously
② The zero-line break is exactly the same event as “when the short moving average overtakes the long moving average”. Since the MACD line is “short − long,” breaking zero simply means the short side came out on top.
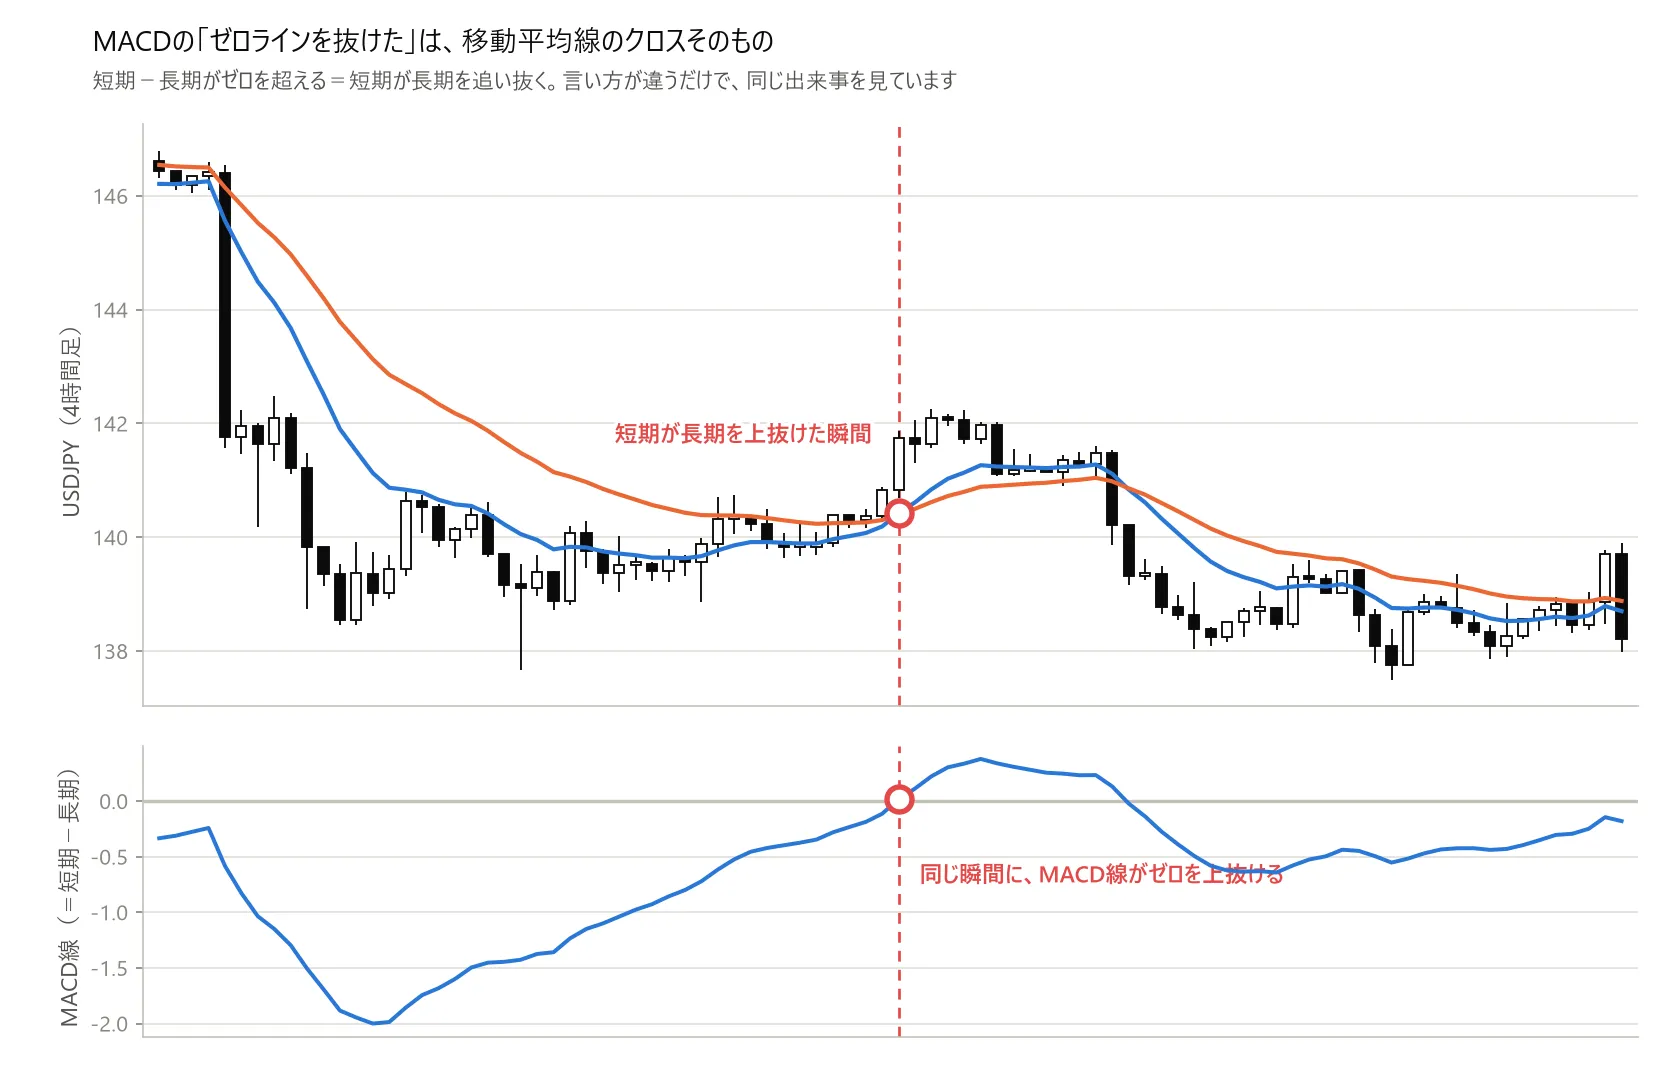
▲Figure 2: The upper chart shows candles with the short and long moving averages. A red mark appears at the moment the short overtakes the long. The lower chart plots only the MACD line, which also crosses above zero at exactly the same moment. It’s just viewing the same event in two ways.
In other words② is just a renamed Golden Cross.① is also the same family, since it compares the difference with the line that has been settled once more. In the previous run, I tested that cross 1,631 times and could not obtain an edge as an entry signal.First, I checked whether the same result would appear with MACD as well.
3. Honestly test — 1,350 combinations
Short-term 16 × Long-term 18 (short < long 225 combinations) × Settling 6 =1,350 combinations. Across 4 timeframes, 7 currencies, 26 years, after cost of 1 trade = 1.2 pips. Exit when the opposite cross appears.
| Timeframe | ① Cross with the signal line | ② Zero-line break |
|---|---|---|
| 15-minute | 0.0%(All 1,350 failed) | 0.0% |
| 1-hour | 3.1% | 0.0% |
| 4-hour | 9.5% | 8.4% |
| Daily | 42.9% | 68.0% |
The 15-minute charthad a net zero profit even before costs. On the 1-hour chart, the best result was +0.24 pips per trade, roughly the same as the total cost of 1.2 pips. The daily chart shows better numbers, not because skill improved, but becausethe number of trades dropped sharply, reducing total costs.
4. Is the standard 12・26・9 special?
If there is a reason that those numbers are superior, they should perform better than surrounding combinations. So I calculatedthe average of the neighboring 8 cells from that cell’s performance(the same idea as comparing medicines to placebo in a trial).
Result:For all four timeframes, the 12/26 peak was buried by overall variability. Ranks were15th on the 15-minute, 720th on the 1-hour, 578th on the 4-hour, and 578th on the daily (out of 1,350 combinations), sitting neatly in the middle.
Top combinations also could not survive scrutiny when considering ① testing the direction of buy/sell by time, ② dividing the era into three periods, ③ altering the construction of the moving averages by one element (changing the construction could yield+28.9 → −11.9, with a sign flip). The claim that the histogram slope can be used to enter positions is greatly negative for the 1-hour, 4-hour, and daily (all negative). Even when directly comparing with raw moving average crossovers, the settled side did not beat the raw side(daily +172.4 vs +121.5 pips/year).
5. The core—Divergence
This is the MACD’s natural showdown. But when measured, the flaw was in the area before outcomes were determined..
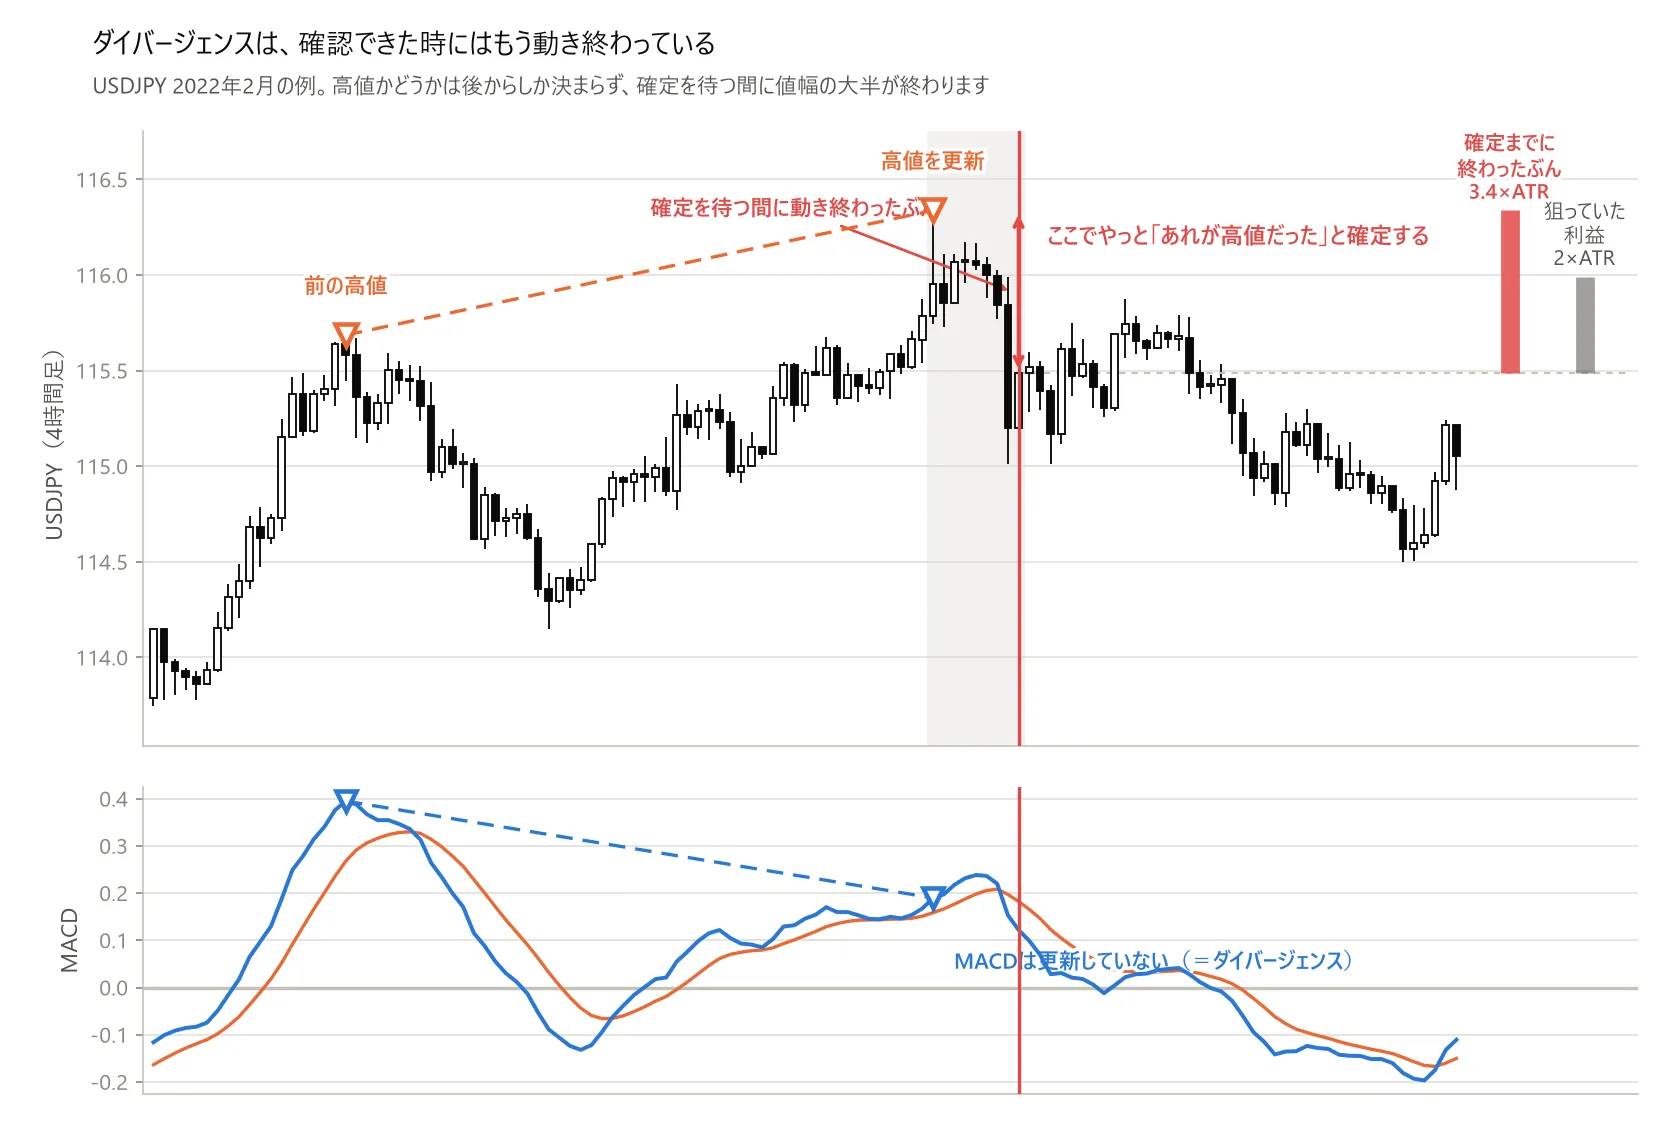
In practice, when divergence is confirmed, the ATR (the average magnitude of price movement in that period) had already moved about 3 units (15-minute = 9 bars / 1-hour = 10 bars / 4-hour = 11 bars). This is larger than the target profit (2 units).
Performance across timeframes × four patterns for catching peaks/troughs × three MACD periods was negative in all cases. None of the four timeframes yielded a positive result, and among the currencies, seven had zero positives.
Conversely, trying to bet on the opposite direction did not work either. The win rate was 33%, and a breakeven ratio is 33.3%. In other words
6. Changing the usage — using it to confirm market tone
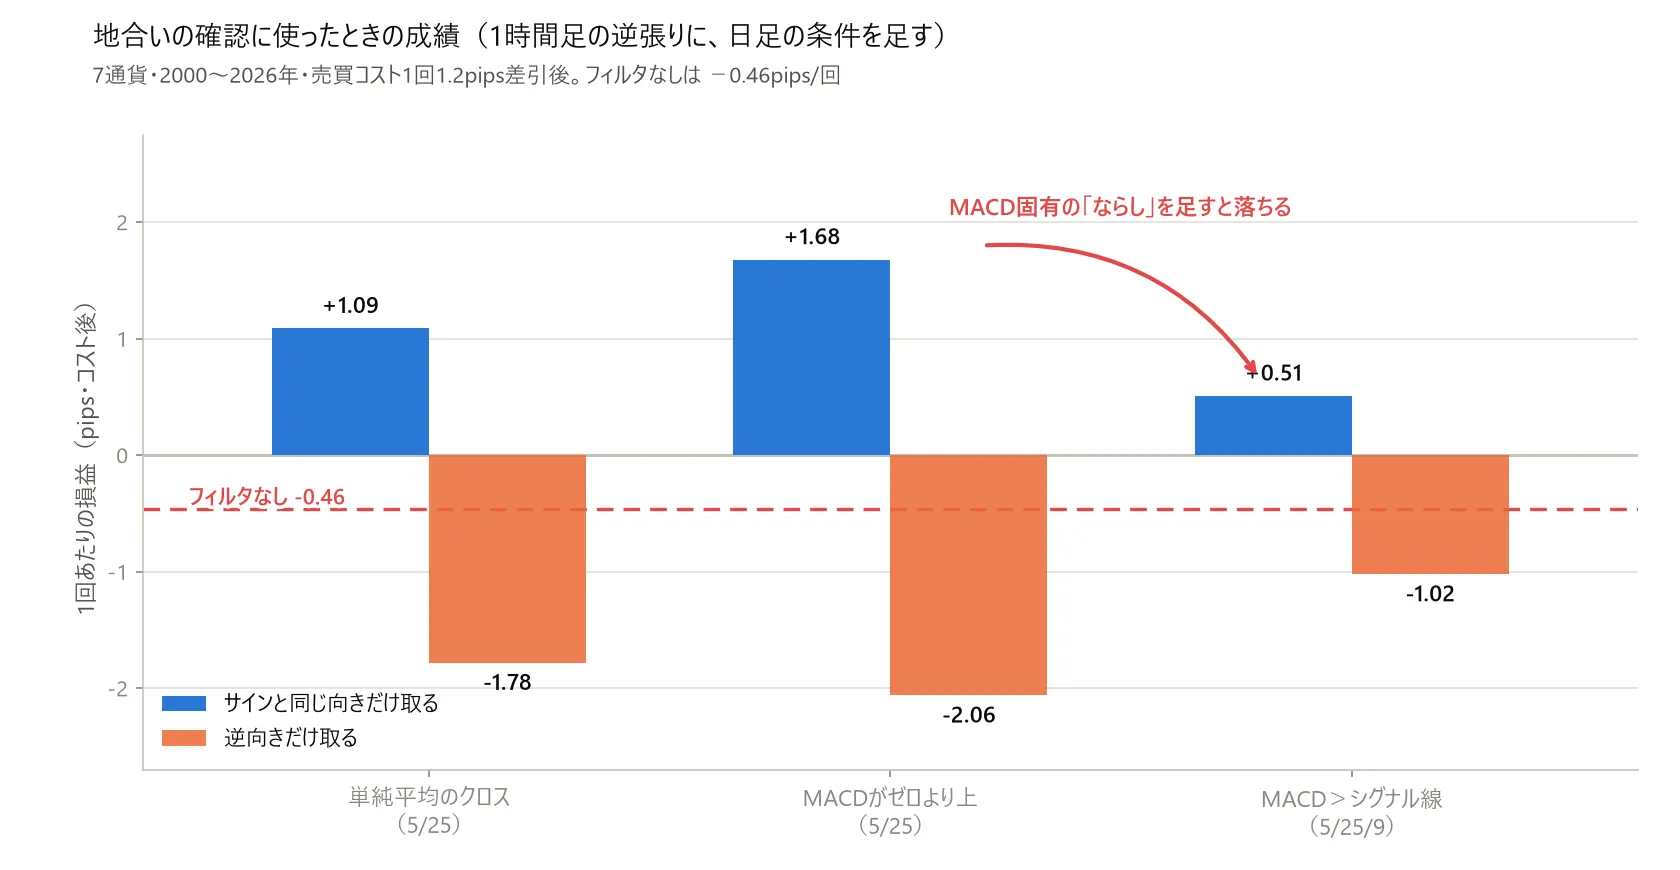
Previously, using the same line to confirm whether I am in an uptrend or downtrend rather than as a trigger yielded different results. I repeated the test, and also framedwhether MACD-specific “settling” has value in a way that can be compared. With the same short/long periods,A simple moving-average cross / B MACD above zero (i.e., cross with exponential moving average) / C MACD > Signal line (i.e., adding settling to B) presented side by side.
Entry = on the hourly chart, RSI(14) crosses above 30 to buy, or below 70 to sell; exit = 24 bars later (no stop loss or take profit). The market condition is judged on the daily chart, and only values confirmed by the previous day are used. Without filtering, it is −0.46 pips per trade.
 【Figure 4】 Insert image here → macd_fig4_filter.png
| Daily condition | Proportion filtered | Per trade |
|---|---|---|
| None (take everything) | 100% | −0.46 |
| A Simple moving-average cross 5/25 | 46% | +1.09 |
| B MACD above zero 5/25 | 43% | +1.68 |
| C MACD > Signal line 5/25/9 | 36% | +0.51 |
| C MACD > Signal line 12/26/9 (classic) | 41% |
① It works as a confirmation of market tone.The negative turns into a positive. The suspicion that “reducing trades by half is not enough” is debunked when compared to a random halving of trades (I generated 300 random halving trials; none beat the real one).Taking only the opposite direction deteriorates cleanly( +1.68 ⇔ −2.06 ).
② However, that is a property of the difference—the cross of moving averages.③ Andadding MACD-specific settling reduces performance( +1.68 → +0.51 ). When viewed across 12 variations, only 4 improved with settling (33%); this 33% is nearly identical to the 33.8% found with the other measurement method (different timeframes, different entries). If the answer holds across changing the field, it is reasonably credible.
I also tested using divergence as a filter, butin the textbook direction, it worsened to around −2.80〜−3.68 pips per trade. Using it in the opposite direction yields positives, but as market regimes shift and tweaking the windows changes winners and losers, my discipline did not allow it to pass.
7. Finally, I tried implementing it in my own EA
Since “a general theory is weak” and “what if I add it to my own tool” are separate concerns, I also measured this. In my EA, I replaced only the part that decides “whether I am in an uptrend or downtrend” with the MACD method, andcompared the final growth after aligning the drawdown (including unrealized losses).
Result:Replacing with the classic 12/26/9 widened the drawdown by 5.9 points, and matching the same drawdown reduced profit by about 14% (roughly 0.7 percentage points lower annually). Replacing with other methods also lost compared to the current approach.MACD is not used in Tonochi FX.
This result does not contradict §6. The effect in §6 was the difference between the short and long moving averages, which is already a criterion in my EA.Therefore, replacing with a tool of a similar role but slightly different characteristics did not provide a reason to expect improvement.
8. This verification’s limits
- There is only one way to construct exits (§3 until the opposite cross, §5 with stop loss 1 and take profit 2, §6 exit after 24 bars)
- The way I catch the divergences is the one I defined. The method of manual drawing of “meaningful highs” is not reproducible
- Effect size should be viewed as a range.The additive effect in §6 varies from +0.1 to +1.7 pips, and the average of the band is about +0.4 pips. Selecting only the best points can exaggerate the results
- The targets are the seven major dollar-related currencies. Cost is fixed at 1.2 pips per trade
9. Summary
As a signal, I could not find stable edge anywhere in the 1,350 combinations. The standard 12/26/9 did not outperform the rest.MACD’s “zero-line break” is the cross of moving averages itself, and two-thirds of its usage was answered in the previous article. The main divergence is that, once confirmed, about three units of ATR had already moved, and the profit to target was not achieved; conversely, you could not win by betting the opposite.It does help as a market-tone check, but that is the result of the difference, not MACD’s unique settling.
This ismy measurement perspective. I do not deny that others achieving results with MACD exist; I simply do not want to use it without confirming it with my own data.
The takeaway from this is that the denial is clear.It wasn’t that MACD was weak; the effective part was the ordinary difference between the two moving averages.I break down the indicators piece by piece as I add them. It is laborious, but without doing this, I end up accumulating things that feel effective but aren’t. When I look at a new indicator next, I intend to first determine what two things it is the difference of.
Verification conditions: 7 currencies (EURUSD, USDJPY, GBPUSD, USDCHF, AUDUSD, NZDUSD, USDCAD) / 2000–2026 / from 15-minute price data create 1-hour, 4-hour, and daily charts / judgments only on settled candles / trading cost 1.2 pips per trade / §6’s market condition uses only daily data confirmed up to the previous day.
Disclaimer: This article is a development record based on backtesting of past data and does not guarantee future performance. It is not investment advice. Please make trading decisions at your own risk.