
NK225 Futures MTF Dow Theory 4-Scenario Analysis Report 2026-08-13
N225 Futures MTF Dow Theory Analysis Report
Date and Time: August 13, 2026 06:23 JST / Night Session Close
Current Value: 68,550 JPY
Target: For intraday session (Thu, 8/13)
Conclusion
After breaking above yesterday’s focal 67,490, it moved higher during the night, clearly surpassing the 4H retracement high of 67,670 and reaching 68,930. It closed at 68,550, and the daily candle is a strong positive with the 68,810 pivot also broken. All timeframes 4H / 1H / 15m are in an uptrend and upward waves align, removing one resistance level. Throughout Thursday, the focus is whether it can break above 68,930 again.
If the price closes above 68,930 on the 15m chart, it signals a fresh breakout long; if it pulls back to 68,040–68,430 and rebounds, that is a pullback buying opportunity. On the downside, avoid selling beneath established levels; if it fails to hold above 68,930 and stalls, aim to enter around 68,930–69,100. If 68,430 (reversal point) breaks, the latest upward wave structure may fail; if 67,670 (the 4H breakout wall) breaks, the breakout is negated. Given the rapid rise, pullbacks tend to be quick, so protective measures should be placed early.
4H Analysis
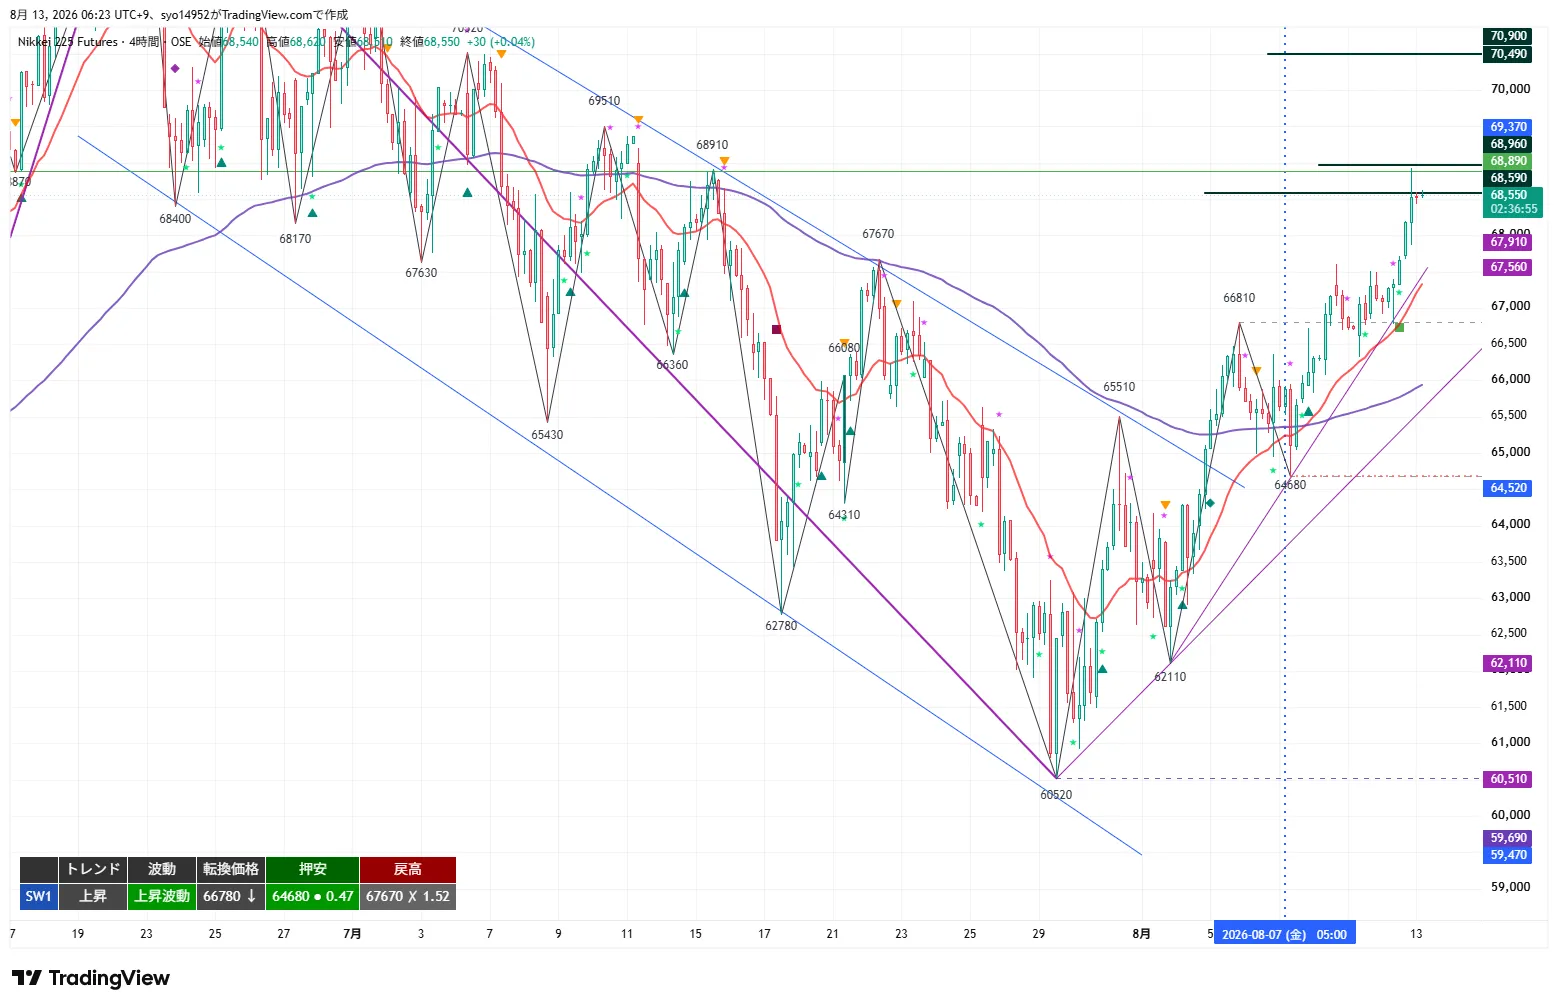
The 4H chart shows continuation of an uptrend and an upward wave, with a clear close above the retracement high 67,670. This removes one resistance level formed since July during the downswing. It reached 68,930 and closed at 68,550 on the upside, with the conversion price at 66,780. The 20EMA (around 67,000) is rising, price sits above it, and the 120EMA (daily 20EMA equivalent) is well below, indicating a favorable upward alignment.
Key resistance levels to watch are 69,510 (July retracement high), 70,520 (July high), with further levels at 72,590 and 73,760. Support levels include 68,430 (recent reversal point), 68,040, 67,670 (old retracement high turned to support), and 66,780 (conversion price). As long as 66,780 does not break, the 4H bullish structure remains intact. The daily candle is +1.32% strong with a close above 68,810, suggesting an overall upward trend but within a high-price rapid ascent.
1H Analysis
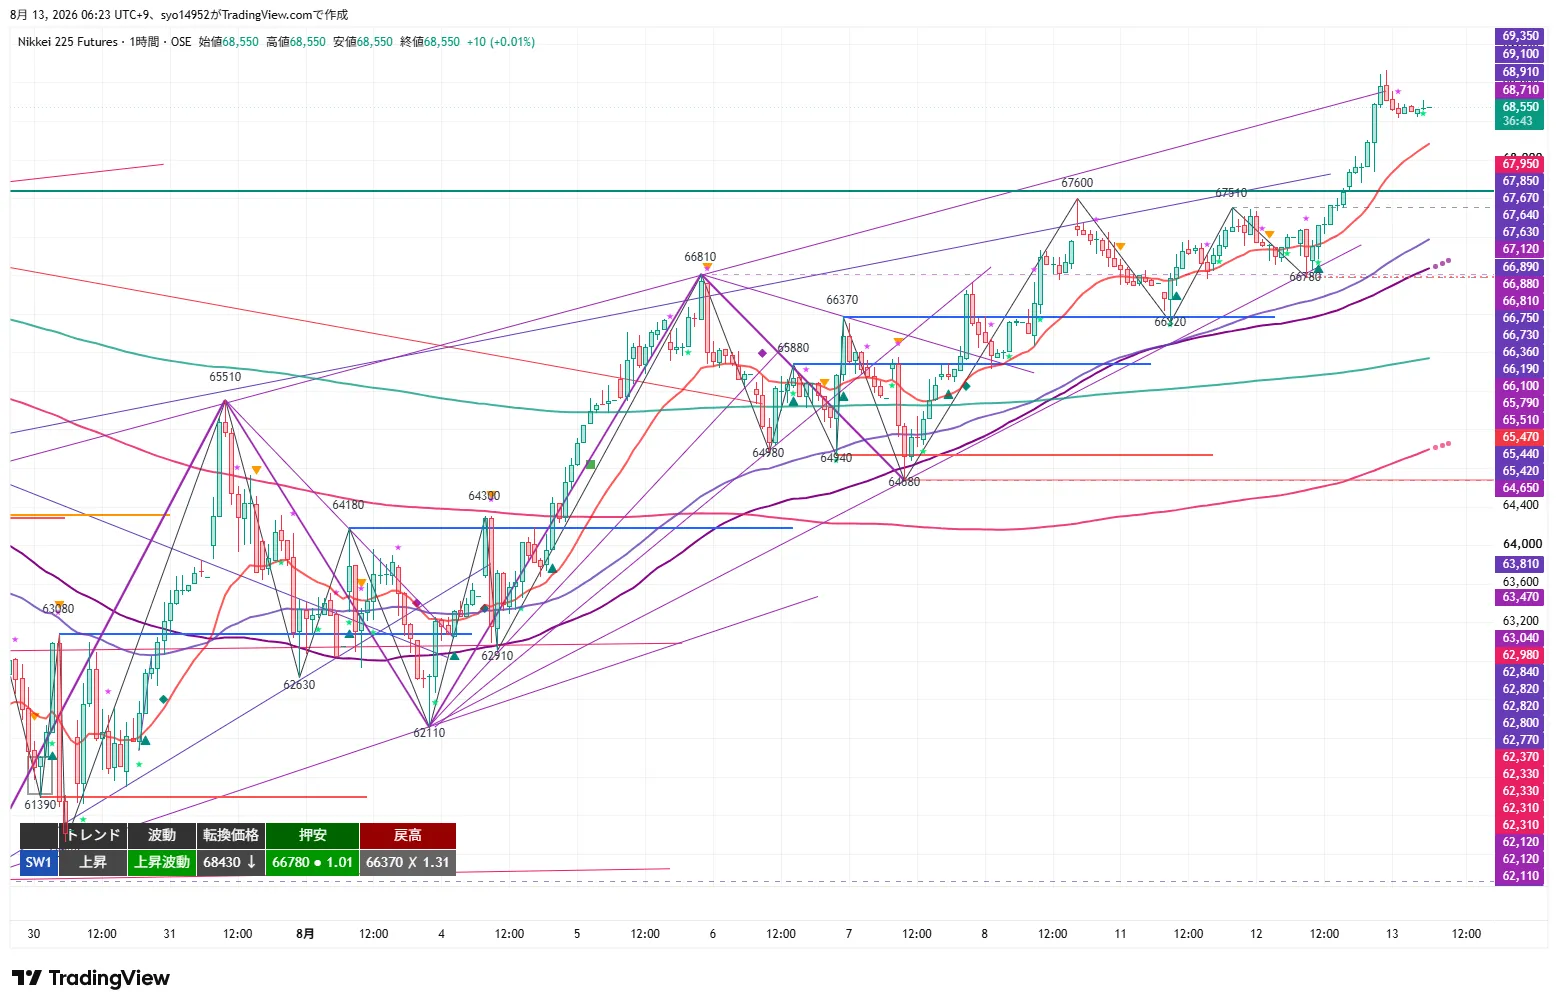
The primary structural assessment rests on the 1H chart, showing an uptrend and upward waves. After a breakout above 66,370, it successfully surpassed 67,490 and 67,600, and then clearly moved above the 4H retracement high 67,670 to reach 68,930. The next upward wave continues to exceed prior highs, indicating ongoing trend entry. The conversion price is 68,430, serving as the current retracement level supporting the upward phase. Both the 20EMA and 80EMA (4H 20EMA equivalent) and the 480EMA (daily 20EMA equivalent) are rising, with prices positioned above them.
Focus is whether it can close above 68,930. A close above would sustain the upmove; failure to do so and a stall would imply the trend continuation failure, and a close below 68,430 on the 1H would undermine the latest upward wave. If 67,670 (the 4H breakout wall) breaks, downside pressure increases, negating the breakout.
15m Analysis
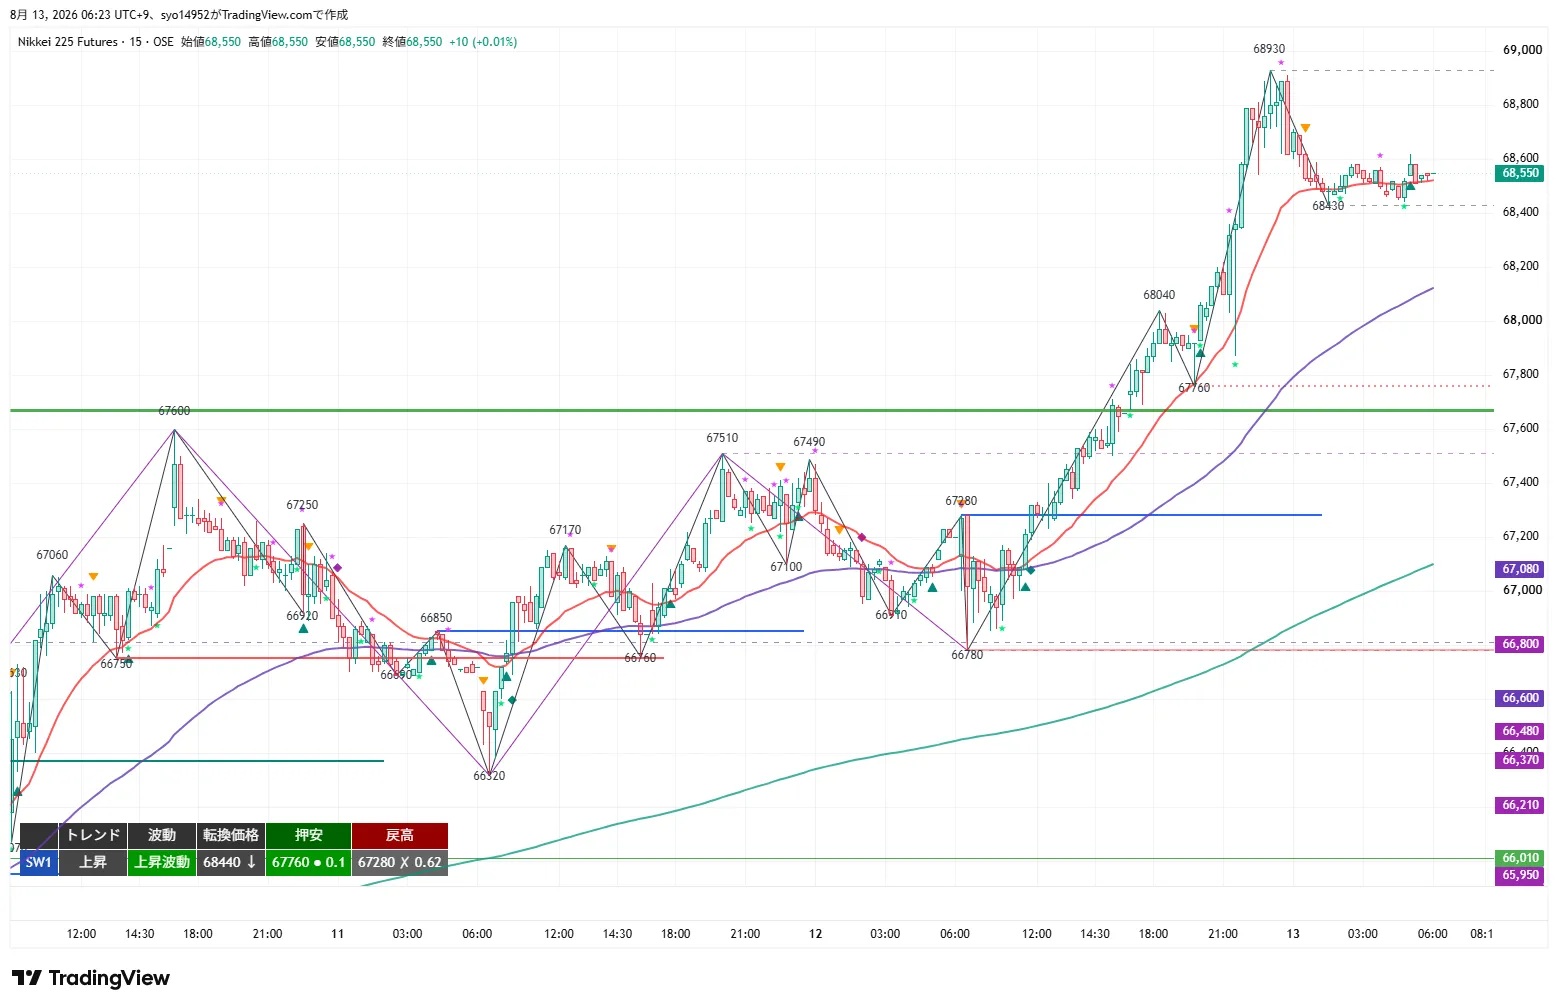
The 15m chart shows an uptrend and upward waves. The conversion price is 68,440, with a breakout above 67,760 (swing high) already achieved. The price extended from 66,780 to 67,280, 67,760, 68,040, reaching 68,930 and pulling back to 68,430 before closing at 68,550. The 20EMA (around 68,450) is positively sloped, with the price above it; the 320EMA (4H 20EMA equivalent around 67,100) is markedly below, indicating a strong upward alignment.
From an execution perspective, a close above 68,930 signals a new-high chase; a pullback to 68,040–68,430 that forms a rebound pattern would be a buying opportunity. If closed below 68,430, the pullback would break the retracement support, shifting to a selling mode. After a rapid rise, the 20EMA drift can widen, making pullbacks quicker; thus, risk protection should be tightened.
MTF State
- 4H: Up / Upward wave. Closed above the retracement high 67,670, reached 68,930, and closed at 68,550 with a +0.04% gain. Conversion 66,780; pullback support 64,680; retrace high 67,670 (X). 20EMA rising; price above it.
- 1H: Up / Upward wave. Broke 67,490, 67,600, 67,670 in sequence to 68,930. Conversion 68,430; pullback support 66,780; retrace high 66,370 (X). MAs rising; price above them.
- 15m: Up / Upward wave. Extended to 68,930, pulled back to 68,430, close at 68,550. Conversion 68,440; pullback support 67,760; retrace high 67,280 (X). 20EMA positive slope; price above it.
- Consistency: All three timeframes are in uptrends and upward waves with MA bands rising. The primary approach is a trend-following long on pullbacks / breakouts; selling targets the downside only if the uptrend fails, limited to above recent highs. The 15m 20EMA and 1H MA bands can support pullback zones but are not used as break criteria.
Important Prices
- 73,760 JPY: Daily retrace high. Uppermost target (for reference).
- 72,590 JPY: Higher daily pivot (for reference).
- 70,900 JPY: Upper pivot.
- 70,520 JPY: July high. i) T2, ii) T2 / iii) full retreat.
- 69,510 JPY: July retrace high. i) T1, ii) T2 / resistance zone 2 upper bound.
- 69,350 JPY: Upper pivot. Lower bound of resistance zone 2.
- 69,100 JPY: Upper price pivot. Upper bound of resistance zone 1.
- 68,930 JPY: 8/13 night high. i) Trigger / core; ii) T1 / core; iii) lower bound of resistance zone 1; iv) full retreat.
- 68,810 JPY: Daily pivot. Already broken upward and now acting as support.
- 68,550 JPY: Current price / night close.
- 68,450 JPY: 15m 20EMA vicinity.
- 68,440 JPY: 15m conversion price.
- 68,430 JPY: 1H conversion price; 8/13 night low (recent reversal point). Upper bound of pullback zone 1 / core / trigger.
- 68,040 JPY: Upward pivot. Lower bound of pullback zone 1 / iT1.
- 67,760 JPY: 15m pullback low. Upper bound of pullback zone 2 / iT2 / iT1 / full retreat.
- 67,670 JPY: 4H old retrace high (X = breakout done) = support turned. Lower bound of pullback zone 2 / core core.
- 67,300 JPY: 1H 80EMA (4H 20EMA equivalent) vicinity.
- 67,100 JPY: 15m 320EMA (4H 20EMA equivalent).
- 66,780 JPY: 1H/4H pullback low / 4H conversion price. ii) full retreat; iii) T2; iv) T2.
Trading Ideas
① Breakout Follow-Through (Long)
- Trigger: Break above 68,930 (8/13 night high) on 15m close (new high pursuit).
- Early entry price: 68,930. After breakout, pullback near breakout price or near the sloped 20MA on short-term charts (1m, 5m) for a first entry (back entry; RR based on breakout price).
- Main entry price: 68,930 recovered on 1H close = core entry (dual-layer setup).
- Stop/Invalidation: early leg below 68,630; core below 68,430. Complete retreat below 67,760.
- Targets: 69,510 (partial take + base), 70,520.
- RR: T1 (69,510) = 1.9 / T2 (70,520) = 5.3.
- MFE protection: exit at +200 offset to base or small profit, or +300 to secure at least +100 or trail. Given rapid post-breakout moves, protect early.
② Pullback Buy (Long)
- Standard condition: pull back to 68,040–68,430 (upward pivot to 1H conversion price = reversal point) and confirm rebound on 15m close. The zone around 68,430–68,350 has overlapping 20EMA to facilitate rebound. Deep pullbacks around 67,670–67,760 (breakout wall turned support) would use a stop at 67,370.
- Early entry price: 68,350. After rebound confirmation on 15m close, confirm price is above rising 20MA and enter early.
- Main entry price: 68,930 (recent high) recovered on 1H close = core entry. Since targets align with T1, partial take + base move executed for early entry; if 1H close recovery is confirmed on the same timeframe, add more core positions.
- Stop/Invalidation: early leg below 68,050; core below 67,760. Complete retreat below 66,780 (switch to iii).
- Targets: 68,930 (partial take + base), 69,510 / 70,520.
- RR: T1 (68,930) = 1.9 / T2 (69,510) = 3.9.
- MFE protection: exit at +200 to base or small profit, or +300 to secure at least +100 or trail. Do not rely on zone beyond reference MA bands; zone is based on reversal points and MA bands serve as backing, not break criteria.
③ Return Selling (Short)
- Standard condition: price trades 68,930–69,100 (night high to upper pivot). Confirm on 15m close that price cannot close above 68,930 and stalls. Zone 2 would adjust to 69,350–69,510 (set stop at 69,610 in this case).
- Early entry price: 68,980. After stall confirmation on 15m close, measure around recent highs using small timeframes (1m, 5m) for early entry (avoid aggressive entries above rising 20MA). Early position should be immediately above the most recent high with stop above the zone.
- Main entry price: 68,430 (reversal point) break on 1H close = core entry, i.e., core short.
- Stop/Invalidation: early leg recovered to 69,280; core recovered to 68,930. Complete retreat above 70,520.
- Targets: 68,040 (partial take + base), 67,760 / 66,780.
- RR: T1 (68,040) = 3.1 / T2 (67,760) = 4.1.
- MFE protection: exit at +200 to base or minor profit, or +300 to secure at least +100 or trail. Do not place sells below established levels. As all timeframes are in uptrend, avoid chasing; if trigger confirmed to reach T1, skip if necessary.
④ Breakout Follow-Through (Short)
- Trigger: Break below 68,430 (1H conversion price; night low = 68,930) that supports the upward move, breaking the recent rise;
- Early entry price: 68,430. After break, pullback toward breakout price or rising 20MA vicinity on short timeframes (1m, 5m) for early entry (back entry; RR based on breakout price).
- Main entry price: 67,670 (4H wall that was broken; support turned) break on 1H close = core entry, negating the breakout and going core.
- Stop/Invalidation: early leg recovers to 68,780; core recovers to 68,430. Complete retreat to 68,930.
- Targets: 67,760 (partial take + base), 66,780.
- RR: T1 (67,760) = 1.9 / T2 (66,780) = 4.7. 68,040 has RR near 1.1, thus not chosen for T1.
- MFE protection: exit at +200 to base or minor profit, or +300 to secure at least +100 or trail. Do not use MA bands as break criteria. As all timeframes are rising, core entry should only be taken after a clear close below to confirm end of upward movement.
Current Actions
- Most important Line 1: 68,930. 8/13 night high. A close above this line triggers a breakout-following long (early 68,930; core becomes equivalent to the same-value 1H close recovery). If price cannot close above and instead stalls, this indicates a trend continuation failure, and the plan shifts to a pullback sell (early 68,980). The first structural resistance is 69,510 (July retrace high).
- Most important Line 2: 68,040–68,430. Upward pivot to 1H conversion price (reversal point). The band where 15m 20EMA overlaps suggests a rebound is likely; rebounds imply pullback buying (early 68,350). A break below 68,430 triggers the ④ trigger (early 68,430), and a break below 67,670 negates the breakout.
Entry price, trigger, and stop are set based on the chart shape at the time of close (conversion prices, swing highs/lows, and retracement highs on each timeframe). If the structure changes over time, unless the higher timeframe structure changes, entry prices on lower timeframes (e.g., 15m) will be adjusted to reflect the price levels that more accurately reflect the actual structure, choosing the more accurate value against the initially set one.
※This report is for information purposes only and is not investment advice; please make trading decisions at your own risk.