

Is the pivot point special — compared with fake pivot points
My name is Tono-chi, developing EA. Up to now I have analyzed various methods I had been curious about but overlooked, using the power of AI, adopting good ones into EA, and presenting those that I judged could not yield an edge in this format. This time is one such instance.
Topic isPivot. A support/resistance line that doesn’t require computation and is determined today’s pivot points (R1, S1, S2, etc.) solely from yesterday’s high, low, and close. Since anyone would draw the same lines, it is known as a tool easy to use for both discretionary trading and EAs.
First, the conclusion.With my method, using pivot levels to make trading decisions did not yield an edge.And the main point this time is,“Compared to fake pivot levels, I found that the effective element has a different identity.”.
Furthermore, one more thing.During this validation, another byproduct turned out to be quite successful. It turned out to be practically usable, so I will implement it in my EA “Tonochi FX”(§6). I measured famous techniques like Fibonacci, Elliott Wave, Gold Cross one after another, butthis time is the first where I found material to improve the EA. Even in tests that ended in a miss, there was value in doing them.
1. Pivot calculation
From yesterday’s high H, low L, and close C, it is decided as follows.
``P = (H + L + C) ÷ 3 … Center
R1 = 2P − L S1 = 2P − HR2 = P + (H − L) S2 = P − (H − L)R3 = H + 2(P − L) S3 = L − 2(H − P)``
There are two ways to use it.Buy on support, sell on resistance (counter-trend)orIf broken, ride the breakout (trend-following).
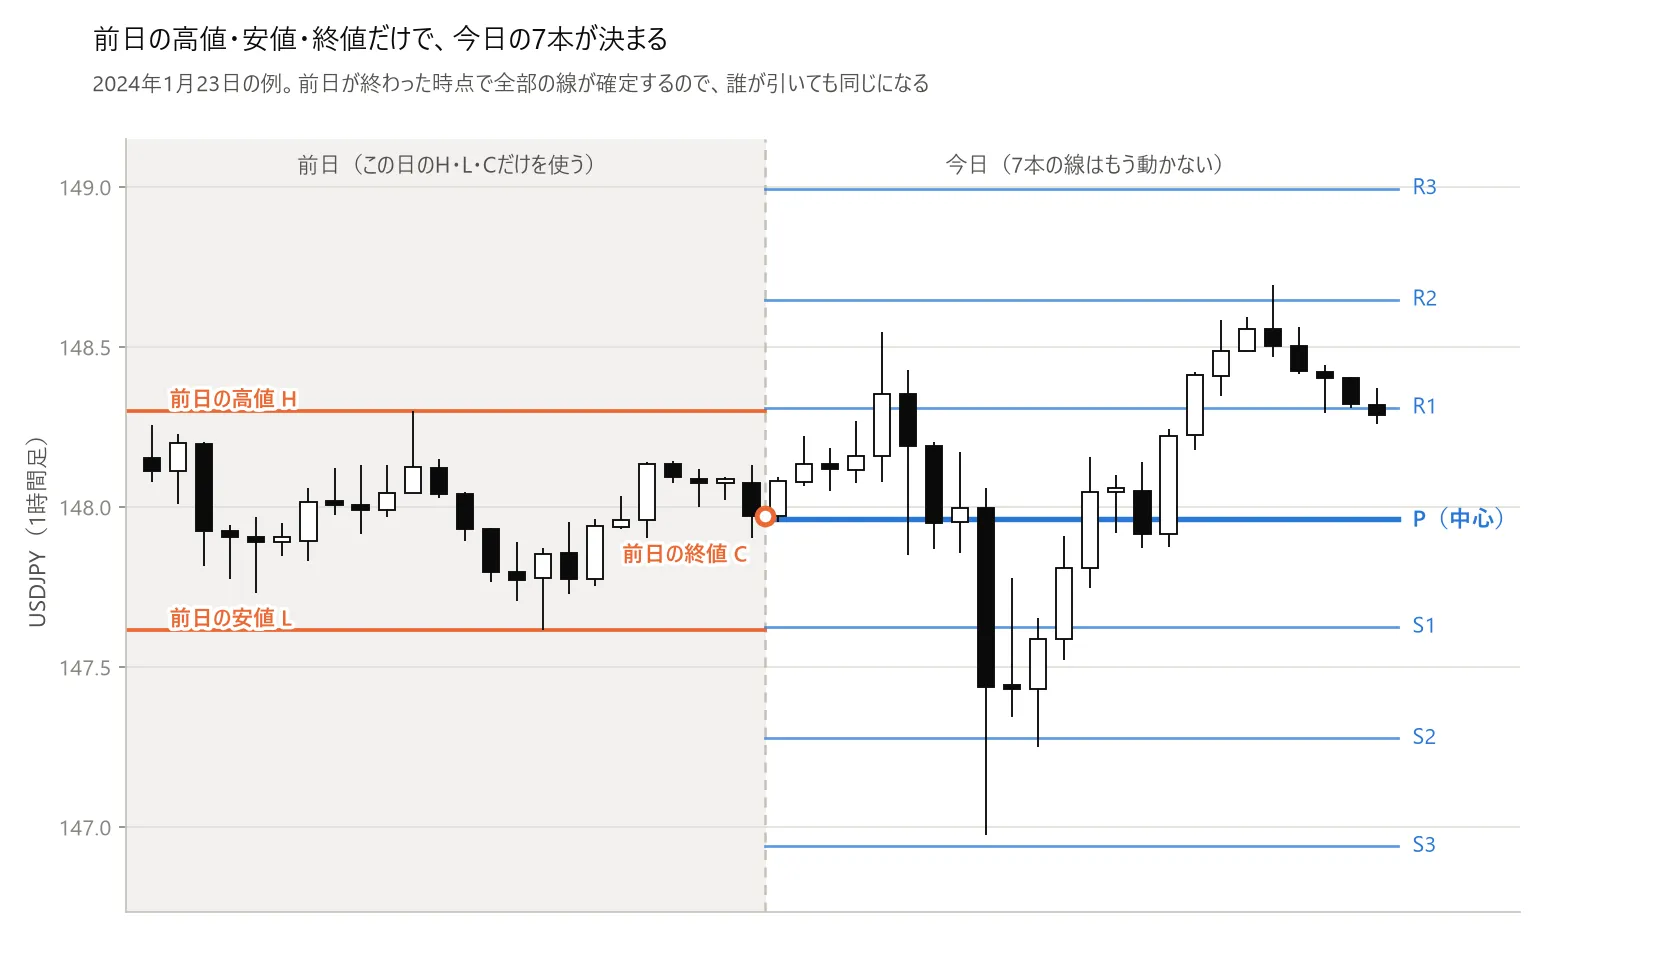
▲ Figure 1: USD/JPY hourly. Left half is yesterday, with marks on today’s high H, low L, and close C. Right half is today, with seven horizontal lines drawn from the H, L, C: P (center) and R1, R2, R3, S1, S2, S3. Lines are fixed at the end of yesterday and do not move during the day.
2. Trying straightforwardly — 1,680 cases
Because results vary by how you place stop-loss and take profit, I ran a full grid including entry and exit. 6 levels × 2 usage × 4 stop-losses × 5 take-profits × 7 currencies =1,680 cases.
| Usage | Profitable combinations | All three periods profitable |
|---|---|---|
| Counter-trend | 287 / 840 (34.2%) | 110 |
| Trend-following | 26 / 840 (3.1%) | 1 |
The average across the 1,680 cases was−2.77 pips per trade. The average by level, for both counter-trend and trend-following, wasnegative for all 6 levels (S1 −0.43 / S2 −1.36 / S3 −1.74 / R1 −1.15 / R2 −0.94 / R3 −0.45 for counter-trend).
The better-performing combinations tended to cluster,in the form of counter-trend at the furthest outer S3 and R3, placing wider stop-loss and smaller take-profit (about 88% win rate). However, this is a pattern of “catching a rebound after a big move,” and not necessarily due to pivot calculation formulas.
3. Validation conditions
- Currencies: EURUSD, USDJPY, GBPUSD, USDCHF, AUDUSD, NZDUSD, USDCAD
- Period: 2000–2026 (26 years) / Timeframe: 15-minute bars
- Costs: deduct 1.2 pips per trade
- Settlement: judge whether stop-loss or take-profit was reached first by the order of wicks. If same bar, priority to stop-loss (disadvantageous side)
- Zero-foreknowledge: only use today’s level calculated after the previous day closes
4. Compare with fake pivot levels
If R1 or S1 are meaningful lines,the performance should be better than the “meaningless” lines that are similarly distant. Therefore I created fakes by scaling the distance from the previous close of each level with a factor k and compared under the same conditions.k=1.0 is the genuine pivot.
| k | 0.50 | 0.70 | 0.85 | 1.00 (real) | 1.20 | 1.50 | 2.00 |
|---|---|---|---|---|---|---|---|
| pips/trade | +0.41 | +0.60 | +0.76 | +0.72 | +0.69 | +0.05 | +0.42 |
No mountain appeared.The best was not the real pivot, but 0.85 times. Looking at each level,only one out of six was best with the real pivot.
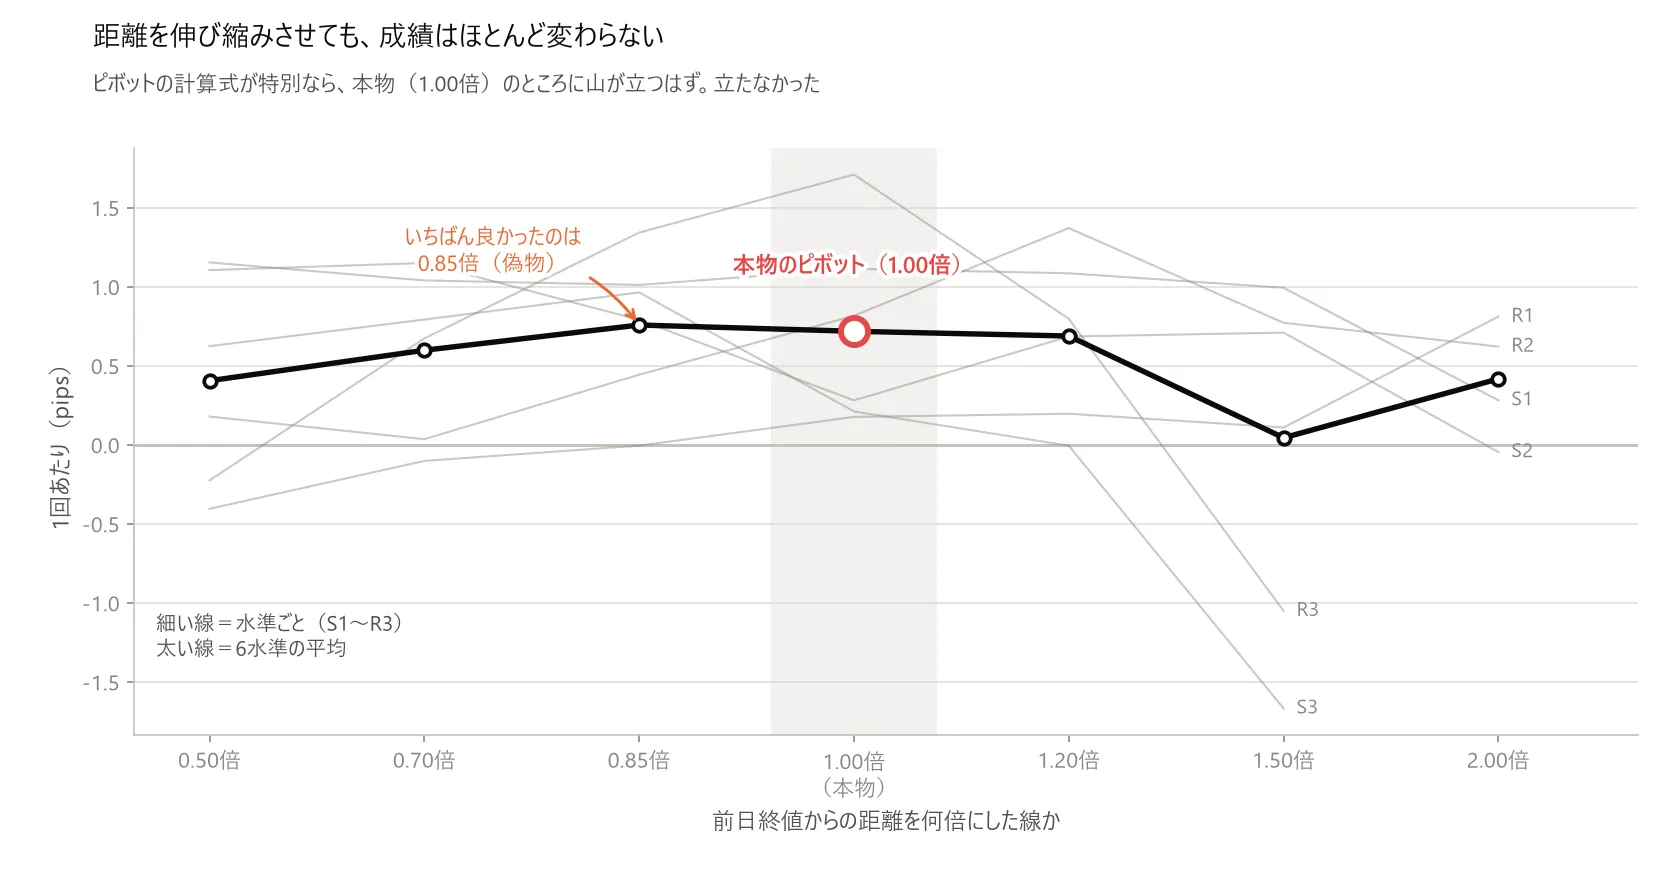
▲ Figure 2: Horizontal axis shows how many times the distance from the previous close is multiplied (0.50x to 2.00x), vertical axis shows average pips per trade. The thinner lines are per level, the thicker line is the average of 6 levels. The average line at 0.85x is +0.76, at 1.00x (the real pivot) is +0.72, and there is almost no peak at the real pivot.
What my validation shows is thatthe specialness was not in the formulas “R1” or “S1,” but in how far away from the previous close the price moved. In earlier Fibonacci testing with the same method, it was not ratios but the depth of retracement that mattered.Neither ratios nor levels held meaning in famous numbers themselves.
(The numbers in this section look positive because they are aligned to the best-performing exit patterns in section ②. I apply the same conditions to both real and fake pivots for a fair comparison, but absolute values tilt toward the better side.)
5. Can it be used as a filter?
I also tested “buy above P, sell below P” style usage. Fixed entry and exit,only the entering signal changes (1-hour chart / RSI(14) breaks above 30 to buy, below 70 to sell / exit after 24 bars / no filter yields −0.49 pips per trade).
Result:this filter did not work as a selector. Because the entry nature predetermined the outcome from the start.
| Entry type | Pass rate when buying above P |
|---|---|
| Buy the dip (RSI(14) breaks above 30) | 0.6%(almost all fail) |
| Buy the pullback in an uptrend (RSI(14) dips below 60 to buy) | 94.0%(almost all pass) |
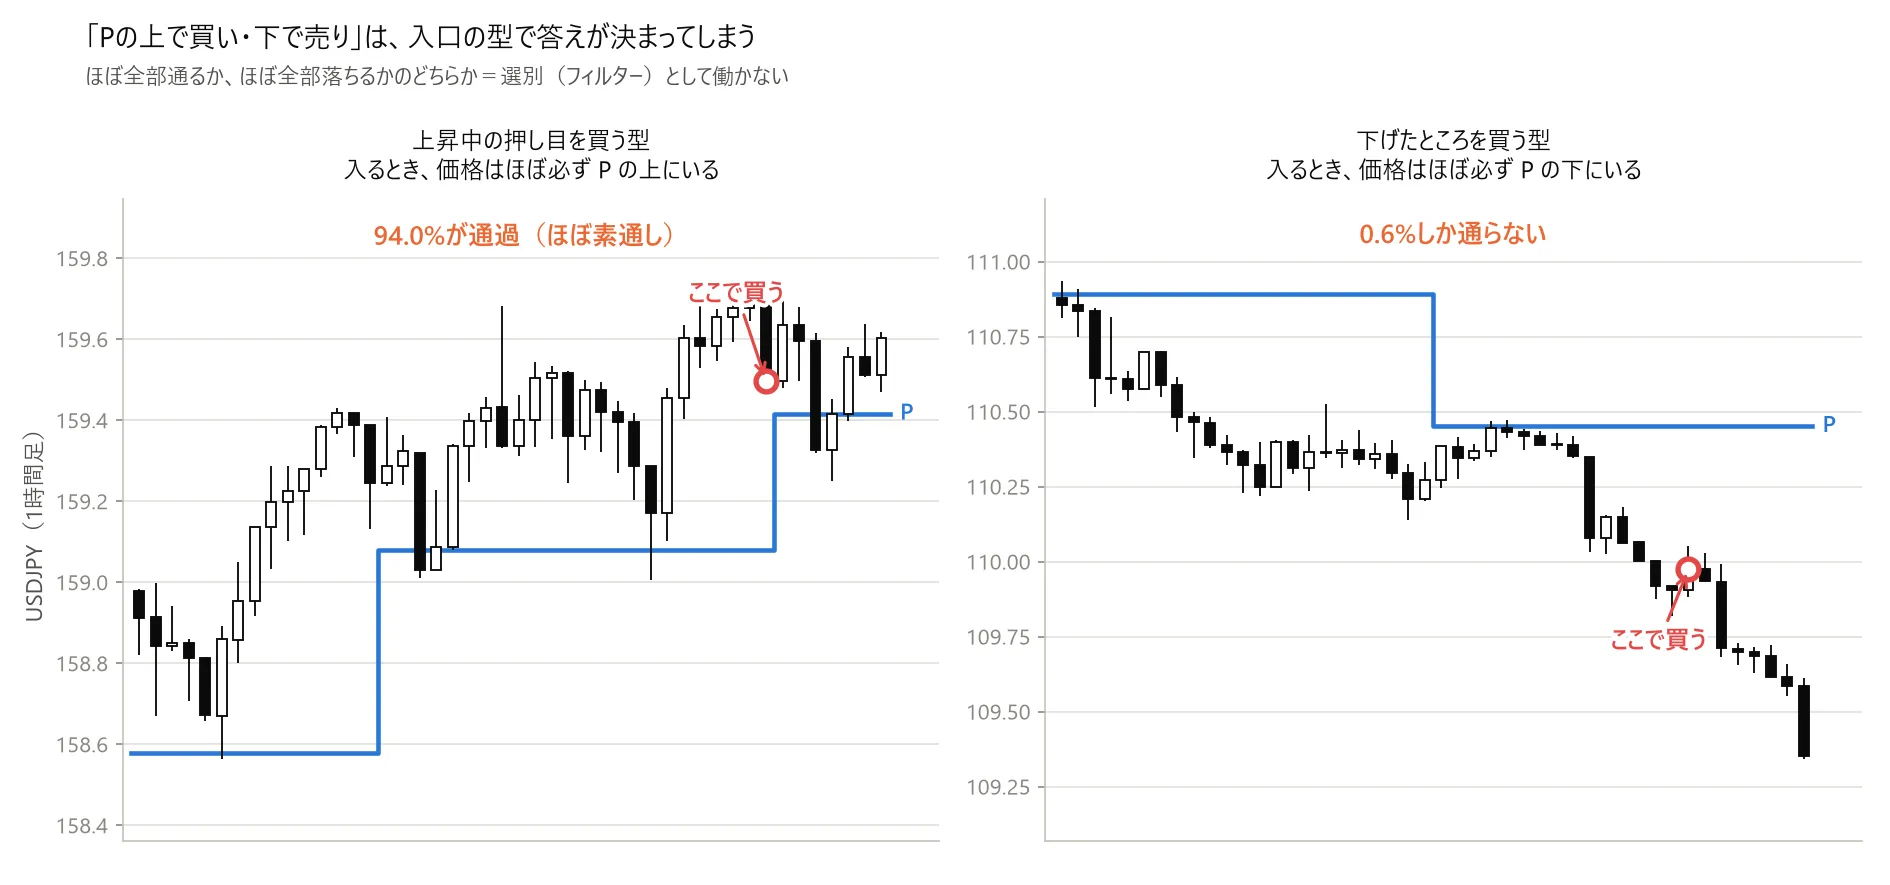
▲ Figure 3: Two panels of the USD/JPY hourly chart. Left shows buying the pullback in an uptrend; buy area is above the blue center P line, 94.0% passes. Right shows buying the dip; buy area is far below the P line, only 0.6% passes. P changes day by day, drawn as a staircase line.
Trying to only pass “S1–R1 outside” showed −0.49 → +0.46 pips/trade improvement, but divide into three eras, two eras were negative. It did not meet my criteria.
6. A byproduct of the miss turned into a material for improving the EA
While studying pivots,I found one factor that showed a clear difference in performance from pivot calculations, but from a completely different angle. It was a condition measured horizontally, unrelated to the pivot formula.
When I found it, I initially thought it would be a common fake.An improvement that looked good on its own disappeared when embedded in the EA. So I repeated the usual procedure: ① does it look the same across different currencies and eras? ② is it just a coincidence? ③ finally,embed it into the EA and compare with/without it after aligning the drawdown to the same level.
The result clearly passed my criteria.Since it is actually usable, I will implement it in Tonochi FX.
And for me, this is the biggest part.In this series that tests famous methods from Fibonacci to Elliott Wave to Gold Cross, discovering material to improve my EA is the first time this happened.Until now, all of them ended with “I could not gain an edge in my tests.” After all the misses, I finally found one.
I will keep the contents confidential.When I started writing, I intended to publish to the end, but since this will be part of a product, I will not disclose the contents of the product or the exact definitions and effect magnitudes. The performance numbers will be disclosed after conducting a fresh backtest for publication.
What I want to convey is not the numbers, but thata miss in testing still has value. Compared to the pivot that didn’t work, the things I accidentally found along the way were more significant.This is how I continue to refine my EA daily.
7. Limits of this validation
- I tested one of countless possible usages (simple buy/sell signals and direction judgment)
- Pivot values change at the “previous day” boundary. Shifting the boundary by one hour slightly moves the numbers (I confirmed conclusions did not change)
- Rather than the original “place limit orders at the level,” calculations assume entry occurred at the close of the touched bar
8. Summary
As a straightforward buy/sell signal, I could not find stable edge anywhere among 1,680 cases, and even compared to fake pivots, there was no peak at the real pivot. The “above/below P” filter did not work because the entry nature predetermined the outcome.
This ismy measurement. I am not denying those who obtain results with pivots. I just don’t want to use famous numbers without confirming them with my own data.
There are two takeaways. One is thatthe method of comparing with a fake yielded the same answer as Fibonacci. It’s not the famous numbers themselves, but the underlyingdistance and depththat matter. When I see the next famous level’s technique, I will first create a fake to compare.
The other takeaway isthe byproduct I found during validation became the first material for improving Tonochi FX. It wasn’t targeted; I ran exhaustive tests in anticipation of misses and noticed it lying horizontally. So I measure various methods, continuing to refine my EA daily.
Validation conditions: 7 currencies (EURUSD, USDJPY, GBPUSD, USDCHF, AUDUSD, NZDUSD, USDCAD) / 2000–2026 / 15-minute bars (§5 uses 1-hour) / trading cost 1.2 pips per trade / zero foreknowledge.