

Does the Golden Cross and Dead Cross work? A story where after trying 1,631 methods, only one use was found
I am Tonochi, working on EA development. I have been analyzing various methods I had been curious about but overlooked by leveraging AI, incorporating the good ones into EA, and presenting those I judged did not yield an edge in this format. This time is one such work.
The subject isGolden Cross and Dead Cross. The short-term moving average crossing the long-term from below is a buy (Golden Cross), crossing from above is a sell (Dead Cross)—probably the most famous trading signal in the world. It appears at the very beginning of beginner books and news.
What happens if we have a machine verify this?We tested all combinations of 1,631 pairs of short-term and long-term, across 4 timeframes, 7 currencies, for 26 years in total.
I will write the conclusion first.With my method of measurement, as long as you use the Golden Cross and Dead Cross as an “entry signal,” you cannot achieve an edge.In 15-minute charts, there wereno profitable combinationsat all.
However, this did not end the story.When you use the same lines not as a “signal” but as “environment recognition” (to confirm whether the market is currently in an uptrend or downtrend), the results changed. I will focus on that instead of concluding with a negative.
1. First, try honestly — brute force of 1,631 combinations
I kept the method as simple as possible.
- If the short-term line is above the long-term line, buy; if below, sell. Hold until the opposite cross occurs
- Short-term from 2 to 100, long-term from 5 to 400, combined into1,631 combinations
- Four timeframes: 15-min, 1-hour, 4-hour, daily
- The 7 major USD-related currencies, from 2000 to this year (26 years)
- Subtract trading costs of 1.2 pips per trade (the actual effective spread measured)
I set the settlement to “until the opposite cross” because in a previous studytrend following tends to perform worse as you rush settlements. If an odd settlement is inserted here, you would measure the quality of settlements rather than the quality of crosses.
Results.The share of combinations that remained profitable after costs by timeframe.
| Timeframe | Profitable combinations |
|---|---|
| 15-minute | 0.0%(all 1,631 combinations were unprofitable) |
| 1-hour | 0.9% |
| 4-hour | 32.3% |
| Daily | 88.0% |
The 15-minute timeframe was a complete bust. Moreover,the losses existed before costs were even subtracted. With shorter timeframes, the lines move closer or apart repeatedly, fooling you each time. It’s the classic “two-way beating” reflected in the numbers.
Also important is the reason why improving results appears when you move up the timeframe. It’s not because the skill improved; it’s because trading frequency dropped sharply and total costs fell. With the typical 15-minute setting, one currency trades over 1,400 times a year, which alone adds around 1,700 pips of annual costs. Daily charts would involve only a few trades per year.
2. Are famous numbers truly special?
What I wondered here was,“Why 5 and 25? Why 50 and 200?”. If there is a reason, the performance should be better around those numbers. If 5 and 25 are special, 6 and 26 or 4 and 24 should stand out as well.
So I measured like this:
Subtract the average of the neighboring 8 cells from the performance of the cell. This leaves only whether it sticks out relative to its surroundings. It’s the same logic as comparing a drug against placebo in a trial.
The results were that,in all four timeframes, the famous combinations did not stand out compared to nearby cells(the probability of being randomly better was 66–82%).
The most extreme example was the most famous daily chart,50/200.
Rank 1,631: 1,589
It was nearly the worst. It happened to align with a dip in the waveform by chance.
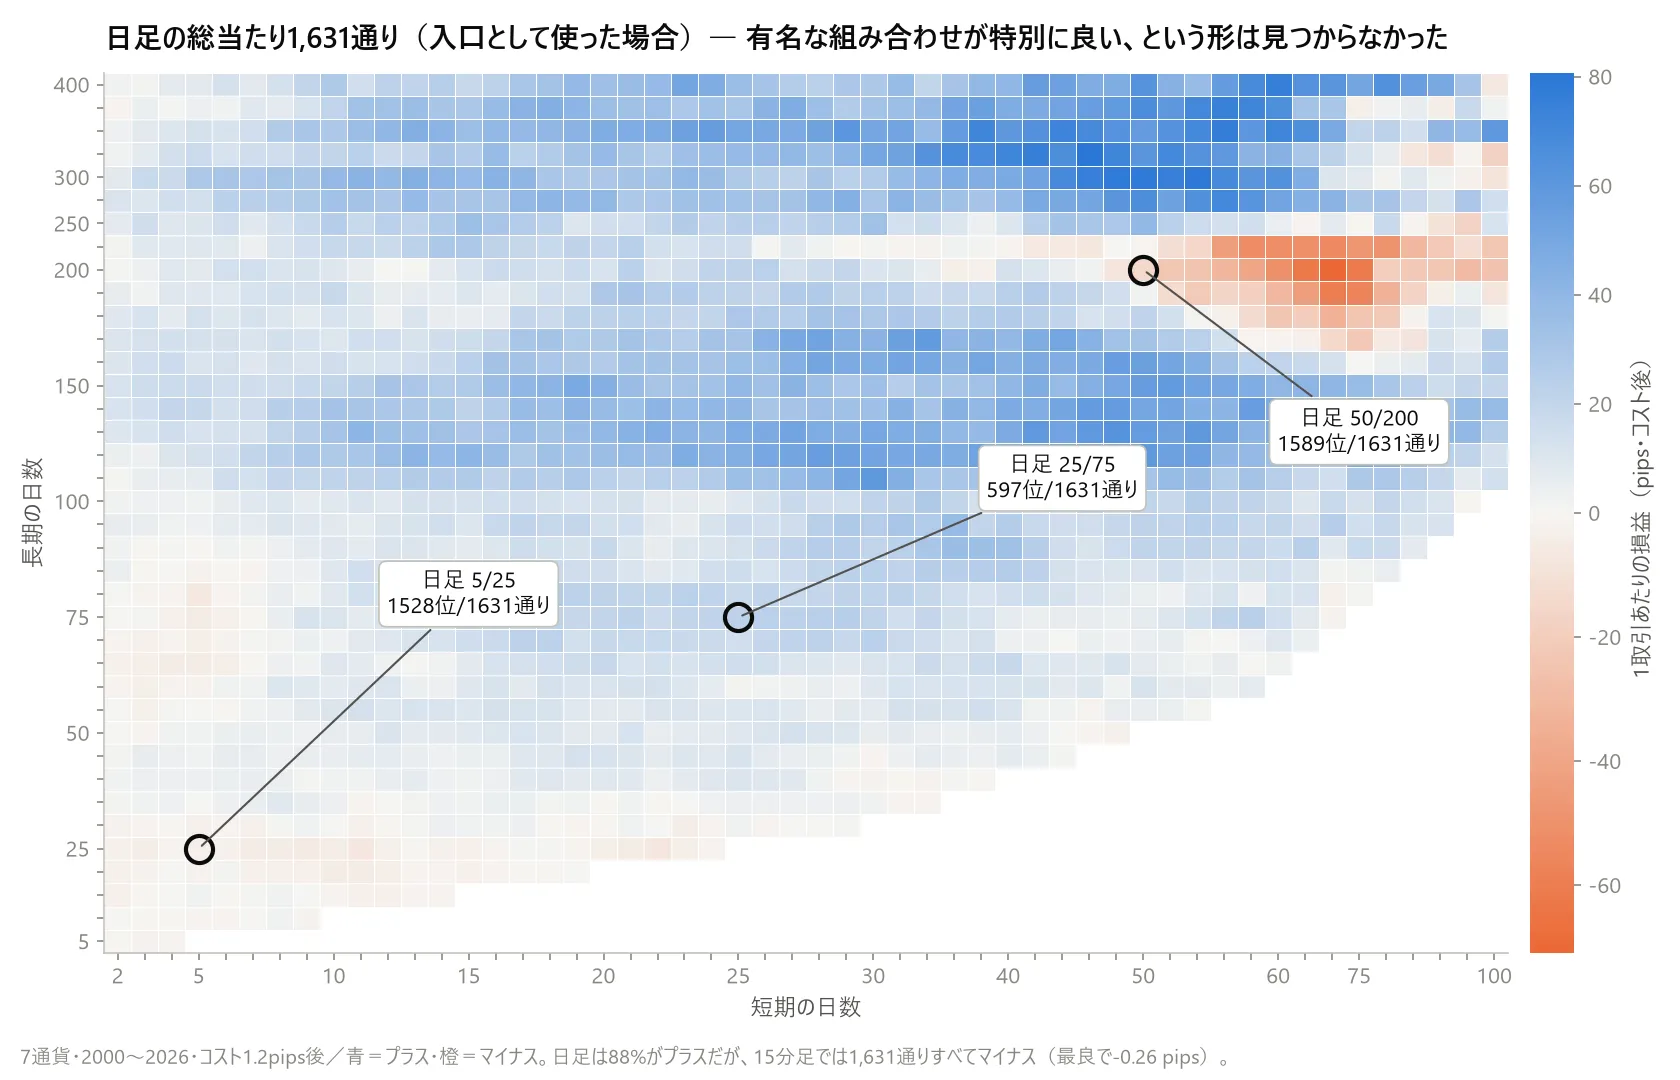
▲ Figure 1: A chart of the 1,631 daily combinations, colored by profit per trade, blue for profit, orange for loss, using the daily entry as the gateway. The famous daily 50/200 sits at rank 1,589, with no improvement over the surroundings.
This does not mean “50/200 is bad”; it suggests that the fame comes from historical reasons rather than the numbers being specially chosen. In practice, the waveform was overall smooth, with no sharp peaks anywhere.
3. Suspecting promising combinations with two methods
Daily charts showed 88% profitable. Some combinations yielded up to +80 pips per trade. This seemed usable.
Jumping in here usually fails.Out of 1,631 combinations, some look good even if they lack substance. I used two methods to cast doubt, and also include results when changing the moving average types.
① Shifting the direction of trades
Keep the buy/sell sequence as is,but shift it entirely in time direction, deliberately breaking the alignment with price moves. Create 200 versions and see how high the genuine performance ranks among them.
When tried,the shifted versions had annualized variance of 70–85 pips. Subpar ideas still move about ±80 pips per year. A daily-chart finding like “+150 pips per year” falls within this range.
② Split the era into three periods
Divide into 2000–2008, 2009–2017, and 2018 onward, and see if it works across all periods.
Most combinations that rose to the top earned in the first period, and were negative in the most recent 8 years. Even if the past 26 years look good on average, anything negative in the most recent period cannot be used.
Reference: What happens when moving average types change
Moving averages include simple average (SMA), more responsive (EMA), and a middle option (WMA). People often say “EMA is more responsive and better.” So far, all testing used SMA; here are results for the other two as well.
Compared on daily 50/200, the results per currency per year were:
| Line type | Performance |
|---|---|
| Simple average (SMA) | −24 |
| Exponential smoothing (EMA) | +10 |
| Weighted average (WMA) | +37 |
Even with the same 50/200, changing the line type caused this much difference. However, whether this difference is genuine cannot be determined without the same checks as (①) and (②). For now, SMA is taken as standard, but I leave recorded notes that “EMA would be like this, WMA would be like that.”
4. The control group — what should you really compare against
To judge whether you can win, you need a comparison. I prepared two baselines.
Just buying and holding: almost zero over 26 years (average −400 pips across 7 currencies). Forex, unlike stocks, does not grow merely by holding.
Breakouts of new highs(buy when price breaks a high, sell when it breaks a low). Classic trend following: this also lost against crosses in all timeframes. Even the best settings yield only about +18 to +66 pips per currency per year.
In short,crosses are not inferior to breakouts. Simple trend following remains uniformly weak, even when reframed.
5. Change of perspective — use it for environment recognition, not as a signal
So far this whole discussion has been about “enter on cross.”
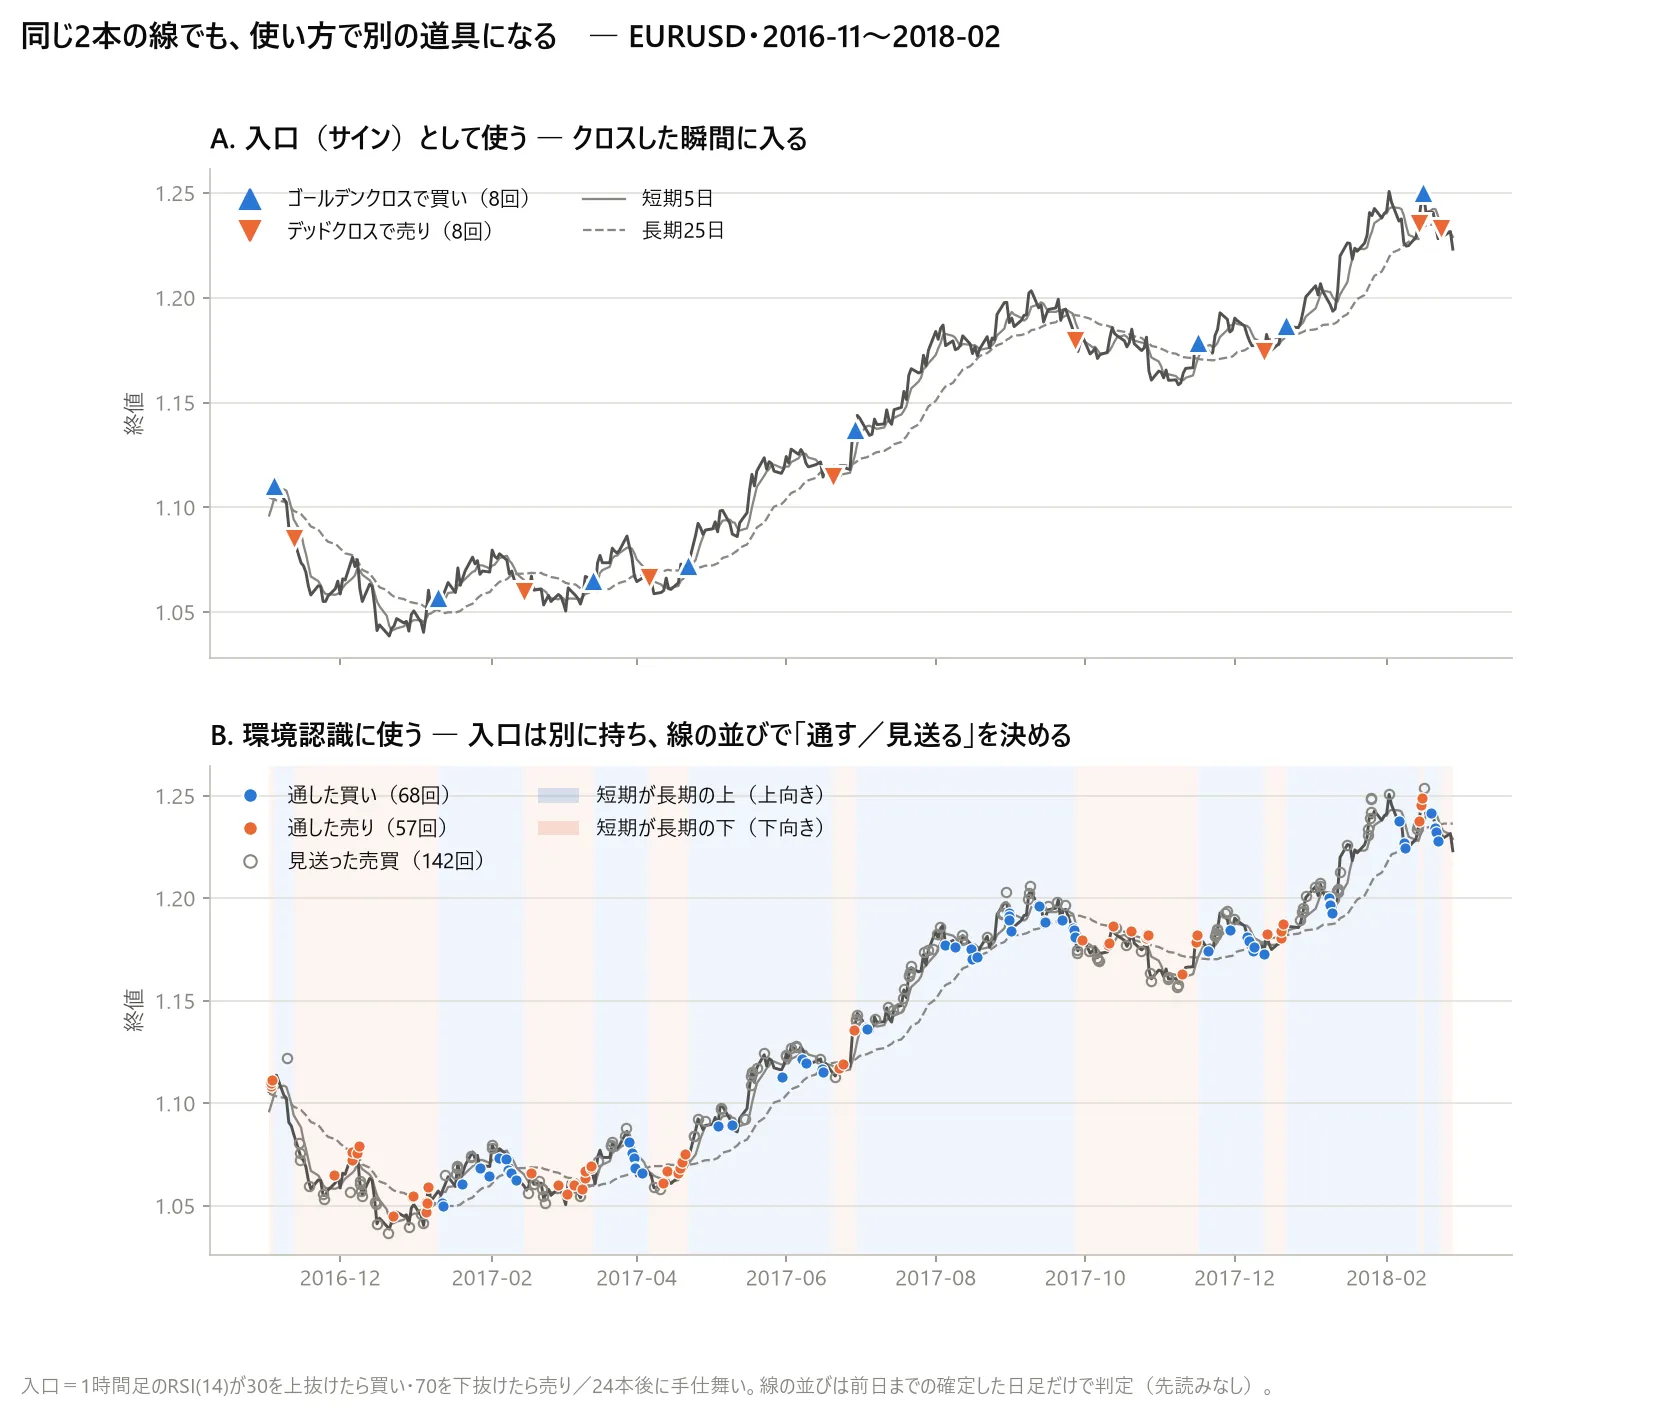
Then I realized,I don’t actually enter on crosses. Looking at charts, moving-average orders are used to confirm up or down trends. The trigger to enter is sought elsewhere.
Soit should be evaluated with that usage. The setup became as follows.
- Entry trigger= On the 1-hour chart, an RSI indicator (14) returning from overbought/oversold levels—buy when it bounces back from oversold, sell when it bounces back from overbought (classic counter-trend from the textbook)
- Exit= Close after 24 bars (about one day on the 1-hour chart). No stop loss or take profit placed
- Add the daily moving-average cross. Only take buys when the cross is upward (short-term above long-term), and only sells when downward
Fix the entry trigger and exit,and vary only which trades are accepted by the cross as a form of environment recognition. This isolates the effect of the cross itself.
| Environment recognition condition | Pass rate | Per trade |
|---|---|---|
| None (take all) | 100% | −0.46 |
| Daily 5/25 same direction only | 46% | +1.09 |
| Daily 10/100 same direction only | 48% | |
| Daily 25/75 same direction only | 49% | |
| Daily 50/200 same direction only | 50% |
Using only the RSI counter-trend yields a negative after costs (−0.46). When restricting to the daily 5/25 cross direction, it becomes +1.09.
Key takeaway is not simply reducing trades by half, but proving that random pruning does not outperform the real method. I generated 300 random prune cases and compared; not a single one surpassed the genuine approach. The reduction in quantity alone does not explain the improvement.
Furthermore,the 5/25 method was profitable across all three time eras, with 5 of 7 currencies showing gains.
On the other hand, the famous daily 50/200 did not improve(−0.29, within the realm of chance).Fame does not guarantee better results; outcomes depend on the specific combination.
6. Used in the opposite way, it truly gets worse
I also verified another aspect.What happens if you only take crosses and the “opposite direction” trades?
| Environment recognition condition | Only same direction | Only opposite direction |
|---|---|---|
| Daily 5/25 | +1.09 | −1.78 |
| Daily 10/100 | ||
| Daily 25/75 |
It reverses cleanly.
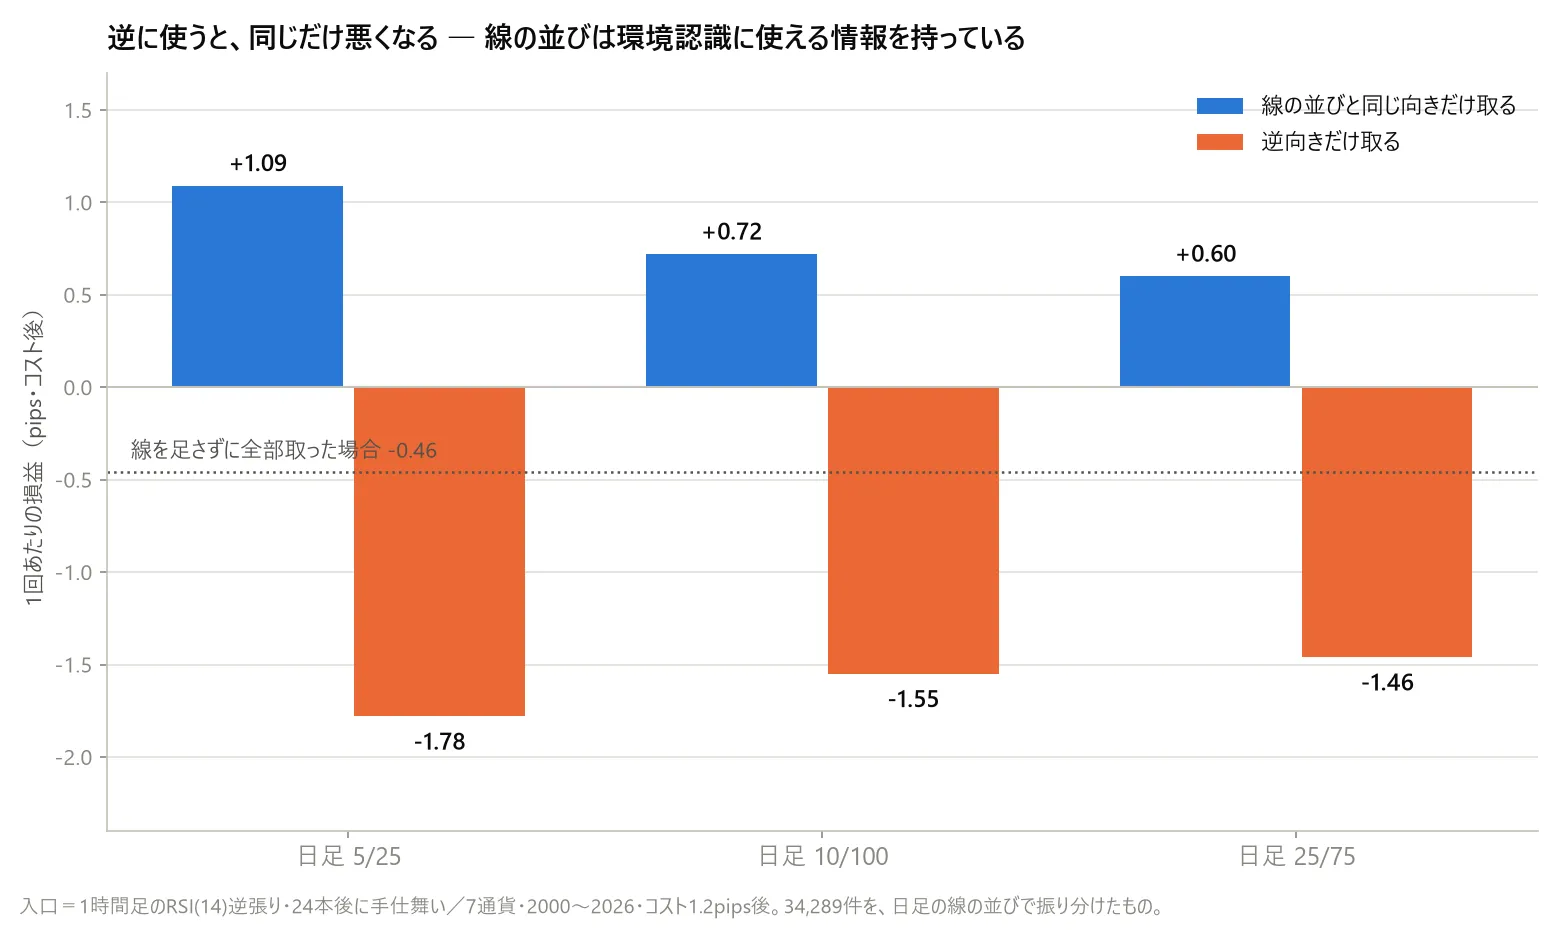
This result was the most satisfying to me. If the moving-average order carries no information, restricting to the same or to the opposite direction should not change performance. In practice, there is a difference of about 2–3 pips per trade between same and opposite directions.The line order indeed contains information usable for environment recognition. However, with my method, it could not be used as an entry trigger.
From this study I take two main conclusions.
7. The limits of this study (this is important)
This is not an evaluation of the Golden Cross method itself. It is the result of the various measurement approaches I tried. I did not alter the following conditions.
- Settlement rules: Only “hold until the opposite cross” was used. No stop loss, take profit, or risk protection rules. Many real users have some settlement rules, which would change the results if varied
- Entry method: Entered at the close of the bar on which the cross appeared. No common refinements like “wait for a pullback after cross” or “check volume” were included
- Targets: Only major USD currencies. Stocks or indices were not considered.Stock daily 50/200 assumes a rising asset, so it cannot be directly applied to Forex, so Forex results cannot be taken as-is
- Costs: Fixed at 1.2 pips per trade. If your broker offers better conditions, the minute details may improve
- General validation after §5: Entry trigger, exit, and timeframes are the ones I defined
This last point I’ll be frank about: in §5, “it worked” means about1 pips per trade. If costs are a bit higher than assumed here, this disappears.
In short, what can be said is thatthis measurement method failed to find an edge as a signal, but showed improvement when used as environment recognition. It does not negate users of the method.
8. Summary
- Short-term × long-term brute-forced across 1,631 combinations;as a signal, my method could not yield an edge (15-minute chart failed entirely)
- Did not find any evidence that famous combinations outperform others. The most famous daily 50/200 ranked 1,589th out of 1,631
- Promising daily-chart combos disappeared when tested with shifting and era-splitting, including the line-type changes.
- On the other hand,using the same line for environment recognition improved results (−0.46 → +1.09).Using in the opposite direction worsened just as much.
- However, all of this isbased on my measurement approach; changing settlement or entry methods could yield different results
The takeaway is not that “famous methods don’t work” but that“using an entry vs. environment recognition makes them behave like completely different tools”. This duality was the biggest gain from this study.
Verification conditions: EURUSD, USDJPY, GBPUSD, USDCHF, AUDUSD, NZDUSD, USDCAD / 15-minute price data aggregated to 1-hour, 4-hour, and daily / 2000–2026 / moving average type: simple average (excluding comparisons) / decisions only on confirmed bars (not on forming bars) / trading cost 1.2 pips per trade / §1–4: “if short-term > long-term then buy, else sell, hold until opposite cross” / §5–6: “1-hour RSI (14) crosses above 30 to buy, crosses below 70 to sell, exit after 24 bars, no stop loss or take profit.”
Disclaimer: This article is a development record based on retrospective data validation and does not guarantee future performance. It is not investment advice. Please make trading decisions at your own risk.
About this validation: The validation code creation, brute-force of 1,631 combinations, shifting validation, and count checks were done in collaboration with AI (Claude Code). The design and judgment are by humans; production and verification are by AI — a division of labor.