

Can the Elliott Wave be counted by machine? A record of trying three absolute rules
I am Tonochi, developing EAs. I have been analyzing various methods that I have been curious about but overlooked, using AI to support the analysis, incorporating the good ones into EAs, and publishing those that my analysis does not find any edge for in this form. This is one of those cases.
The topic isElliott Wave. The market is thought to be a collection of eight waves: an upward five-wave move (1-2-3-4-5) followed by a corrective three-wave move (A-B-C), with the same shapes contained within each wave. This concept was proposed by Ralph Elliott in the 1930s.
This method has long been criticized as “the answer depends on who is counting. In hindsight it can be counted neatly, but at the moment interpretations vary by person. In that case,what if we let machines count it. I tested it on data from 2000 to this year.
Let me state the conclusion first.With my measuring method, I did not find predictive power in Elliott waves.However, this does not mean “Elliott doesn’t work.” I tested only one of countless possible ways to use it, and only tried one way of identifying waves, one way of counting, and one way of executing trades—only what I chose to test.
Moreover, what I discovered along the way was more interesting, so I will focus on that.
1. First, MT5 does not have an “Elliott” indicator built in
I only found out about this after checking. When I actually confirmed the list of standard indicators included with MT5 (MetaTrader 5),there is no indicator named “Elliott”. What is included areZigzag (a tool that automatically connects peaks and troughs with lines) andFractal (marks higher/lower bars than the surroundings).
And when you read explanations of Elliott waves, almost all wave-making uses Zigzag. In other words, “handling Elliott waves mechanically” essentially meansprinting peaks and troughs with Zigzag and labeling them 1-2-3-4-5.
For this premise, I prepared two ways to identify peaks and troughs. One isa Zigzag that adjusts reversal width according to price volatility (ATR), and the other isthe Zigzag that comes standard with MT5. I ran the same verification with both and checked whether the results matched.
2. The waves themselves can be counted by machines
In the previous Fibonacci round, the position of the lines changed depending on where you started, so I fixed a starting point and then measured. This time, I’m talking about something earlier.Can waves themselves be counted?
In short,counting can be surprisingly straightforward to automate.
Counting across 7 currencies, 15-minute bars, and 26 years yields about17,000–19,000 waves per currency. The typical wave size is a median of53–78 pips, and the length is24–28 waves.
Moreover, even if you change the identification method, the peaks and troughs tend to align.Even expanding the reversal width threefold, the peak locations overlap with the original peaks by 99–100% (a large-wave vertex is also a small-wave vertex, which is consistent with Elliott’s nesting concept). It also aligned 94–95% with another fractal method.
The same places appear regardless of the method used, so at least the task of “counting” does not deviate much when delegated to a machine. Honestly, this was surprising.
Note that all of the following verifications used onlythe waves that were confirmed at that time (we do not look at later prices). It’s natural to say this, but if you loosen this condition, performance can improve arbitrarily, so I’m stating this upfront.
3. The counting method converges to one only about 30% of the time — but saying “it’s a pullback” is always valid
Next, I used three rules commonly described as objective in Elliott analysis. This is the part widely believed to be stable across observers.
- Wave 2 does not fall below the starting price of Wave 1
- Wave 3 is not the shortest among Waves 1, 3, and 5
- Wave 4 does not enter the price range moved by Wave 1
The approach was not to “count correctly,” but to“list all counting methods that could be made to work at that moment and discard those that violate the rules”. The idea is to decide only when a single counting method is determined. I believed this was the only way to avoid discretion.
125,000 scenarios were tested.
- Counting methodconverged to one:29%
- Opinions differed (two or more remained): 71%
- No counting method would violate the rules:0.0%
The final line is important.Elliott can always attach some explanation to any price move. “There is no move that cannot be explained” is, conversely, a sign thatit cannot fail to explain anything = cannot prove a mistake.
And there is something that became clear only after automation.The explanation “this drop is a pullback against the preceding rise (Wave 1)” can always be made true. Because, by Zigzag’s definition, the most recent wave always resembles the shape of “Wave 1.” Therefore the interpretation of it as a pullback cannot be eliminated in principle. In fact,there was no scenario under these conditions where I could say “this is not a pullback but the main move”.
Therefore, I tried to feed the practice notion of “the Wave Hierarchy” (small waves are not labeled as Wave 1 but counted from large turning points) into the machine. Then the opposite happened.
- Situations where counting could be produced:14.4%
- No matter how you count, it violates the rules = cannot explain:85.2%
There is a trade-off between narrowing and explanatory power; loosening allowances allows explanation but cannot decide. Tightening allows decision but leaves most scenarios unexplainable.
4. The core — does something change at the boundary of absolute rules?
If the three rules are genuine,the boundary between shapes that satisfy the rules and those that break them should cause discontinuous changes in subsequent price moves. For example, if Rule 1 (Wave 2 does not fall below Wave 1’s starting point) holds, when the retracement exceeds 100%, the nature should switch to not being a continuation wave anymore.
So I measured retracement depths at fine intervals and looked forwhether the performance changes sharply across a boundary. If it changes stepwise at the boundary, that boundary is meaningful.If it continues smoothly like a slope, then what matters is the continuous property of retracement depth, not the rule’s boundary.
Results (average normalized by 15-minute bars, 13 instruments, price movement volatility).
| Wave 2 retracement | Subsequent price movement |
|---|---|
| 60–80% | +0.049 |
| 80–90% | +0.058 |
| 90–100% (edge of the rule-fulfilling side) | +0.023 |
| 100–110% (rule-violating) | −0.011 |
| 110–130% | −0.003 |
There are no sharp changes.From just before the boundary, the price has already started to drop, and it keeps sliding even after crossing 100%.Peaks are around 60–90%, which is not Elliott-related (this is the same finding I observed in the previous Fibonacci test).
Rule 3 (Wave 4 not overlapping Wave 1’s range) was even more straightforward.
| Overlap of Wave 4 and Wave 1 | Subsequent price movement |
|---|---|
| No overlap (rule-satisfying) | −0.086 〜 −0.229 |
| Slight overlap (rule-violation) | |
| Frequent overlap (greater violation) | +0.012 〜 +0.021 |
It was the other way around.The price moves that violated the rule actually performed better afterward. And this change was gradual, with no abrupt shifts at the boundary.
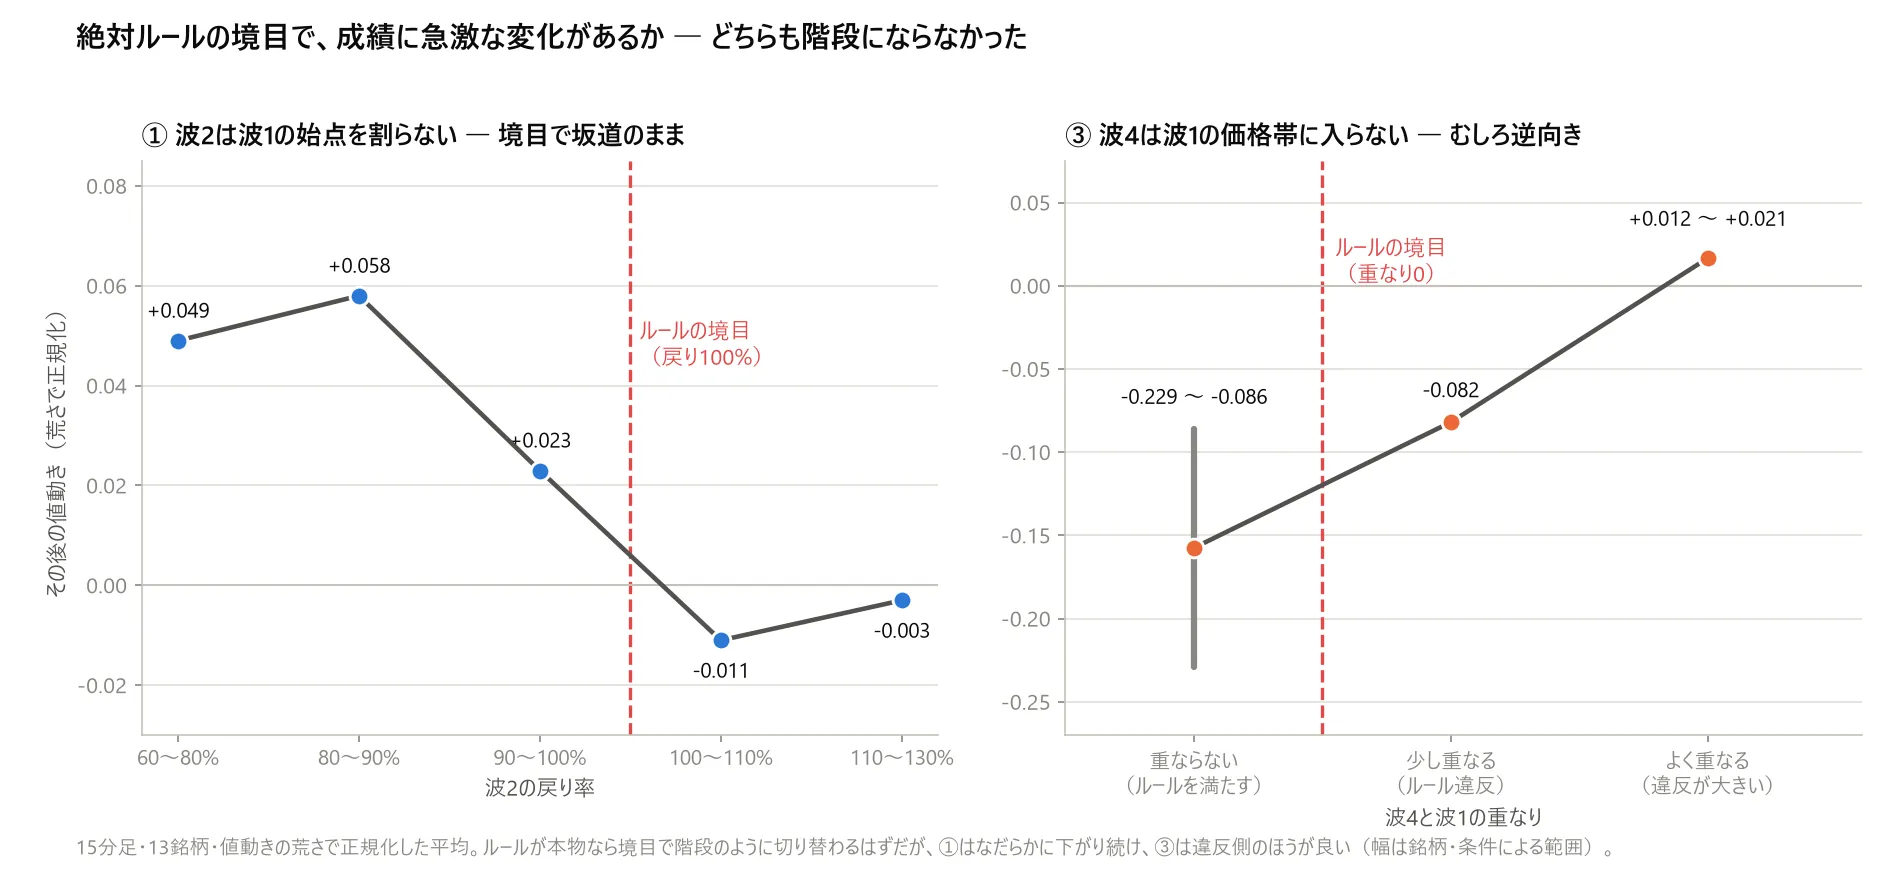
▲Figure 1: At the boundary of absolute rules, whether performance changes sharply. ① Wave 2 retracement crosses 100% and continues smoothly, and ③ Wave 4 overlap on the rule-violating side performed better. Averaged over 15-minute bars, 13 instruments, normalized by price volatility.
Rule 2 (Wave 3 is not the shortest / extension is 1.618) behaved similarly, with the peak performance occurring where “Wave 3 is 1.0–1.3 times Wave 1”;the famous 1.618x was actually the trough.
5. The notion that “Wave 3 is the largest” is only a matter of order being right
The most famous claim in Elliott analysis is that “Wave 3 tends to be the longest.” This can be verified only in the cases where the counting method has converged to a single option.
- Wave 3: 8.16
- Wave 2: 8.01
- Corrective Wave A: 7.93
- Wave 4: 7.87
- Wave 5: 7.75
The order matched theory.Wave 3 being the largest and the pullbacks (Waves 2 and 4) and Wave 5 being smaller was observed straightforwardly.
Howeverthe difference between the largest Wave 3 and the smallest Wave 5 is 5%. Trading costs (spreads) are far larger, sothis matches, but not enough to use for trading based on my measurement method; in other words, “the trend is correct, but the difference is too small to bet on.”
6. The biggest headache — changing the counting method reverses the results
Up to here I’ve said the method didn’t work, but there was a moment when a result appeared that seemed to work. Only for a specific reversal width did performance clearly improve, and statistically it was not a fluke.
So I used the same technique as in my previous article.Change the number of cases to see if the same effect remains, to see whether the effect persists.
| Condition | Count | Effect size |
|---|---|---|
| 15-minute bars・fine waves | ||
| 15-minute bars・standard | ||
| 1-hour bars | ||
| 4-hour bars | ||
| 4-hour bars・coarse waves | 169件 | +39.65 pips |
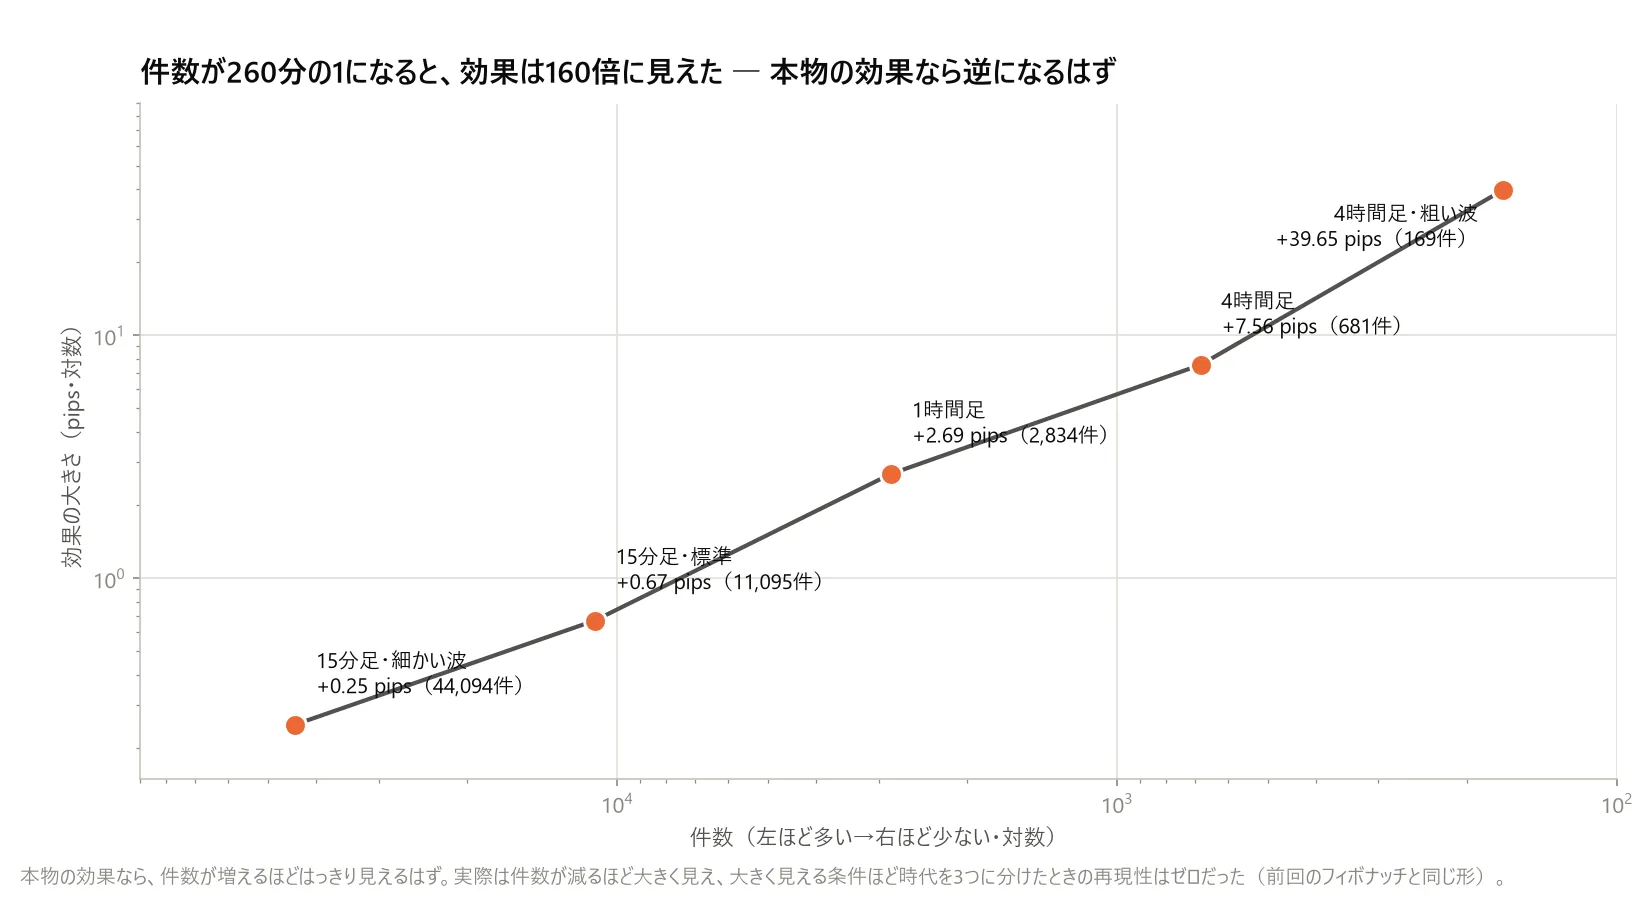
▲Figure 2: Relationship between the number of cases and effect size. When the count dropped to 1 in 260, the effect looked 160 times larger. If there were real effects, they would become clearer as the count grows.
Even more decisive was thatchanging how waves are identified swapped which currencies performed well. I ran the same verification with the Zigzag-based volatility-based zigzag and MT5’s standard Zigzag. Each produced currencies that performed well and poorly, butthe lists swapped depending on the method. Just changing the reversal width by one step caused the same result.
There is no evidence showing which identification method is correct.If changing the method by one step swaps which currencies shine, the “appearing effective results” do not reflect real efficacy.
7. The limitations of this validation (honestly)
- I only tested a single set of counting methods. There are other discretionary counting approaches, and I have no data to negate them.Parts that machine could not reproduce reflect the limits of my tools
- I used15-minute, 1-hour, and 4-hour currency pairs (with some gold and crude oil). Elliott is usually discussed for stock indices and longer time frames.
- The handling of wave degrees was simplified to two levels (large and small). The full theory is more layered.
- For settlement, I fixed rules like “close the position when the next wave is confirmed.” In actual trading there is more room for refinement.
Even so,no sharp boundary change was found at any of the three absolute rules, andresults varied depending on counting method across repeated trials. I consider this a solid finding.
8. Summary
- There is no “Elliott” indicator in MT5; what is actually used isZigzag
- Counting waves itself can be done by machines (the peaks and troughs align 99–100% across methods)
- Only about30% of counting methods converge to a single result. Meanwhile,the explanation “this is a pullback” can always be made
- There was no sharp performance change at the boundary of the three absolute rules(Rule 3 was rather in the opposite direction)
- The statement “Wave 3 is the largest” has correct ordering but only a 5% difference
- the apparent effect was a false signal that disappeared with more cases
With this validation, I decided not to include Elliott Wave in my EA. However, again, this isa record of my measuring method. The same tools could yield different results if measured differently.
In other words, I completed this validation without adopting a single EA, which is a sensible outcome. Personally, I think this kind of exploration yields more learning.