
August 13th (Thu): 【BB & HM】 Nikkei 225 vs US 10-Year Treasury Yield
This time
is called the "temperature of the economy"
“U.S. 10-year Treasury yield”
I will compare with it.
【Overall Scenario Probability】
This week's overall market is…
“Rise: 60% / Fall: 40%”
※Although the major four U.S. indices continue to rise and the Nikkei 225 is maintaining the rise pattern on the 4-hour and 1-hour charts, the important [resistance band] on the daily chart at +2σ is approaching.
※Presented as a reference level.
【This Week's Market Highlights】
This week, the Nikkei 225 is approaching an important milestone at the daily chart’s +2σ, and it is the main point of attention whether it will break through this level to continue rising or act as a resistance and reverse.
The four major U.S. indices continue to show upward momentum, and a potential rebound after a horizontal consolidation in the S&P 500 and NASDAQ (blue zone) is possible.
On the other hand, harmonic patterns indicating a decline have been detected in Bitcoin, and their potential impact on the overall market is being watched.
Details will be explained in the paid section.
➥For the continuation, detailed explanations are provided in the members-only report.
If you have not registered yet, please click here ↓
【Integrated Version】
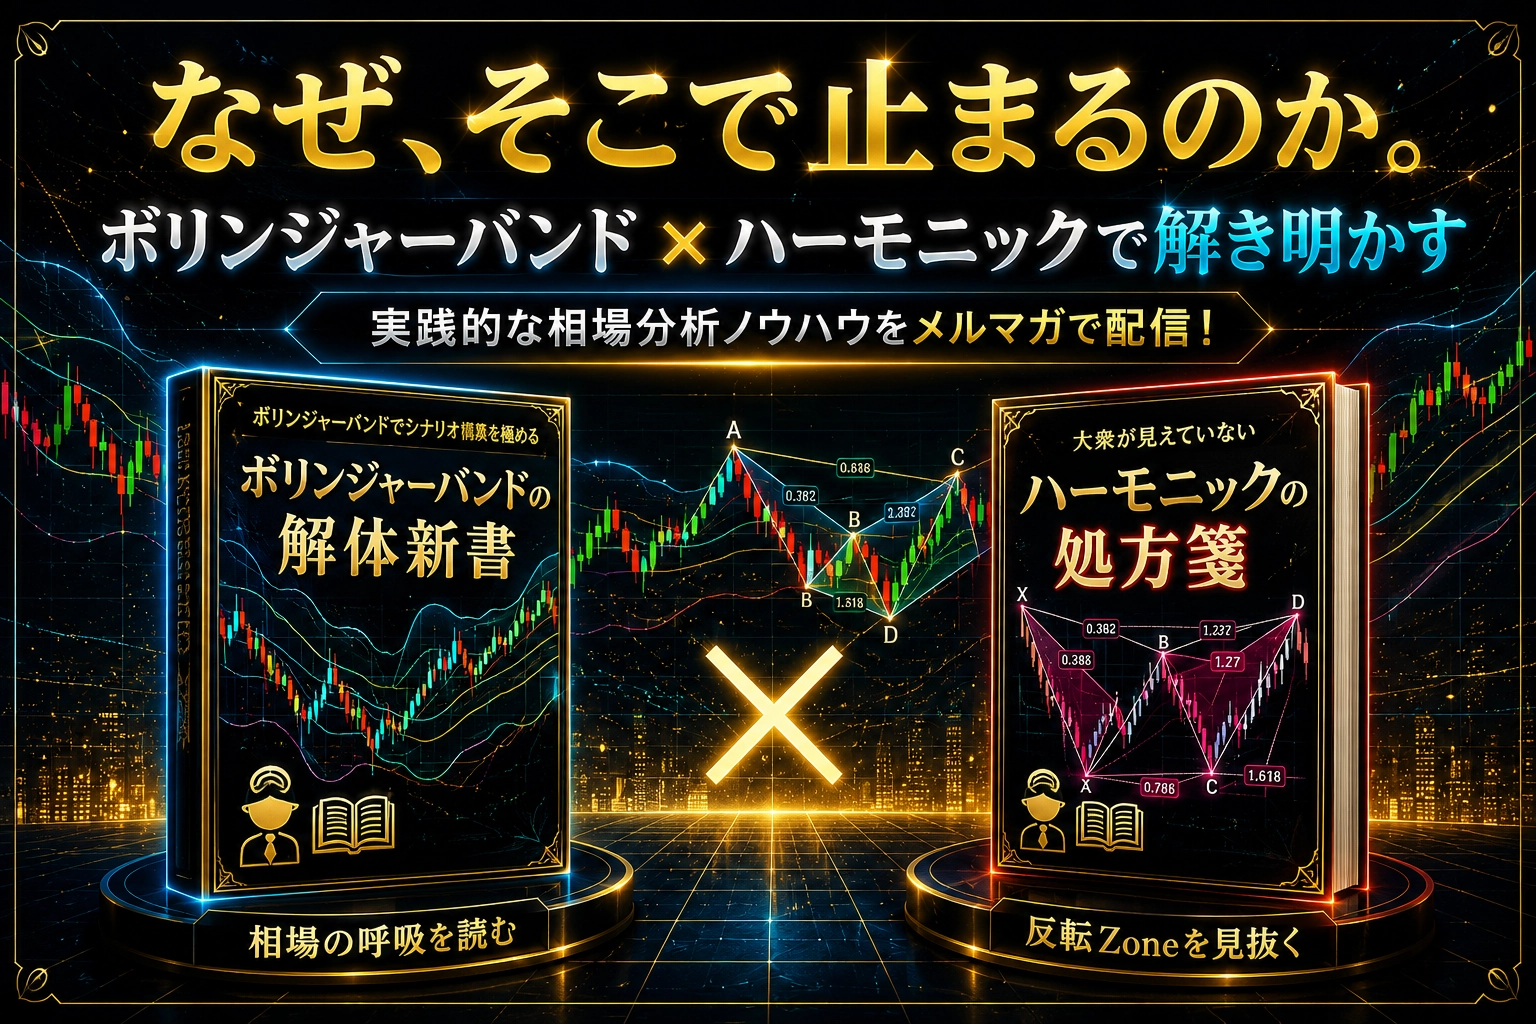
‘Why does the market stop there?’ Bollinger Bands × Harmonics. A fusion of statistics and geometry to capture turning points of the market with high precision!
https://www.gogojungle.co.jp/finance/navi/series/1613?via=articles_detail_aside
(*The following is for members only.*)
----------------------------------------------
【Environmental Recognition】