
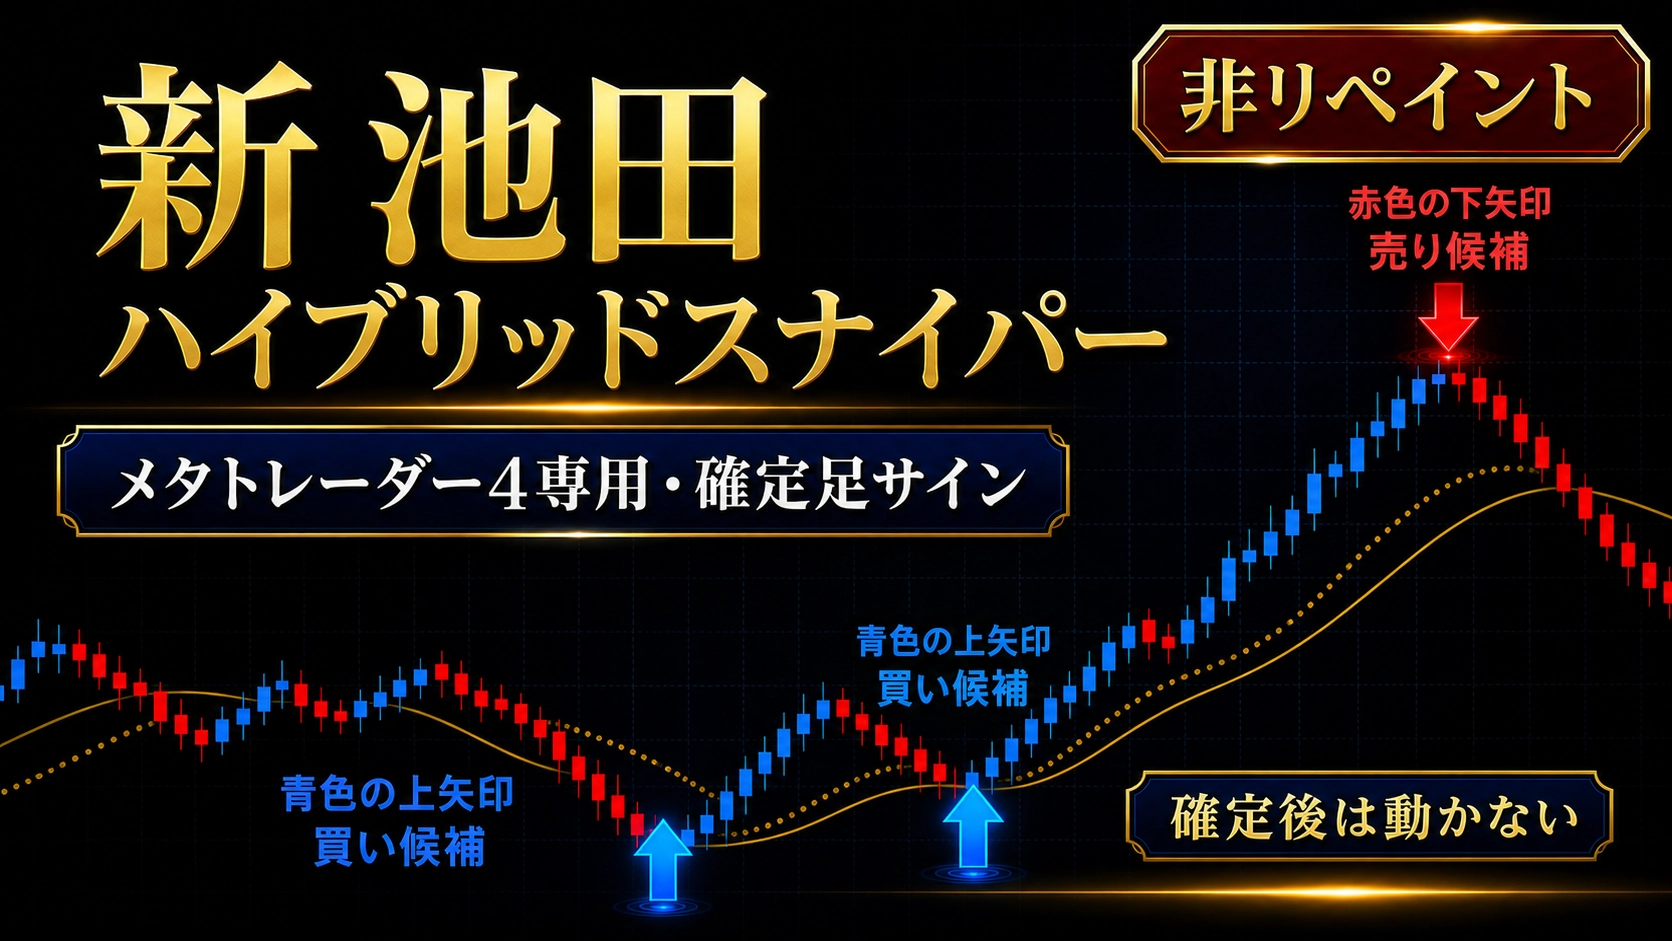
New IKEDA Hybrid Sniper | Supports buy/sell decisions with higher-timeframe direction and M15 confirmation arrows
New IKEDA Hybrid Sniper
An discretionary indicator that lets you confirm the direction of higher timeframes and the turning point on the 15-minute chart on a single screen.
Click here for the New IKEDA Hybrid Sniper product page
【Combine the major trend with the 15-minute turn】
The difficulty in the market is not only judging up and down.
Even if the major trend is rising, the shorter timeframes may temporarily fall. Conversely, even if the major trend is falling, the shorter timeframes may rise strongly.
If you trade without organizing these timeframe differences, you may end up selling during a rally or buying during a decline.
The New IKEDA Hybrid Sniper bases its approach on confirming the market direction on the higher timeframe and looking for the actual turning point on the 15-minute chart.
【The 4-hour chart is given the most weight】
The monthly and weekly charts are used to confirm the overall market trend.
The daily chart is used to confirm the medium- to long-term direction.
The actual trading decision focuses on the 4-hour chart.
If the 4-hour chart is upward, consider a rise from a pullback.
If the 4-hour chart is downward, consider a decline from a bounce.
However, do not judge based on the 4-hour chart alone.
Use the 30-minute and 15-minute charts to confirm that a turnaround toward the 4-hour direction has begun.
【Confirm the big picture with the monthly, weekly, and daily charts】
The monthly, weekly, and daily charts do not frequently change direction in a short time.
When a major top or bottom is confirmed, the direction can be maintained for a long period.
Even if the monthly and weekly charts are upward, if the 4-hour chart is downward, a short-term corrective decline may continue.
Even if the monthly and weekly charts are downward, if the 4-hour chart is upward, a short-term bounce is possible.
Do not wait for all timeframes to align; consider the role of each timeframe separately.
【Check direction continuity on the 30-minute chart】
The 4-hour chart is easy to determine direction but can be slow to confirm a turn.
The 15-minute chart can confirm turns quickly, but has more minor fluctuations.
By checking the 30-minute chart in between, you can more easily judge whether price action is returning toward the 4-hour direction.
If the 4-hour chart is upward and the 30-minute chart also shifts upward, look for a buy turn on the 15-minute chart.
If the 4-hour chart is downward and the 30-minute chart also shifts downward, look for a sell turn on the 15-minute chart.
【Confirm Avg. line color turn】
Regular candlesticks change color frequently due to minor price fluctuations.
Therefore, we use moving-averaged candles to smooth price movements and confirm the current direction and color turn.
Blue indicates an upward direction.
Red indicates a downward direction.
If a previously declining average line turns blue, selling momentum weakens and a potential upturn begins.
If a rising average line turns red, buying momentum weakens and a potential downturn begins.
However, color alone is not enough for judgment.
Combine with the direction of the higher timeframes and the movement of the cycle oscillator.
【Check turning strength with the Cycle Oscillator】
The Cycle Oscillator is a calculated line to gauge the cyclic strength/weakness of price.
When the main line crosses below the center line, turning upward is confirmed.
When the main line crosses above the center line, turning downward is confirmed.
If the average line turns blue and the Cycle Oscillator moves upward, this adds a buying rationale.
If the average line turns red and the Cycle Oscillator moves downward, this adds a selling rationale.
【Do not wait for all timeframes to align】
Waiting for all of monthly, weekly, daily, 4-hour, 30-minute, and 15-minute charts to agree would yield very few trading opportunities.
Treat the monthly and weekly as macro-direction references and make the 4-hour the central decision point.
Then combine the direction of the 30-minute chart, the color turn on the 15-minute average, and the crossing of the Cycle Oscillator.
By looking for moments where the necessary conditions overlap, you can verify direction while preserving trading opportunities.
【How the blue upward arrow is determined】
For buying candidates, prioritize the 4-hour chart being upward.
Next, confirm whether the 30-minute chart is advancing upward, whether the 15-minute chart’s average turned from red to blue, and whether the Cycle Oscillator crossed upward.
When multiple upward conditions overlap and the 15-minute chart closes, the blue upward arrow is confirmed.
The blue upward arrow does not guarantee a rise.
It signals that the scenario to consider buying is aligned with the higher-timeframe trend.
【How the red downward arrow is determined】
For selling candidates, prioritize the 4-hour chart being downward.
Next, confirm whether the 30-minute chart is moving downward, whether the 15-minute chart’s average turned from blue to red, and whether the Cycle Oscillator crossed downward.
When multiple downward conditions overlap and the 15-minute chart closes, the red downward arrow is confirmed.
The red downward arrow does not guarantee a decline.
It signals that the scenario to consider selling is aligned with the higher-timeframe trend.
【Red arrow at a rising market also has meaning】
In a rising market, a red downward arrow may appear near swing highs.
This does not mean that the monthly or daily trend has ended.
It captures that the buying momentum on shorter timeframes is weakening and a corrective decline on the 4-hour or 30-minute chart may begin.
Even in a large uptrend, prices do not move in a straight line.
They move with rises and corrective declines.
Similarly, the blue upward arrow near the lows of a downtrend means the same possibility of a temporary rebound.
You can identify a potential beginning of a temporary upside within a strong down direction.
【Confirmed arrows do not move after being fixed】
On the forming 15-minute chart, price and judging conditions can change.
Therefore, you do not confirm arrows on a forming bar.
When the 15-minute chart closes and a new bar begins, determine the arrow based on the previous completed bar.
New IKEDA Hybrid Sniper organizes information from multiple timeframes onto one screen, making it easy to understand which direction to consider at the moment.
It combines the major trend with short-term turning points to promote decision-making that does not rely solely on intuition, a market analysis method for traders.
For more details on New IKEDA Hybrid Sniper, click here