

8/12 GLD has stalled as expected at 4430.
Post on 8/11 at 9:05.
Good job. GLD has crossed the recent high zone, so it is heading toward the next zone. 4330-4491 This area is expected to rise.
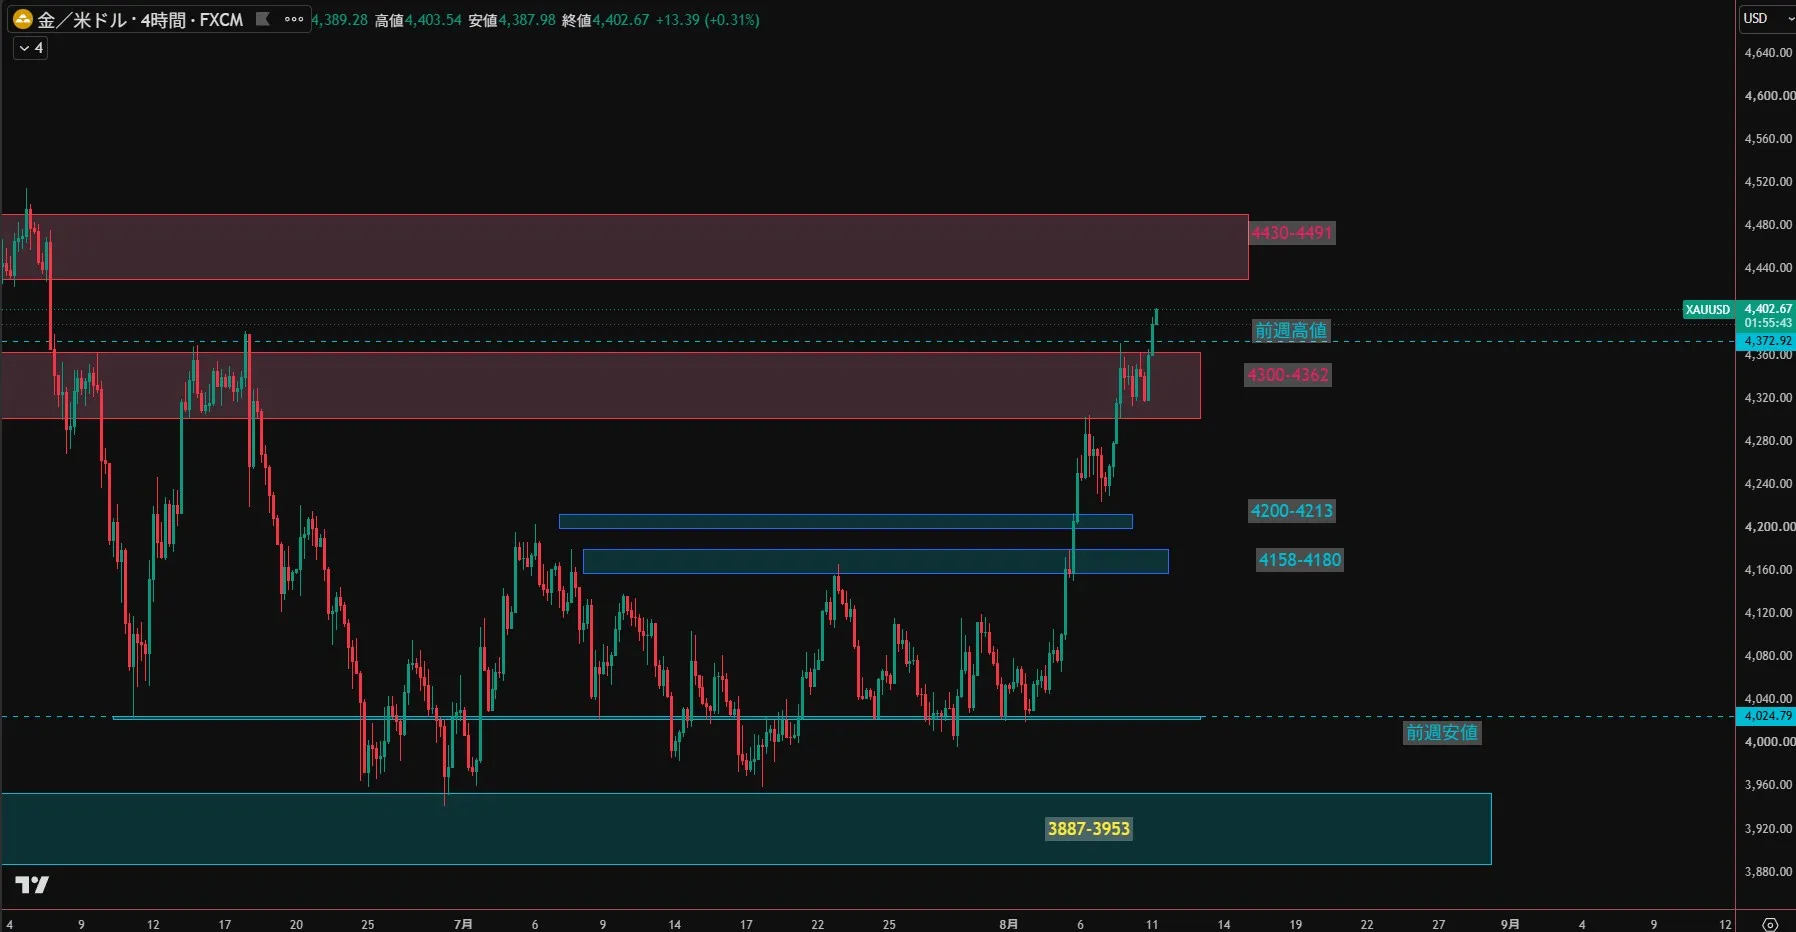
Chart as of 8/11
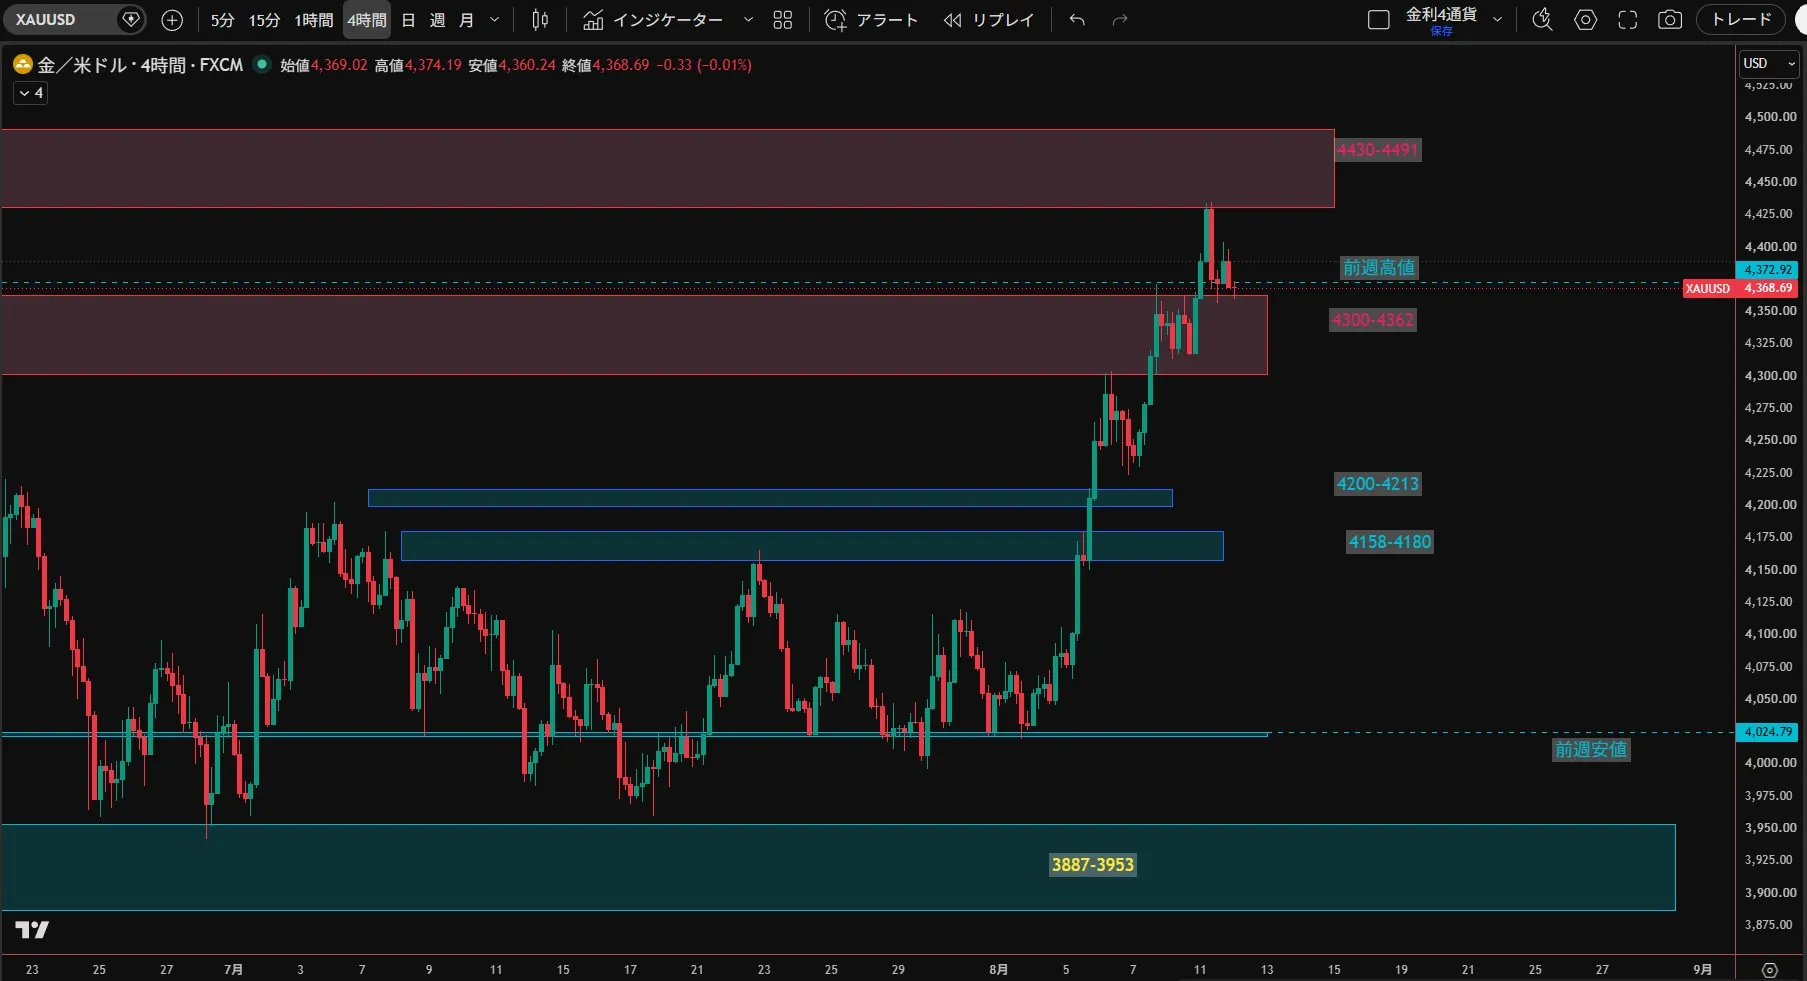
It is currently paused here, but once it crosses this zone, where will it stop?
If you know where it stops, you will understand the meaning of the N-shape drawn on the chart.
In particular, the starting point of the surge is where institutional investors are flowing money in.
Also, the points where it creates pullbacks or retracements are moves by algorithms aiming to resolve market imbalances.
By grasping these sequences, you can create meticulous trading plans.
【Investment Skill Share Feature vol.2】The answer born from training with a 10% graduation rate.
Mr. Koyaji, with 15 years of side work experience, directly teaches a lifelong discretionary trading technique.
https://www.gogojungle.co.jp/info/23491?via=notification
---------------------------------------------------------------------
☆Koyaji-style Zone Trading for High-Probability Trades☆
---------------------------------------------------------------------
What matters is not “winning” but not getting lost.
If your perspective is off, effort will not be rewarded.
If your perspective aligns, the market becomes suddenly simple.
A trading method designed to build an edge from chart structure.
※ You can join the online community “Path to Becoming a Part-Time Pro Trader.”
【Koyaji-style Zone Trade Method × SMC Practical Course 1-Month Critique】
https://www.gogojungle.co.jp/tools/rooms/76300
【Koyaji-style Zone Trade Method × SMC Practical Course Video Explanations Only (No critique)】
https://www.gogojungle.co.jp/tools/ebooks/76574
【Pro Trader Training 100-Case Knock—3-Month Critique Course】
https://www.gogojungle.co.jp/tools/rooms/74700
-----------------------------------------------------------------