
NK225 futures MTF Dow Theory — 4-scenario analysis report 2026-08-12
NK225 Futures MTF Dow Theory Analysis Report
Date and Time: August 12, 2026 06:03 JST / Night Session
Current Price: 67,200 JPY
Subject: For the daytime session (Wednesday, 8/12)
Conclusion
The prior focus level of 67,600 could not be exceeded, and the retracement highs were lowered to 67,510 and 67,490. However, the upward wave remains intact with a bounce point at 66,320, and the close at 67,200 is bullish. The 4H chart maintains an uptrend and rising wave. The focus during Wednesday is whether price can break above 67,490; if it can, the downward pressure on the recent highs stops, and if it cannot and stalls, the trend continuation fails and selling becomes likely.
If the 15m close breaks above 67,490, enter a follow-on long; if a pullback occurs between 66,910 and 67,100 and rebounds, buy the dip. Do not place sells below the established levels; enter long at 67,490–67,670 if price stalls after failing to hold above 67,490. If 66,910 (turnaround point) is broken, the recent upward wave will break down, and a break below 66,320 (4H turning point) will also break the 4H upward wave. Treat 67,600–67,670 as a single resistance band, as chasing higher prices becomes riskier.
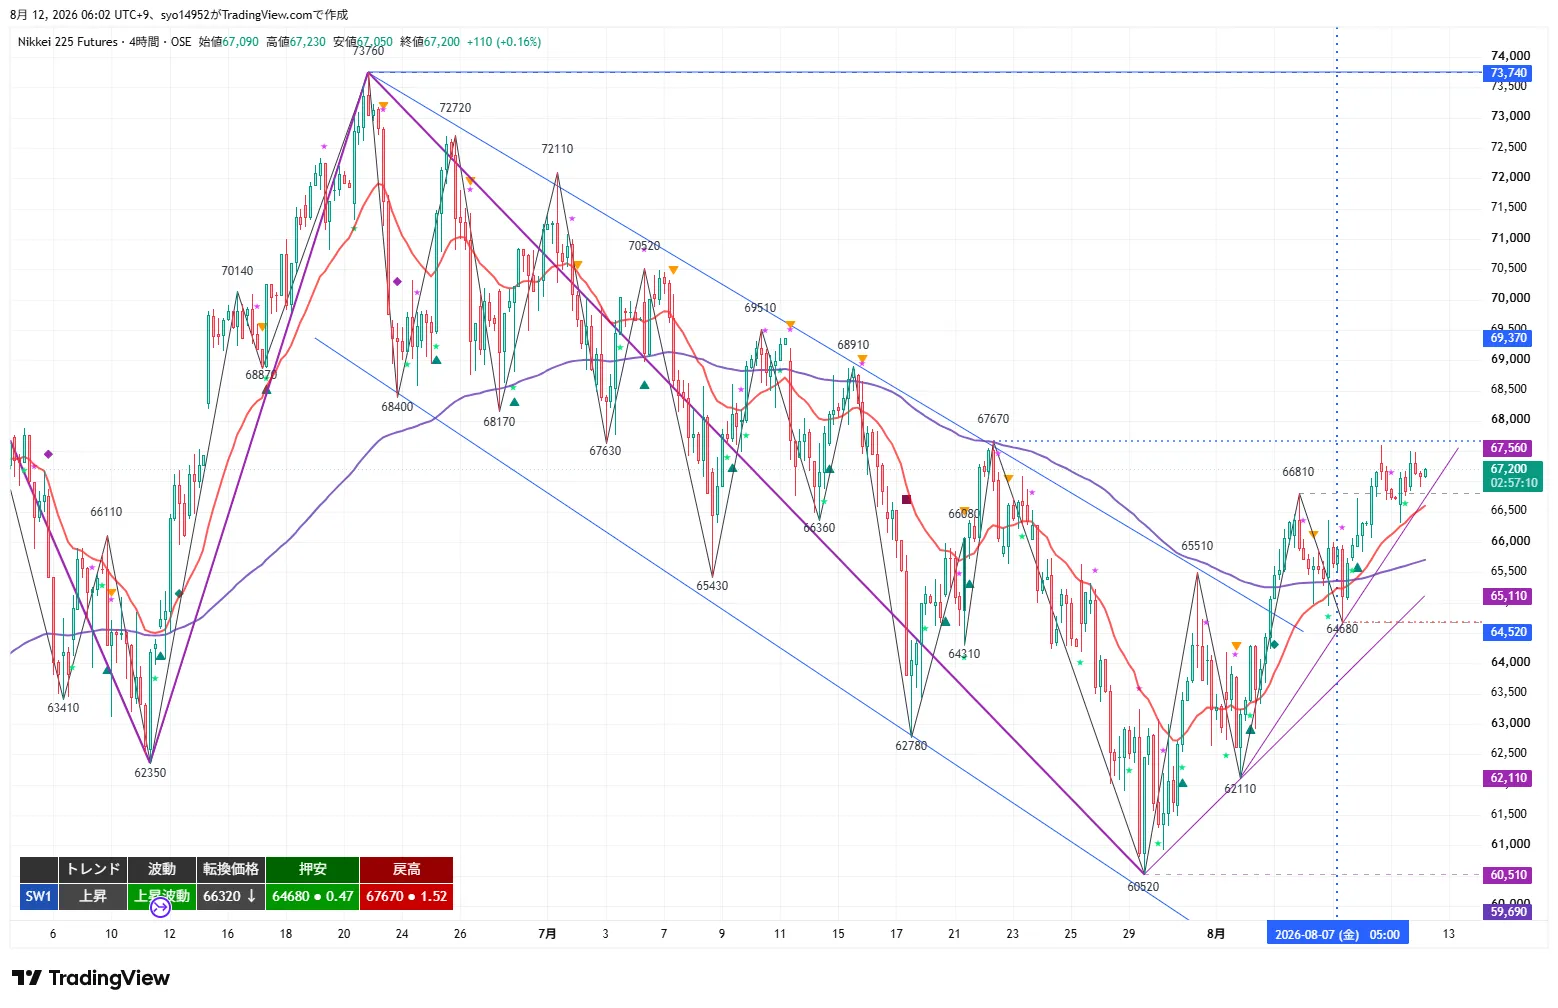
4H Analysis
The 4H chart continues the uptrend and rising wave. It rises from a support around 64,680, closing higher at 67,200. The turning price is 66,320; closing below this would break the upward wave. The 20EMA (around 66,500) is rising and above price, the 120EMA (around 65,110 on the daily equivalent) is downward, confirming an upward alignment.
Key upper targets include 67,670 (retracement high), 67,930, 68,220, and 68,810. Key lower supports are 66,910 (recent turnaround point), 66,760, 66,320 (turning price), 65,830, and 64,680 (old pullback low). As long as 66,320 is not broken, the 4H up-movement remains intact, but the retracement high at 67,670 has been rejected twice on 8/11 and 8/12, indicating heaviness in the top side.
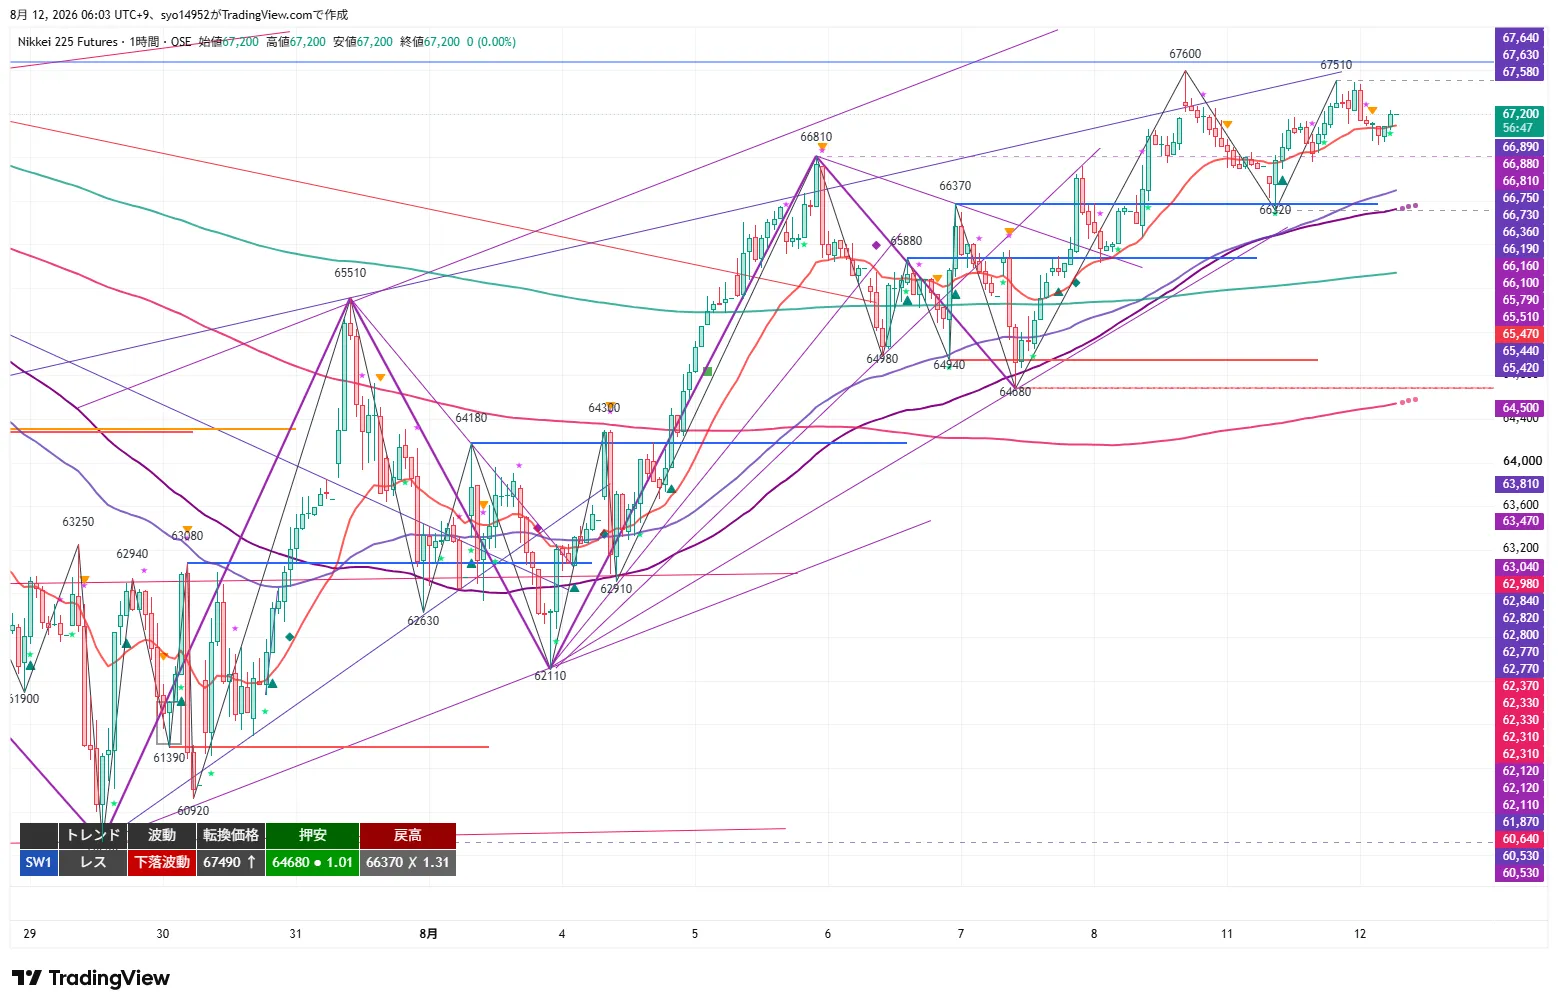
1H Analysis
The primary structural view on the 1H is that the trend is range-bound and the wave is a downwave. The breakout above 66,370 remains valid, but the price has failed to exceed the previous high of 67,600, with retracements to 67,510 and 67,490. The turning price is 67,490; a close above this would end the downwave. On the other hand, the upward wave persists with 66,320 (Night 8/11 low) acting as a turnaround point, so a trend failure is not yet confirmed. The 20EMA (around 67,100) is flat to rising, while the 80EMA (4H20EMA equivalent around 66,750) and the 480EMA (daily 20EMA around 66,160) are below price, supporting an upward setup.
The focal point is whether price can close above 67,490. If so, highs stop lowering and the uptrend resumes, turning to a new high with a recovery to 67,600. If unable to break through and stalls, look for a pullback sell; breaking below 66,910 (recent turnaround point) would break the recent upward wave, and breaking below 66,320 would break the 4H upward wave.
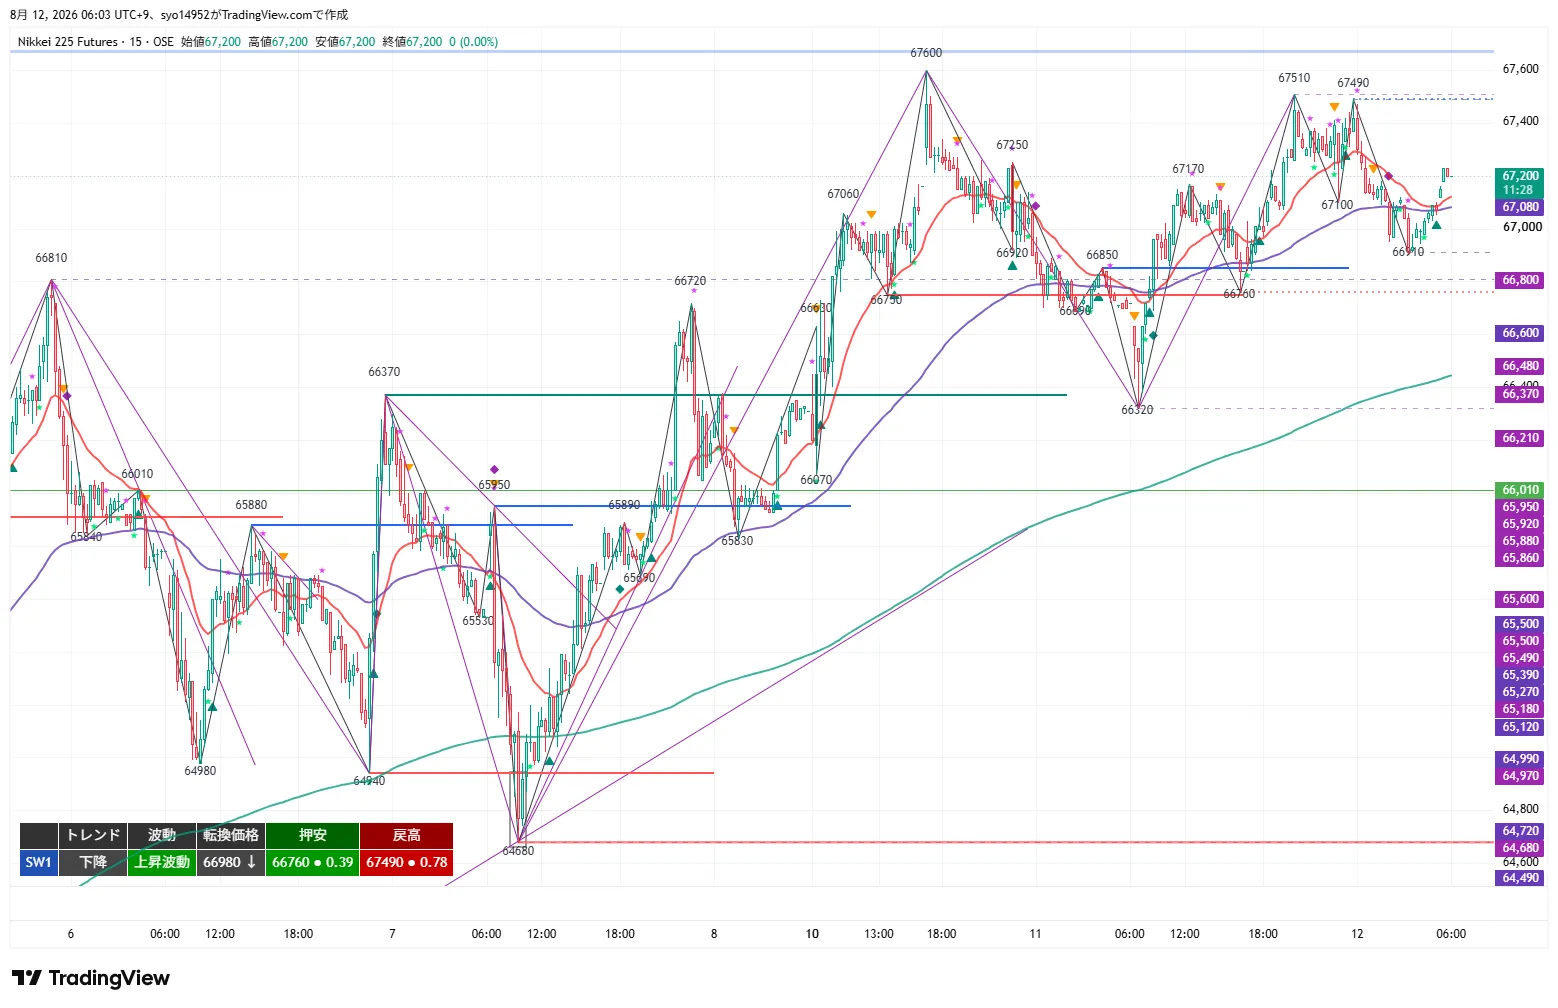
15m Analysis
The 15m is in a downtrend, with an up-move. Turning price is 66,980, support at 66,760, and retracement high at 67,490. Price retraced from 66,320 to 67,510, retraced to 67,490, and closed at 67,200 after dipping to 66,910. The 20EMA around 67,150 has turned positive with price above it, while the 320EMA (4H20EMA equivalent around 66,480) remains below.
In execution terms, a close above 67,490 is a trigger for follow-on, and a rebound from 66,910–67,100 offers a dip-buying opportunity. If 66,910 closes below, the turnaround point breaks, shifting to a selling stance. There are two peaks near 67,490–67,510, and the direction will hinge on how this band is breached.
MTF State
- 4H: Upward / Upward Wave. +0.16% bullish candle at 67,200. Turning price 66,320; pullback support 64,680; retracement high 67,670. 20EMA rising with price above; 120EMA (daily equivalent around 65,110) is below.
- 1H: Range / Downward Wave. 67,600 → 67,510 → 67,490 with retracement highs lowering. Turning price 67,490; pullback support 64,680; retracement high 66,370 (X). 20EMA flat to rising; price above it.
- 15m: Down / Upward Wave. Pullback from 66,320 to 67,510–67,490, then down to 66,910 and up to 67,200. Turning price 66,980; pullback support 66,760; retracement high 67,490. 20EMA turned positively and price above it.
- Consistency: 4H shows an uptrend/upward wave, 1H shows range/downward wave, 15m shows down/up waves; overall higher-timeframe structure remains bullish while 1H retracement highs are lowering. Core strategy centers on trend-following dip buys and follow-on longs, with an eye on stalling if recent highs cannot be exceeded. MA bands across 1H and 15m act as dip-zone justification but are not used as break criteria.
Key Prices
- 73,760 JPY: Daily retracement high. Upward target (reference).
- 68,810 JPY: Daily key level. ① T2 / ③ Full retreat.
- 68,220 JPY: Higher-level threshold. ① T2 / Upper limit of the retrace sell zone 2.
- 67,930 JPY: 1H old pullback low. ① T1 / ② T2 / Lower bound of retrace sell zone 2.
- 67,670 JPY: 4H retracement high. Upper bound of Retrace Sell Zone 1.
- 67,600 JPY: Night high of 8/11. ① Core position / ② T1.
- 67,510 JPY: Retracement high on 8/12.
- 67,490 JPY: Night high on 8/12; 1H turning price (recent high). ① Trigger / ② Core position / ④ Full retreat.
- 67,200 JPY: Current price / Night session close.
- 67,150 JPY: 15m 20EMA vicinity.
- 67,100 JPY: 15m landmark. Upper bound of Dip Buy Zone 1.
- 66,980 JPY: 15m turning price.
- 66,910 JPY: Night low on 8/12 (recent turnaround point). Lower bound of Dip Buy Zone 1 / Core position / Trigger.
- 66,760 JPY: 15m old pullback low (X = broken) = resistance-turned. Upper bound of Dip Buy Zone 2 / ③ T1.
- 66,750 JPY: Around 1H 80EMA (4H20EMA equivalent).
- 66,480 JPY: 15m 320EMA (4H20EMA equivalent).
- 66,320 JPY: Night 8/11 low, 4H turning price, 1H pullback low. Lower bound of Dip Buy Zone 2 / ③ T2 / ④ T1 / Core position / ① Full retreat.
- 66,160 JPY: 1H 480EMA (Daily 20EMA equivalent).
- 65,830 JPY: Lower threshold. ② Full retreat / ③ T2 / ④ T2.
- 64,680 JPY: 1H-4H old pullback low. ④ T2.
Trading Ideas
① Breakout Follow-Through (Long)
- Trigger: Break above 67,490 (8/12 night high; 1H turning price = recent high) with a 15m close (pullback highs stop lowering and up move resumes).
- Pre-entry price: 67,490. After breakout, wait for a pullback near the breakout price or around the sloped 20MA on a 1m/5m chart as a pre-entry (back-entry; RR based on breakout price).
- Actual entry price: 67,600 (8/11 night high) recovered on 1H close = resolution of the lower-high issue and core position established.
- Stop/Invalidation: Pre-entry below 67,190; core below 66,910. Full retreat below 66,320.
- Targets: 67,930 (partial take + construction price), 68,220 / 68,810.
- RR: T1 (67,930) = 1.5 / T2 (68,220) = 2.4. Due to thin T1, emphasize back-entry.
- MFE protection: close or small profit at +200; secure at least +100 with +300 or use trailing. 67,600–67,670 remains an integrated resistance band; protect early.
② Dip Buying (Long)
- Standard conditions: Pull back to 66,910–67,100 (recent turnaround to 15m pivot) and confirm rebound shape with 15m close. 15m20EMA and 1H20EMA converge in this zone, making it prone to rebound. Deep pullbacks to 66,320–66,760 (4H turning price to resistance-turned) imply moving stop to 66,020.
- Pre-entry price: 67,050. After confirming rebound with 15m close, ensure 20MA is rising and price has regained 20MA before initiating.
- Actual entry price: 67,490 (recent high) recovered on 1H close = core position established.
- Stop/Invalidation: Pre-entry below 66,750; core below 66,320. Full retreat below 65,830 (switch to ④).
- Targets: 67,600 (partial take + construction price), 67,930 / 68,220.
- RR: T1 (67,600) = 1.8 / T2 (67,930) = 2.9.
- MFE protection: close or small profit at +200; secure at least +100 with +300 or trailing. Since retracement highs are lowering, protect early.
③ Sell the Retrace (Short)
- Standard conditions: In the 67,490–67,670 zone (8/12 night high–4H retracement high), confirm a clear break above 67,490 on 15m close; Zone 2 is 67,930–68,220 (in this case, set stop at 68,320).
- Pre-entry price: 67,540. After confirming stall on 15m close, pre-entry near recent highs using 1m/5m to gauge speed (avoid premature long above rising 20MA). Pre-entry is just above recent highs; place stop above the zone.
- Actual entry price: 66,910 (turning point) break below 1H close = recent upward wave collapses; core position to be added after partial take and shift of cost basis once the core breaks.
- Stop/Invalidation: Pre-entry recovers above 67,840; core recovers above 67,490. Full retreat above 68,810.
- Targets: 66,760 (partial take + cost basis), 66,320 / 65,830.
- RR: T1 (66,760) = 2.6 / T2 (66,320) = 4.1.
- MFE protection: close or small profit at +200; secure at least +100 with +300 or trailing. Do not place sells below established levels. Since this is an up-move in a 4H uptrend, avoid overtrading; if T1 is already reached on the trigger foot, skip further actions.
④ Breakout Follow-Through (Short)
- Trigger: Break below 66,910 (8/12 night low = support turning point for the rise to 67,490) with a 15m close (recent upward wave breaks).
- Pre-entry price: 66,910. After breaking, await a pullback near the breakout price or around a sloped 20MA on 1m/5m to pre-enter (back-entry; RR based on breakout price).
- Actual entry price: 66,320 (4H turning price; 1H pullback low) breaks on 1H close = 4H upward wave also failing; enters core position. Since Target 1 equals same price, take partial profit and move cost basis, then add core when 1H close below is confirmed on the same candle.
- Stop/Invalidation: Pre-entry recovers to 67,260; core recovers to 66,910. Full retreat to 67,490.
- Targets: 66,320 (partial take + cost), 65,830 / 64,680.
- RR: T1 (66,320) = 1.7 / T2 (65,830) = 3.1. 66,760 has RR less than 1.0, so not used as T1.
- MFE protection: close or small profit at +200; secure at least +100 with +300 or trailing. Do not place sells under established levels. Do not chase deeply on reversals in the rising-phase; wait for clear close below before core position.
Current Actions
- Most important Line 1: 67,490. 8/12 night high; 1H turning price. A close above this line confirms the retracement highs stop lowering and a follow-on long (pre-entry 67,490; core enters on 67,600 via 1H close recovery). If breached and stalls, consider a retrace sell (pre-entry 67,540). Note two highs around 67,490–67,510; direction depends on how this band is breached.
- Most important Line 2: 66,910–67,100. The recent turnaround point to the 15m pivot. The confluence of 15m20EMA and 1H20EMA makes it a rebound zone; the rebound strategy is a dip buy (pre-entry 67,050). A break below 66,910 triggers the ④ trigger (pre-entry 66,910); a break below 66,320 would break the 4H upward wave.
Entry prices, triggers, and stops are set based on the chart shapes at the close (turning prices, pullback lows, and retracement highs of each timeframe). If the structure changes with time while the higher-timeframe structure remains, adjust entry prices using the lower-timeframe wave turning prices (e.g., when a short-term lower-timeframe wave initially rises then turns into a downwave) to better reflect current conditions, and adopt the option that better fits actual conditions.
Note: This report is for information purposes and not investment advice. Please make your own investment decisions and bear responsibility for them.