
August 12 (Wed): 【BB & HM】 Nikkei 225 vs Dollar/Yen
This time
『USD/JPY』
will be compared.
【Overall Scenario Probability】
This week's overall market is…
“Rising: 45% / Falling: 55%”
Because the upward probability scenario from the sideways movement of USD/JPY’s 【Time Adjustment】 (Blue Zone) has become downward pressure on the major four U.S. indices and the Nikkei 225 through 【Inverse Correlation】, and because Bitcoin’s harmonic descent scenario also overlaps,
this will be presented as a reference level.
【This Week's Market Key Points】
This week, while the four major U.S. indices maintain a rising-bias environment, the USD/JPY is increasingly likely to rise from the 【Time Adjustment】 (Blue Zone) after a sideways movement, raising concerns about downward pressure on the Nikkei 225 and the four major U.S. indices from the perspective of 【Inverse Correlation】.
Additionally, a new harmonic pattern has appeared in Bitcoin, and if it descends to the PRZ, the impact on the overall market could be large. With signals for both rise and fall interweaving, tomorrow and thereafter's price movement will determine the direction.
Details will be explained in the paid section.
➥The continuation is explained in detail in the members-only report.
If you are not yet registered, please click here ↓
【Integrated Version】
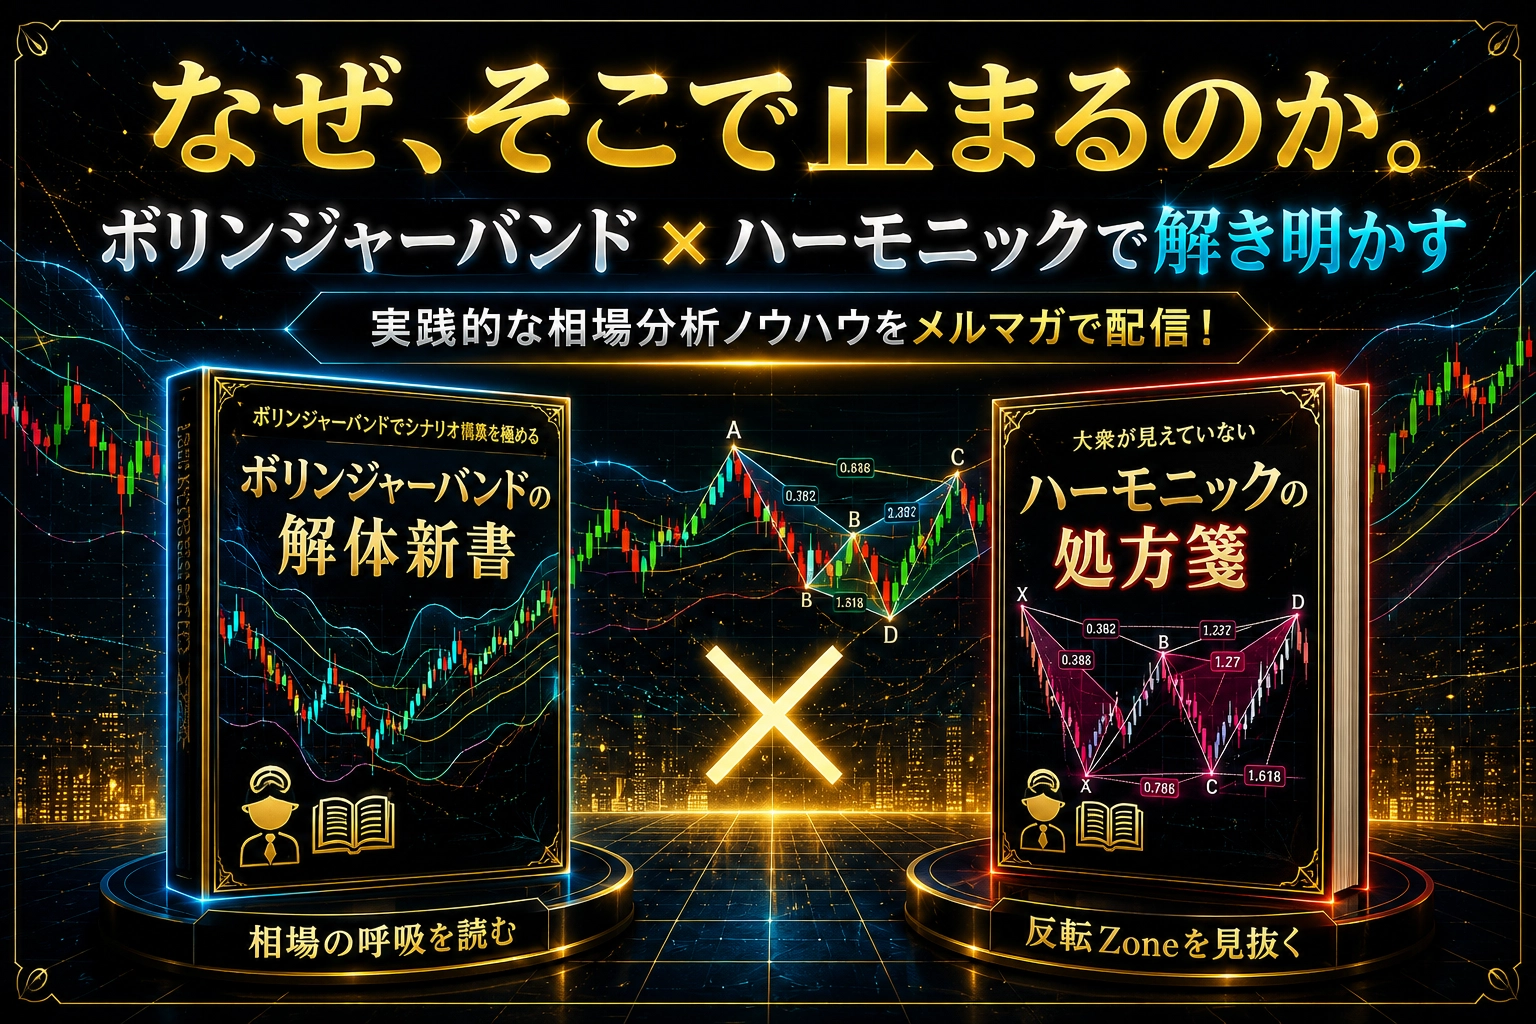
“Why does the market stop there?” Bollinger Bands ✕ Harmonics: the fusion of statistics and geometry to capture turning points with high precision!
https://www.gogojungle.co.jp/finance/navi/series/1613?via=articles_detail_aside
(※The following content is for members only.)
--------------------------------
【Environment Recognition】