
NK225 Futures MTF Dow Theory 4-Scenario Analysis Report 2026-08-11
NK225 Futures MTF Dow Theory Analysis Report
Date and Time: August 11, 2026 07:22 JST / August 11, 2026 06:00 Night Session Close
Current Value: 66,720 JPY
Subject: For Day Session (Tuesday, 8/11)
Conclusion
After breaking above 66,720 during the day on 8/10, price extended to 67,600 at night, confirming continuation of the 1H uptrend. However, it pulled back to 66,640, and the rebound level 66,750 that supported the rise to 67,600 was broken, ending at 66,720. The daily candle is a -0.66% bearish. During Tuesday, we will watch for two possibilities: can we reclaim and stay above 67,600, and can we hold 66,640?
If a daily close above 67,250 on 15m occurs, the pullback is complete and a follow-long can be taken; if price rebounds from the 66,640-66,750 pullback zone, go for a pullback buy. Do not place sell orders below the established levels; look to enter around 67,600–67,670 only if price cannot reclaim 67,600 and stalls. If 66,640 (rebound point) breaks, the pullback deepens, and breaking 66,070 (8/10 pullback low) would break the starting point of the upward wave. Since current price sits within the pullback zone, do not enter simply on zone contact; wait for a confirmation at the close.
4H Analysis
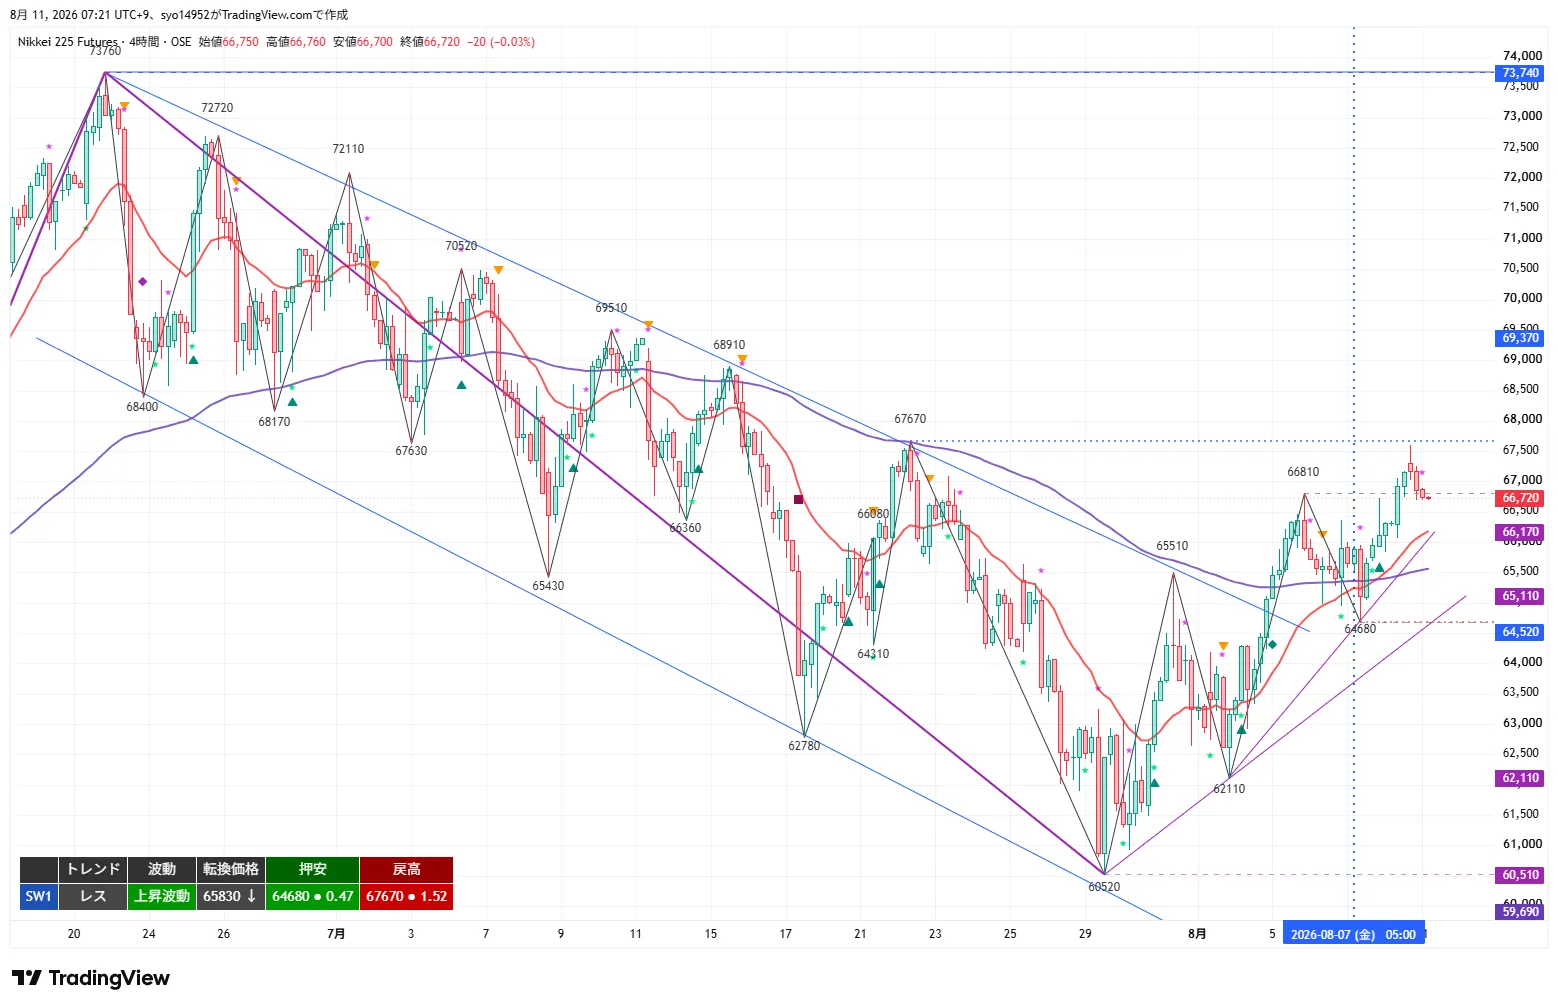
4H indicates a range-bound trend with an upward wave. Price rose from a pullback low of 64,680 to 67,600, then pulled back to close at 66,720. The turning price is 65,830; if you close below this, the uptrend would be broken. The 20EMA (around 66,170) is rising with price above it, and the 120EMA (around 65,110 on the daily) is below, preserving an upward sequence.
Key resistance levels to watch: 67,670 (retracement high), 67,930, 68,220, 68,810. Support levels: 66,640 (recent rebound point), 66,370, 66,070, 65,830 (turning price), 64,680 (pullback low), 62,110. As long as 65,830 holds, the 4H upwave remains intact, but we have not yet surpassed the retracement high of 67,670; the rejection at 67,600 signals top-side weakness. The daily is also a -0.66% bearish candle, so stay cautious for a pullback near the high zone.
1H Analysis
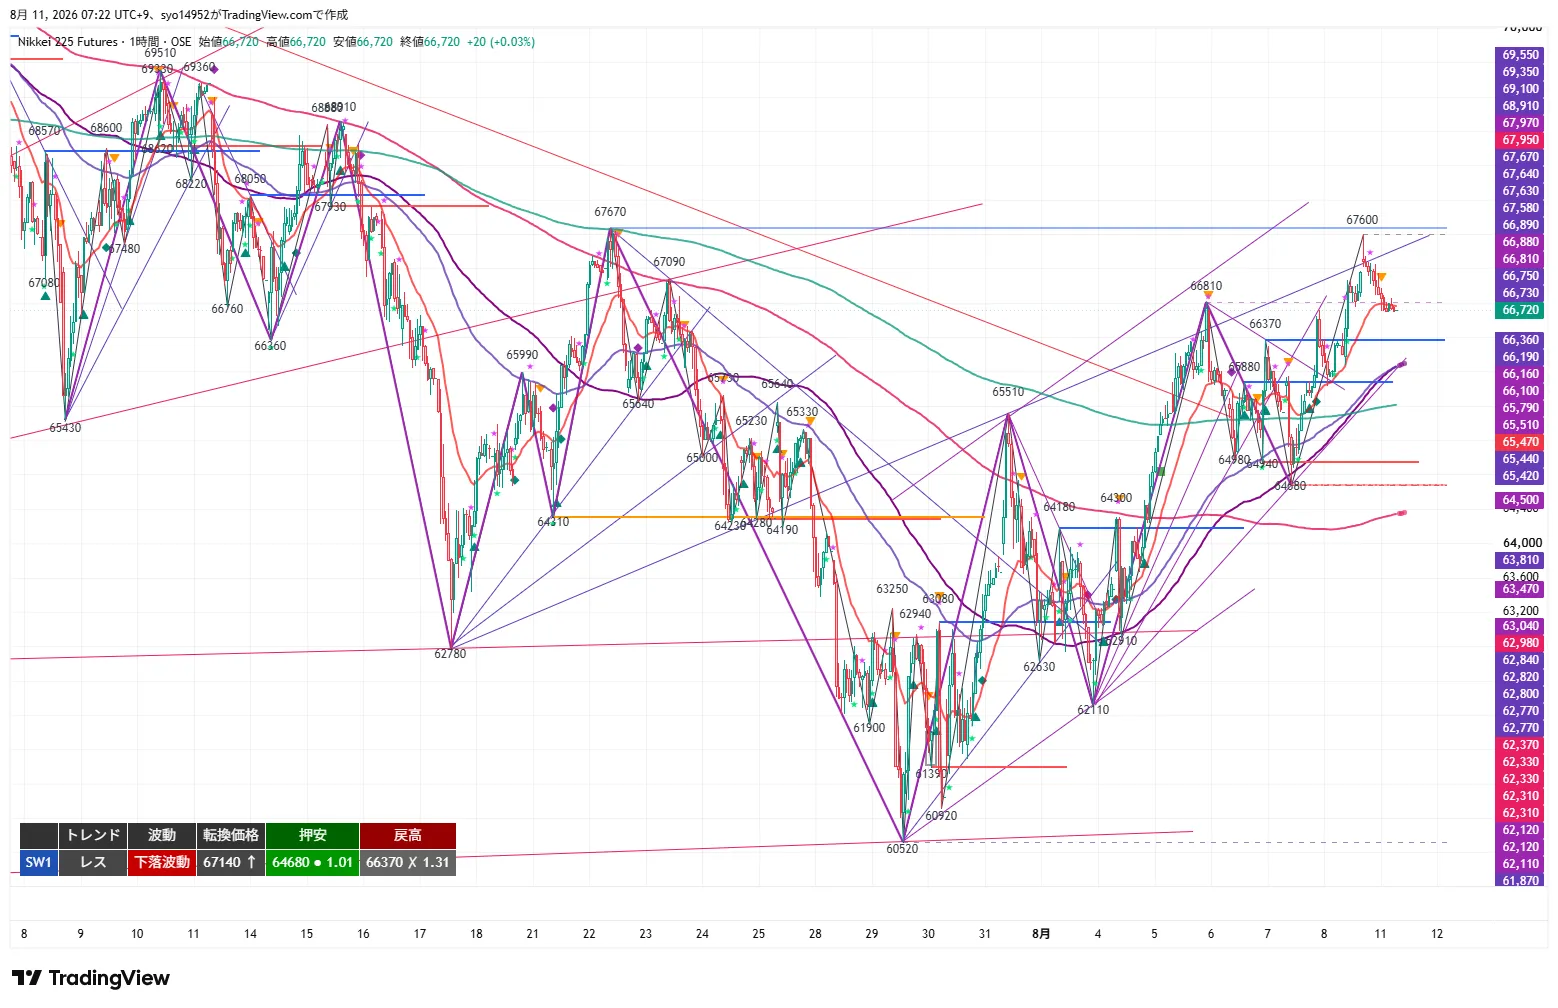
The 1H, the primary frame for structural judgment, shows a range with a downward wave. After the 66,370 breakout, price clearly exceeded the previous high 66,720 to reach 67,600, confirming continuation of the uptrend. However, it pulled back to 66,640, and the rebound point 66,750 that supported the rise to 67,600 has already been broken. The turning price is 67,140; a close above this would end the down-wave. The 20EMA around 66,900 is turning downward with price below it, and the 80EMA (4H20EMA equivalent around 66,360) and 480EMA (daily 20EMA around 65,790) are below as well.
Focus remains on two points: can we reclaim and stay above 67,600, and can we hold 66,640? A rebound to 67,250 completes the pullback, and a close above 67,140 ends the down-wave. Conversely, breaking 66,640 deepens the pullback, and breaking 66,070 (8/10 pullback low) would break the starting point of the upward wave.
15m Analysis
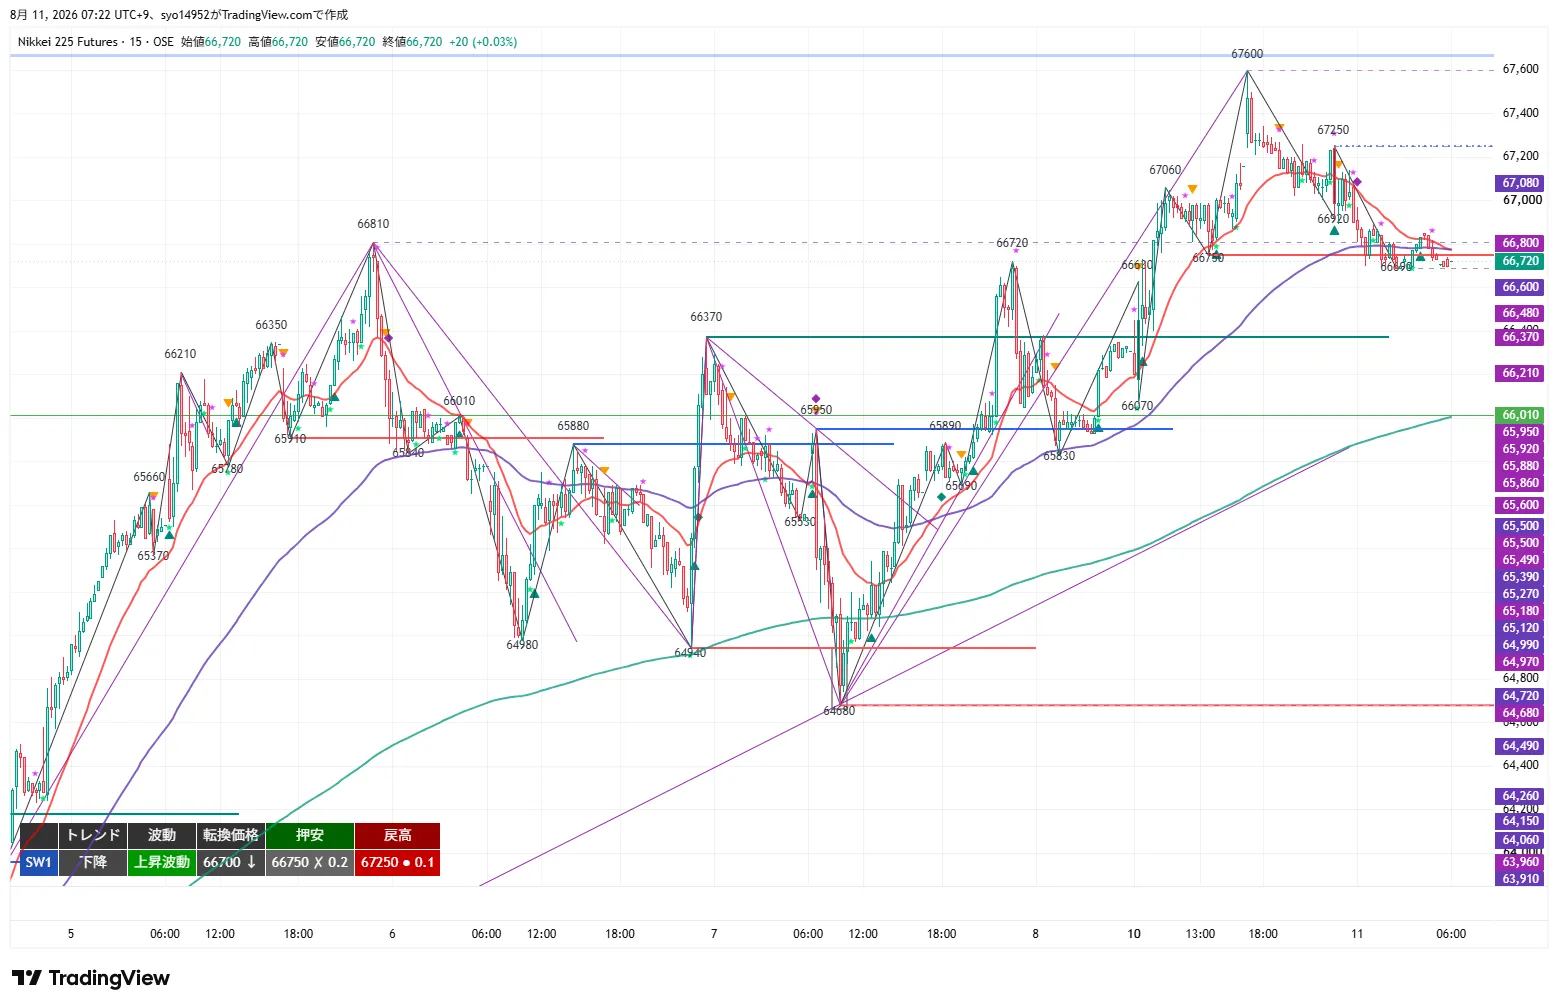
15m shows a downtrend with an upward wave. The turning price is 66,700, the pullback low 66,750 has been broken, and the rebound high is 67,250. After a slide from 67,600 to 66,640, there was a small rally to 66,720 to close. The 20EMA around 66,800 is negatively sloped, price below it; the 320EMA (4H20EMA equivalent around 66,010) is below as well.
From an execution perspective, breaking above 67,250 on 15m close marks a completed pullback and a potential entry, while a bounce in 66,640–66,750 area could provide a pullback buying signal. Since the current price sits in this pullback zone, entering solely on zone contact is not advised; wait for a bullish close to confirm a rebound setup. If 66,640 closes below, switch to a selling tone.
MTF Status
- 4H: Range / Upward wave. Price retraced to 67,600 and then pulled back to close at 66,720. Turning price 65,830; pullback low 64,680; retracement high 67,670. 20EMA rising; price above it; 120EMA below.
- 1H: Range / Downward wave. After breaking 66,370 to the upside, price exceeded the previous high 66,720 and reached 67,600 — confirming continuation of the uptrend. It then pulled back to 66,640; rebound point 66,750 has already been breached. Turning price 67,140; pullback low 64,680; retracement high 66,370 (X). 20EMA turning downward with price below.
- 15m: Downturn / Upward wave. After sliding from 67,600 to 66,640, small rebound to 66,720. Turning 66,700; pullback low 66,750 (X); retracement high 67,250. 20EMA negative slope; price below it.
- Consistency: 4H shows range/upward wave, 1H shows range/downward wave, 15m shows down/up waves; higher-timeframe upward structure remains while lower-timeframe pulls back. Focus on trend-following pullbacks and follow-Longs as the main strategy; sell orders restricted to if price cannot surpass recent highs, above 67,600. Each MA band in 1H and 15m320EMA can support the pullback zone as evidence but not as break criteria.
Important Prices
- 73,760 JPY: Daily retracement high. Upper target (for reference).
- 68,810 JPY: Daily key level. ① T2 / ③ Full retreat.
- 68,220 JPY: Higher-level node. Upper bound of Pullback Sell Zone 2.
- 67,930 JPY: 1H old pullback low. ① T2 / lower bound of Retracement Sell Zone 2.
- 67,670 JPY: 4H retracement high. ① T1 / upper bound of Retracement Sell Zone 1.
- 67,600 JPY: Night high on 8/11 (recent high). ① Core holding; ② T2 / lower bound of Retracement Sell Zone 1.
- 67,250 JPY: 15m retracement high. ① Trigger; ② T1 / ③ Core loss-cut / ④ Full retreat.
- 67,140 JPY: 1H turning price. ② Core holding.
- 67,060 JPY: Upward trajectory node.
- 66,900 JPY: 1H around 20EMA.
- 66,750 JPY: 15m old pullback low (X = breached) = resistance turn; upper bound of Pullback Zone 1 / ③ T1.
- 66,720 JPY: Current price / Night close.
- 66,640 JPY: 8/11 Night low (recent rebound point). Lower bound of Pullback Zone 1 / ③ Core holding / ④ Trigger.
- 66,370 JPY: 1H old retracement high (X = breakout) = support turn. Upper bound of Pullback Zone 2.
- 66,170 JPY: 4H20EMA vicinity.
- 66,070 JPY: 8/10 pullback low. Lower bound of Pullback Zone 2 / ③ T2・④ T1 / Core holding / ① Full retreat.
- 66,010 JPY: 15m320EMA (4H20EMA equivalent).
- 65,830 JPY: 4H turning price. ② Full retreat / ③ T2 / ④ T2.
- 64,680 JPY: 1H・4H pullback low. ④ T2.
- 62,110 JPY: 4H old pullback low.
Trading Ideas
① Breakout Follow-through (Long)
- Trigger: Break above 67,250 (15m retracement high) on a 15m close (pullback complete and upward wave resumes).
- Early entry price: 67,250. After the breakout, wait for a pullback near the breakout price or near the inclined 20MA on short timeframes (1m, 5m) for front-running (back-entry; RR based on breakout price).
- Actual entry price: 67,600 (recent high) recovered on 1H close = new high pursuit resumes.
- Stop loss / invalidation: early leg below 66,950, core below 66,640. Full retreat below 66,070.
- Targets: 67,670 (partial take + holding), 67,930 / 68,810.
- RR: T1 (67,670) = 1.4 / T2 (67,930) = 2.3. Since T1 is thin, enforce back-entry.
- MFE protection: +200 to break-even or small profit exit, +300 to secure at least +100 or trail. Since 67,670 is only 70 above the recent high, prioritize partial take.
② Pullback Buy (Long)
- Standard condition: Pull back to 66,640–66,750 (recent rebound to 15m old pullback low = resistance turn) and confirm rebound shape with 15m close. Since current price sits inside this zone, zone contact alone is not a trigger. Deep pullbacks to 66,070–66,370 (8/10 pullback low – support turn) would require stop to 65,770.
- Early entry price: 66,700. After rebound is confirmed by 15m close, ensure 20MA is turning upward and price has recovered above 20MA before entering.
- Actual entry price: 67,140 (1H turning price) recovered on 1H close = 1H down-wave ends and core holding.
- Stop loss / invalidation: early leg below 66,400, core below 66,070. Full retreat below 65,830 (switch to ④).
- Targets: 67,250 (partial take + cost basis), 67,600 / 67,930.
- RR: T1 (67,250) = 1.8 / T2 (67,600) = 3.0.
- MFE protection: +200 to break-even or small profit exit, +300 to secure at least +100 or trail. Do not extend beyond pullback zone; protect once reached. If T1 is reached on confirmation foot, consider waiting.
③ Retracement Sell (Short)
- Standard condition: In the range 67,600–67,670 (recent high – 4H retracement high), confirm a clear break above 67,600 with a 15m close but stall. Zone 2 is 67,930–68,220 (in this case, place stop at 68,320).
- Early entry price: 67,650. After stall is confirmed on 15m close, measure around recent highs with short timeframes (1m, 5m) to enter ahead of the move (avoid early entries above rising 20MA). The early position should be just above the immediate recent high; place the stop above the zone.
- Actual entry price: 66,640 (rebound point) broken on 1H close = pullback deepened and up-wave failure more likely; core holding reaches T1, add more after partial take + cost basis move.
- Stop loss / invalidation: early leg recovers to 67,950, core recovers to 67,250. Full retreat at 68,810.
- Targets: 66,750 (partial take + cost basis), 66,070 / 65,830.
- RR: T1 (66,750) = 3.0 / T2 (66,070) = 5.3.
- MFE protection: +200 to break-even or small profit exit, +300 to secure at least +100 or trail. Do not place sells below established levels. Do not chase deeply; protect as soon as reached. If T1 is reached on confirmation, skip.
④ Breakthrough Follow-through (Short)
- Trigger: Break below 66,640 (8/11 Night low = point that reversed the decline from 67,600) on a 15m close (pullback deepens).
- Early entry price: 66,640. After the break, measure around the breakout price or inclined 20MA near 1m/5m for front-running (back-entry; RR based on breakout price).
- Actual entry price: 66,070 (8/10 pullback low) broken on 1H close = start of upward wave; core holding is added after partial take and cost basis move, then if the same timeframe shows 1H close below, add core position.
- Stop loss / invalidation: early leg recovers to 66,990, core recovers to 66,640. Full retreat to 67,250.
- Targets: 66,070 (partial take + cost basis), 65,830 / 64,680.
- RR: T1 (66,070) = 1.6 / T2 (65,830) = 2.3. 66,370 has RR below 1.0, so not used for T1.
- MFE protection: +200 to break-even or small profit exit, +300 to secure at least +100 or trail. Do not place sells below the MA bands for a break; as this is a bullish reversal scenario, confirm with a clear close before core position.
Current Actions
- Most Important Line 1: 66,640–66,750. Recent rebound point – 15m old pullback low (resistance turn). The current value sits within this zone; if a rebound pattern appears, go for a pullback buy (early 66,700). If 66,640 breaks on a 15m close, triggers for ④ (early 66,640) and a break below 66,070 breaks the upward wave start.
- Most Important Line 2: 67,250–67,600. 15m retracement high – recent high. A close above 67,250 completes the pullback and allows follow-long (early 67,250; core 67,600 is recovered by 1H close). If price cannot reclaim 67,600 and stalls, consider a return sell (early 67,650).
Entry prices, triggers, and stops are set based on the chart shape at the close of each timeframe (turning price, pullback low, retracement high). If the structure changes over time but the higher timeframe structure remains, adjust entry prices using the turning prices of the lower-timeframe waves (e.g., a short-term timeframe entering a rise and then turning to a down move) to better match actual conditions, and adopt the option that better reflects reality over the initial settings.
Note: This report is for information purposes and is not investment advice; please make investment decisions at your own risk.