

[AI Market Commentary] NIKKEI225 H4 - From a Historic Plunge to a Rebound and the Outlook of the Long-Term Resistance Battle
This time, we asked AI to provide commentary on the Nikkei Stock Average's market.
The content we deliver is based on AI output, and we have made some corrections for obvious hallucinations (phenomena where information that is not factual is presented as if it were correct).
Note that the charts include indicators that I developed independently, and the explanation includes those contents as well.
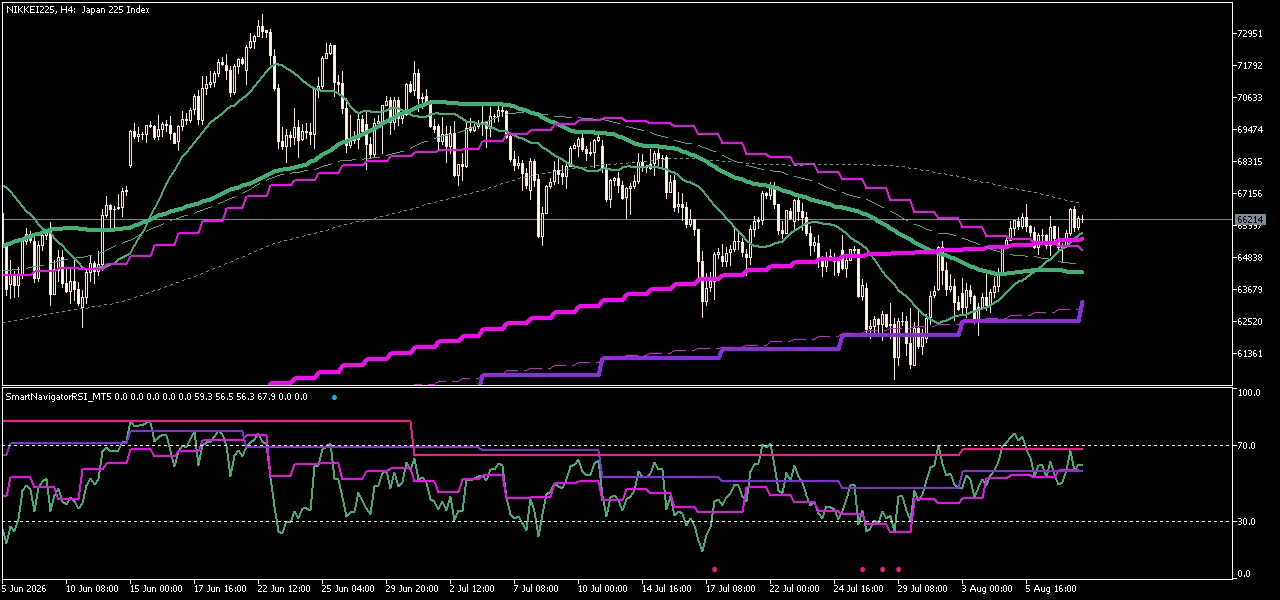
A historic crash from July to August and the subsequent rebound.
In this sharp price movement, many may have lost their sense of direction, right?
When the market is in turmoil, objective analysis free of emotion is required.
To survive, it is essential to identify signs based on objective “facts.”
Today, using multi-time frame analysis, we will unravel the current position of the Nikkei 225 and the potential scenarios for the future
Market trend so far and objective facts
First, we will review the long-term downtrend from early to mid-July
During this period, prices were below the magenta (Magenta) long-term moving average lines representing the 20 and 75 periods on the daily chart.
The medium-sea-green (MediumSeaGreen) moving average lines on the 4-hour chart representing the 20 and 75 periods were also downward, confirming a clear downtrend.
There were attempts at a rebound, but the magenta long-term MA repeatedly capped the upside
The RSI on the 4-hour chart with a 9-period in the sub-window (MediumSeaGreen) often stayed below the 50 line, indicating strong selling momentum.
However, in late July, finding a bottom around 62,000 yen, the market began to reverse upward
The notable “fact” here is that the price clearly broke above the short-term MA group on the 4-hour chart in MediumSeaGreen.
These moving averages, which had been resistance, began to function as support instead
At the same time, the RSI on the 4-hour chart also rose above the 50 line, suggesting that the buying momentum had strengthened
From early August to the present, prices have continued to rise with higher lows
They are being supported by the magenta line, a mid-term support level on higher timeframes (around 65,500 yen), and are moving steadily
Outlook (scenario construction)
The current price (66,201 yen) is in an uptrend in the short and mid term
However, it is also at a very important juncture facing a long-term resistance
Here are two possible scenarios.
【Upside scenario (bullish outlook)】
The main focus is whether the price can clearly break above the 4-hour 200MA (MediumSeaGreen) around 66,500–66,700 yen
If it can break through this long-term resistance on a price action basis and turn it into support, the upward momentum could accelerate
. In that case, the next target would be the high 68,000-yen range from early July
. Since the 4-hour RSI (MediumSeaGreen) and the daily RSI in magenta are both above 50, the environment is favorable for further rise
【Downside scenario (bearish outlook)】
The price could be capped again by the magenta long-term MA and decline
If it cannot break through the resistance and falls, first we will watch whether the short-term MA group in MediumSeaGreen can provide the initial support
If this is broken, the next important level is the magenta mid-term support around 65,500 yen
. If this level, which has been strongly in focus recently, cannot be maintained, the short-term uptrend will end and the market may test the lower levels again around 64,000 yen
. When the 4-hour RSI (MediumSeaGreen) dips below the 50 line, it is a warning sign that selling momentum has strengthened.
Analysis tools that support environmental awareness
The market environment being understood and the ability to construct precise scenarios come from the indicator groups that integrate multiple timeframes and display them together.
By accurately translating the trends from higher timeframes into the current chart, trading edge can be greatly enhanced.
The tools used in this article’s analysis can be checked below.
Smart Navigator—MA
MT4 version:
MT5 version:
Smart Navigator—RSI
MT4 version:
MT5 version:
Summary and disclaimers
Currently, price is caught between resistance around 66,700 yen and support around 65,500 yen
Focus on which line breaks and build trading strategies based on factual data