

After 12 years of trading, what remained on the chart was only the moving average line
Last week, I traded USD/JPY 64 times.
There were two accounts. Both were operating with real money.
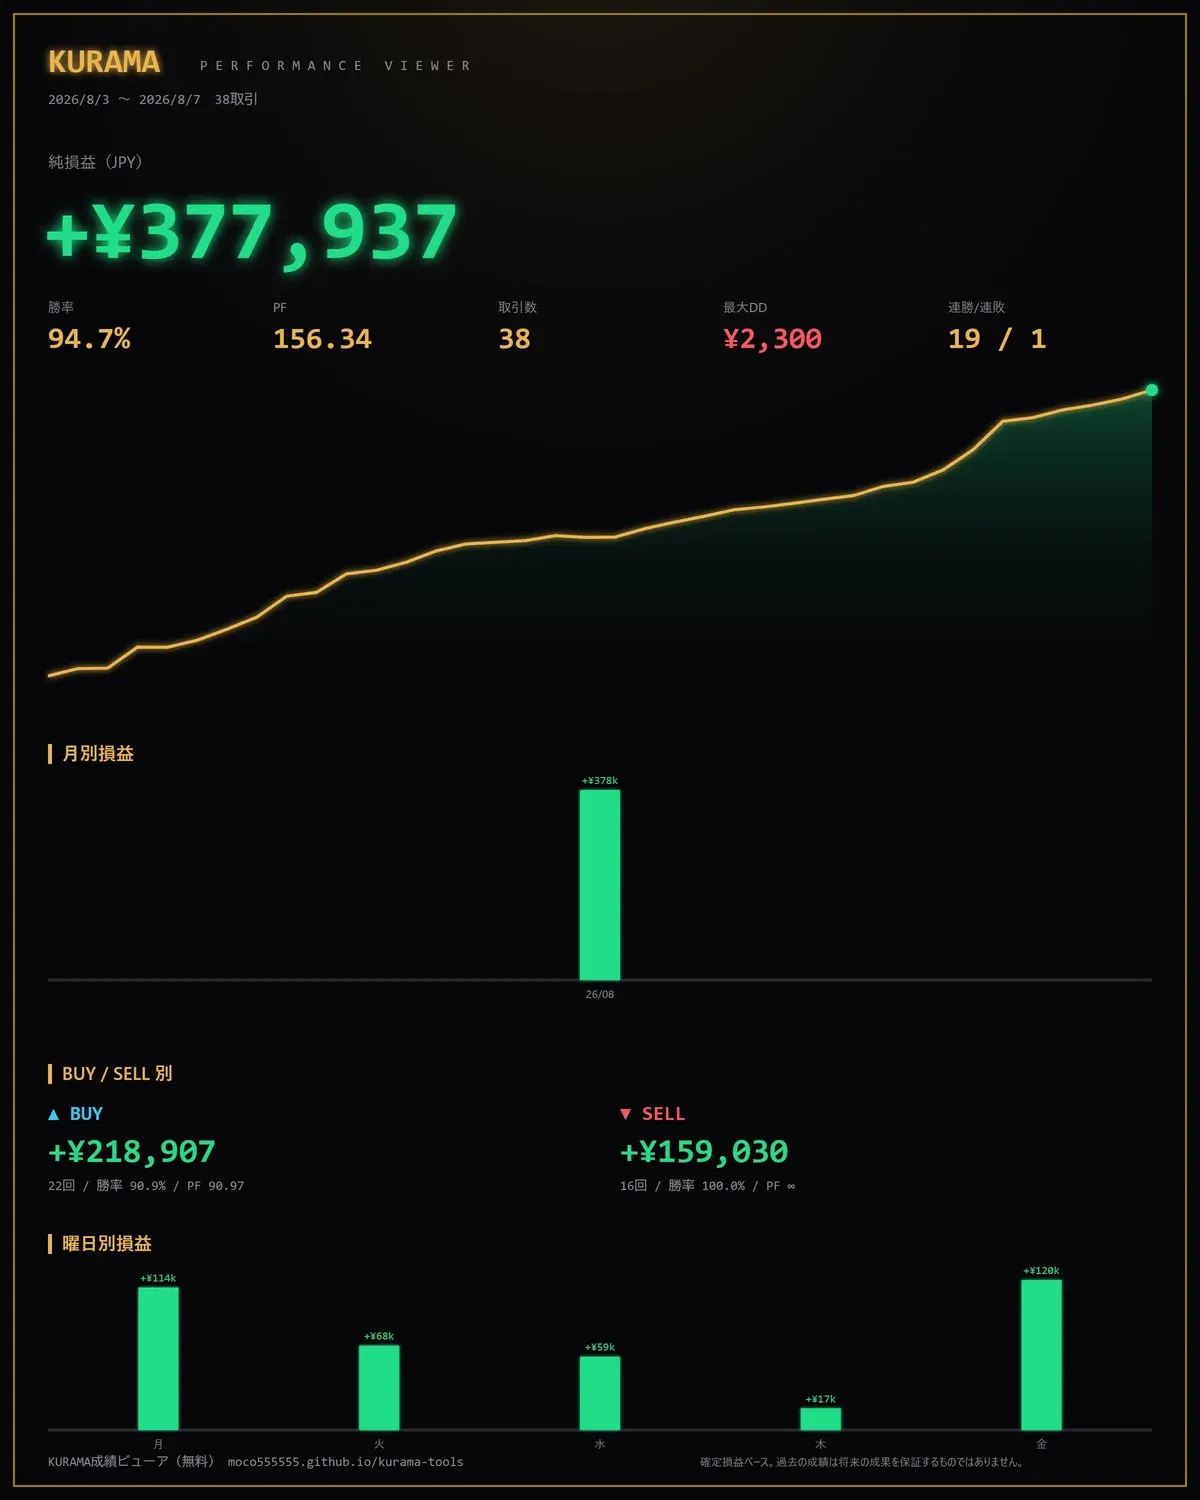
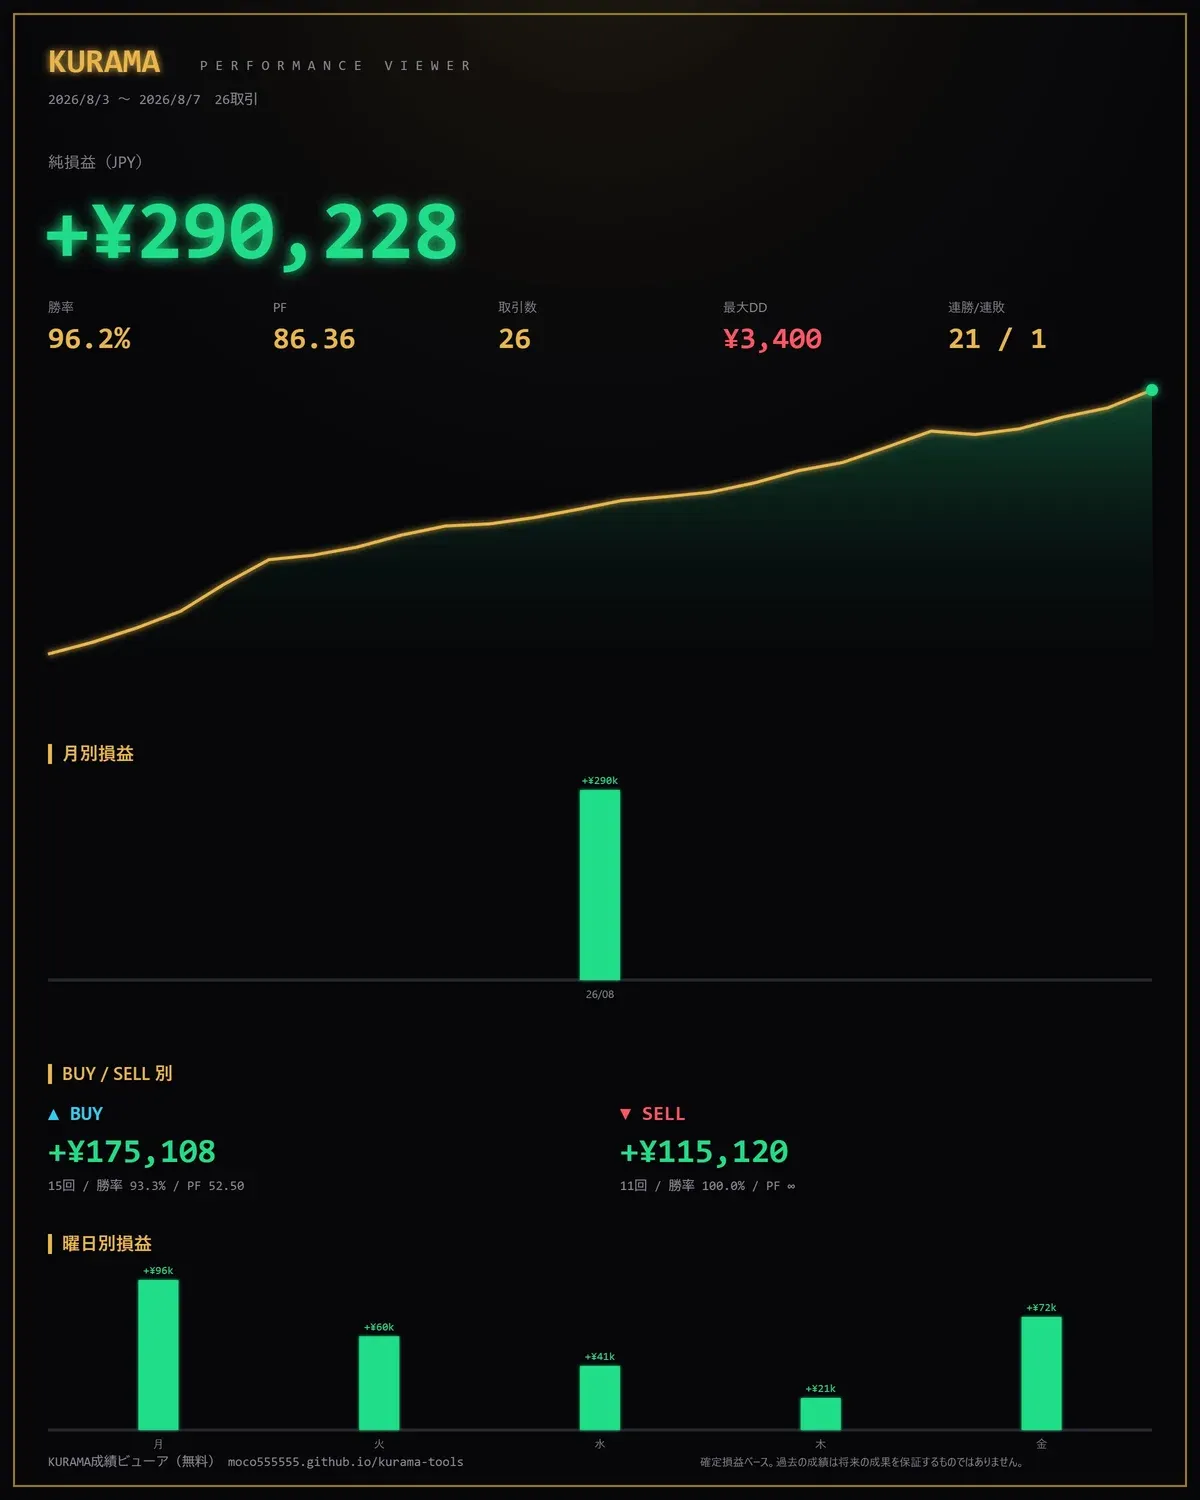
In the chart I was watching at the time, there wasn’t a single indicator in sight.
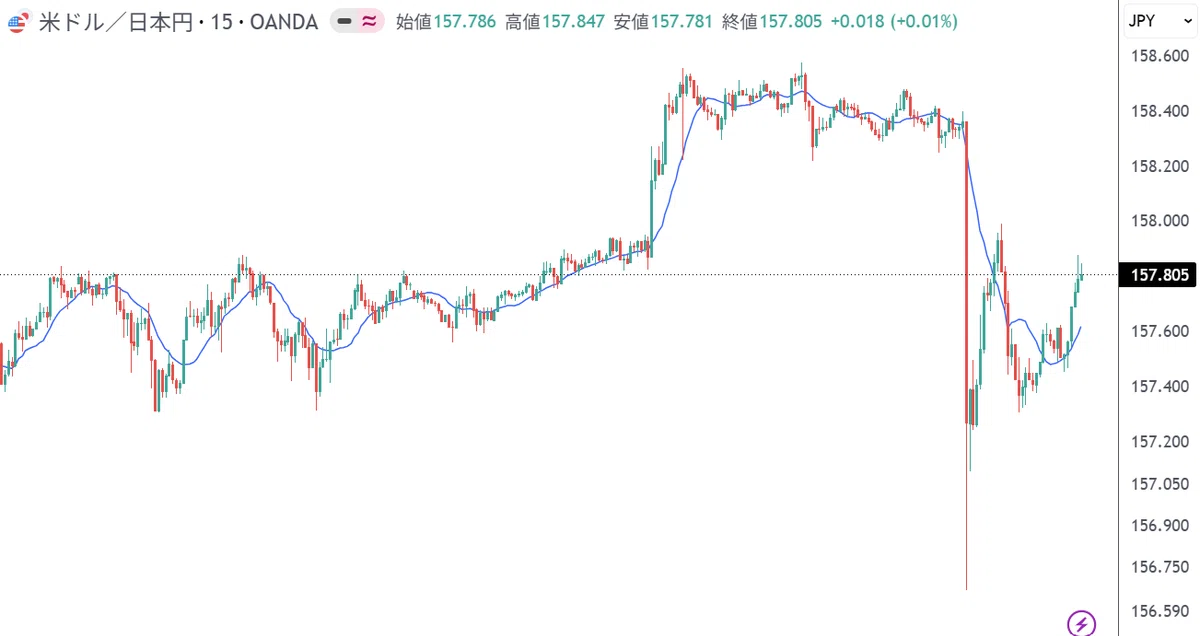
There was only a moving average.
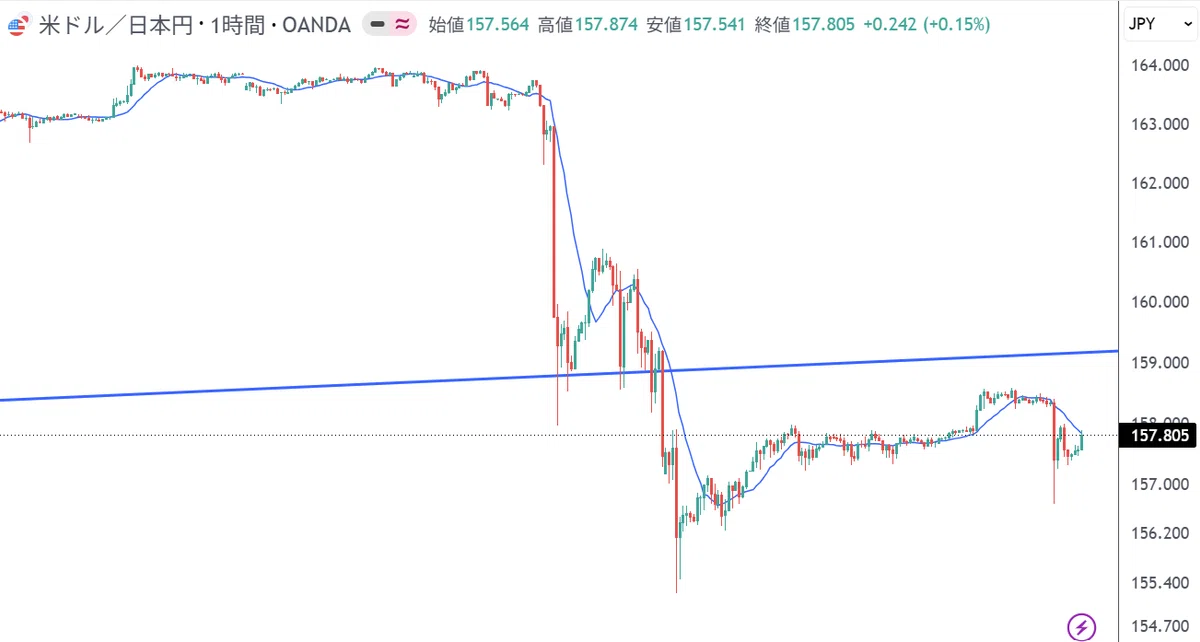
There were no flashy oscillators, no proprietary logic, no AI judgments, nothing.
In the past I used to include everything. I tried them all and discarded them all.
Today I’ll talk about that.
The period when I had eight indicators in use was the time I lost the most
I still remember the charts from that era.
There were three layers of oscillators on top. The main chart had several lines. In the sub-window, there were tools that produced arrows. I displayed them all at once.
The screen was filled with lines.
I thought I was “analyzing.”
But what I was actually doing was different.
Among the eight, I looked for the one indicating the direction I wanted to enter.
When I wanted to buy, I looked at indicators that signaled buying. When I wanted to sell, I searched for ones showing selling signals.
One of them always appeared. There were eight of them, after all.
This isn’t analysis.This is gathering material for excuses.
With that state of affairs, I emptied two accounts.
Strategy hunting is a process of putting losses outside yourself
I’ll write something blunt.
When you’re changing strategies, you won’t improve.
Suppose you try a new method 10 times, with 6 wins and 4 losses. Is it a good method or a bad one?
You don’t know. Ten attempts don’t tell you anything.
But people can’t wait. If you lose three times in a row, you decide it doesn’t fit and look for the next one.
In this cycle, no method is ever actually tested.
Whether the loss was caused by the method or by how you used it cannot be decisively separated.
The moment you acquire something new, a little bit of hope appears. That feeling is not good.
That’s not progress.You’re just relocating the reason for the losses outside yourself.
My jump wasn’t because the method was bad. It happened because I didn’t even go through the number of times required to evaluate the method.
Indicators that no one looks at don’t work in the first place
Here’s the main point.
I’m going to tell a rather fatal story.
Markets move because orders accumulate there.
If many people think, “I’ll buy at this price,” the price will react. If few people do, nothing happens and it passes by.
In other words,the number of participants directly determines the effect.
So what about complex, rare indicators?
How many people in the world are watching them?
Hundreds, at most thousands. In the overall market, it’s a margin of error.
Even if the number of people who think “I’ll buy here” is a margin of error, the price won’t move even 1 millimeter.
Being rare alone puts you at a disadvantage.
That was the reason eight indicators didn’t work for me back then, in the end.
Moving averages don’t work because the formula is superior
The opposite of that is moving averages.
Everyone is watching them. Individuals, institutions, algorithms.
That's why it happens like this.
Many people see the same line → orders cluster near that line → prices actually react there → because they react there, even more people look at it
Self-fulfilling prophecy.
This is easy to misunderstand.
Moving averages don’t work because the formula is superior.They work because everyone is watching them.
More than correctness of theory, the number of people matters.
The market is decided by majority rule. And moving averages attract an overwhelming share of votes.
Reducing the number of lines means preventing yourself from making excuses
“Moving averages are something beginners learn first, right?”
I used to think that too. Therefore I looked for something more sophisticated.
It was completely the opposite.
Moving averages are basic because they’re for beginners. They became basic because everyone uses them.They work because everyone uses them.The order is reversed.
And, simplicity has another effect: it makes convenient interpretations impossible.
If you only look at one thing, there’s little room for doubt.
If you have five indicators, there will always be scenes where two indicate buy and three indicate sell. At such times, people adopt the side they want to enter.
Reducing lines isn’t just about making the chart visually tidy.It’s about not letting yourself make excuses.
The same thing works across different instruments
And here’s probably the biggest point.
Moving averages don’t discriminate by currency.
The reason it works in USD/JPY and in gold is the same: “Because many people are watching.”
This doesn’t change for euro/dollar, pound/yen, or stock indexes. In markets with participants, it works for the same reason.
What does this mean?
Once you master it, you can apply it to all instruments.
Many people try to have a separate method for each currency pair. A USD/JPY method, a gold method. Each time you increase instruments, you have to relearn.
There’s no need for that.
I watch USD/JPY and gold, but my decision process hasn’t changed. The time of day and price range tendencies differ, so I adjust those. But the part of “what I base my entry on” is the same.
That’s why it’s quick to start a new instrument.
You don’t need to buy a new method for each instrument.
It’s a quiet thing, but over time it’s quite effective.
I think the key is whether anyone would make the same judgment
There’s one more thing I place importance on.
Reproducibility.
If the same situation were seen by tomorrow’s me or by someone else, would the same judgment result?
Methods that are vague do not last.
Judgments like “seems strong” or “likely to rebound soon” depend on mood and cannot be validated. If you lose, you don’t know what to fix.
Conversely, if conditions are clearly defined, this happens.
・You can later verify the moments you didn’t enter
・When you lose, you can tell whether you followed the conditions
・You can explain it to others
Moving averages enable this “clearly defined” approach. The relationship between line and price is visible to anyone who looks, so everyone sees the same thing.
There’s no need to read subtle shapes of oscillators.
Anyone can see the same thing. Therefore, it’s repeatable.
From here, I won’t write about this in the article
What you’ve read so far is the portion I can publish.
So how exactly do you judge moving averages in practice?
Which period do you use? What state is “enter” and what state is to be passed over?
I won’t write those down.
It’s the part I spent 12 years refining, and honestly, it’s the entire point.
Anyone can say “look at moving averages.” It’s also in textbooks.
But I have never seen someone win just by reading the textbook.
What’s missing is the standard for judgment.
I verify it in real-time every week
I don’t want to end with just the thinking, so I’ll share actual practice.
Every week I trade with real money.
And before I enter, I post a scenario with X. I write predictions like “I’ll pull back here” or “this will rise here” before it moves.
Sometimes I’m wrong. When that happens, the wrong moves remain as they are.
Last week’s USD/JPY, combining two accounts, I entered 64 times. The result ended up positive.
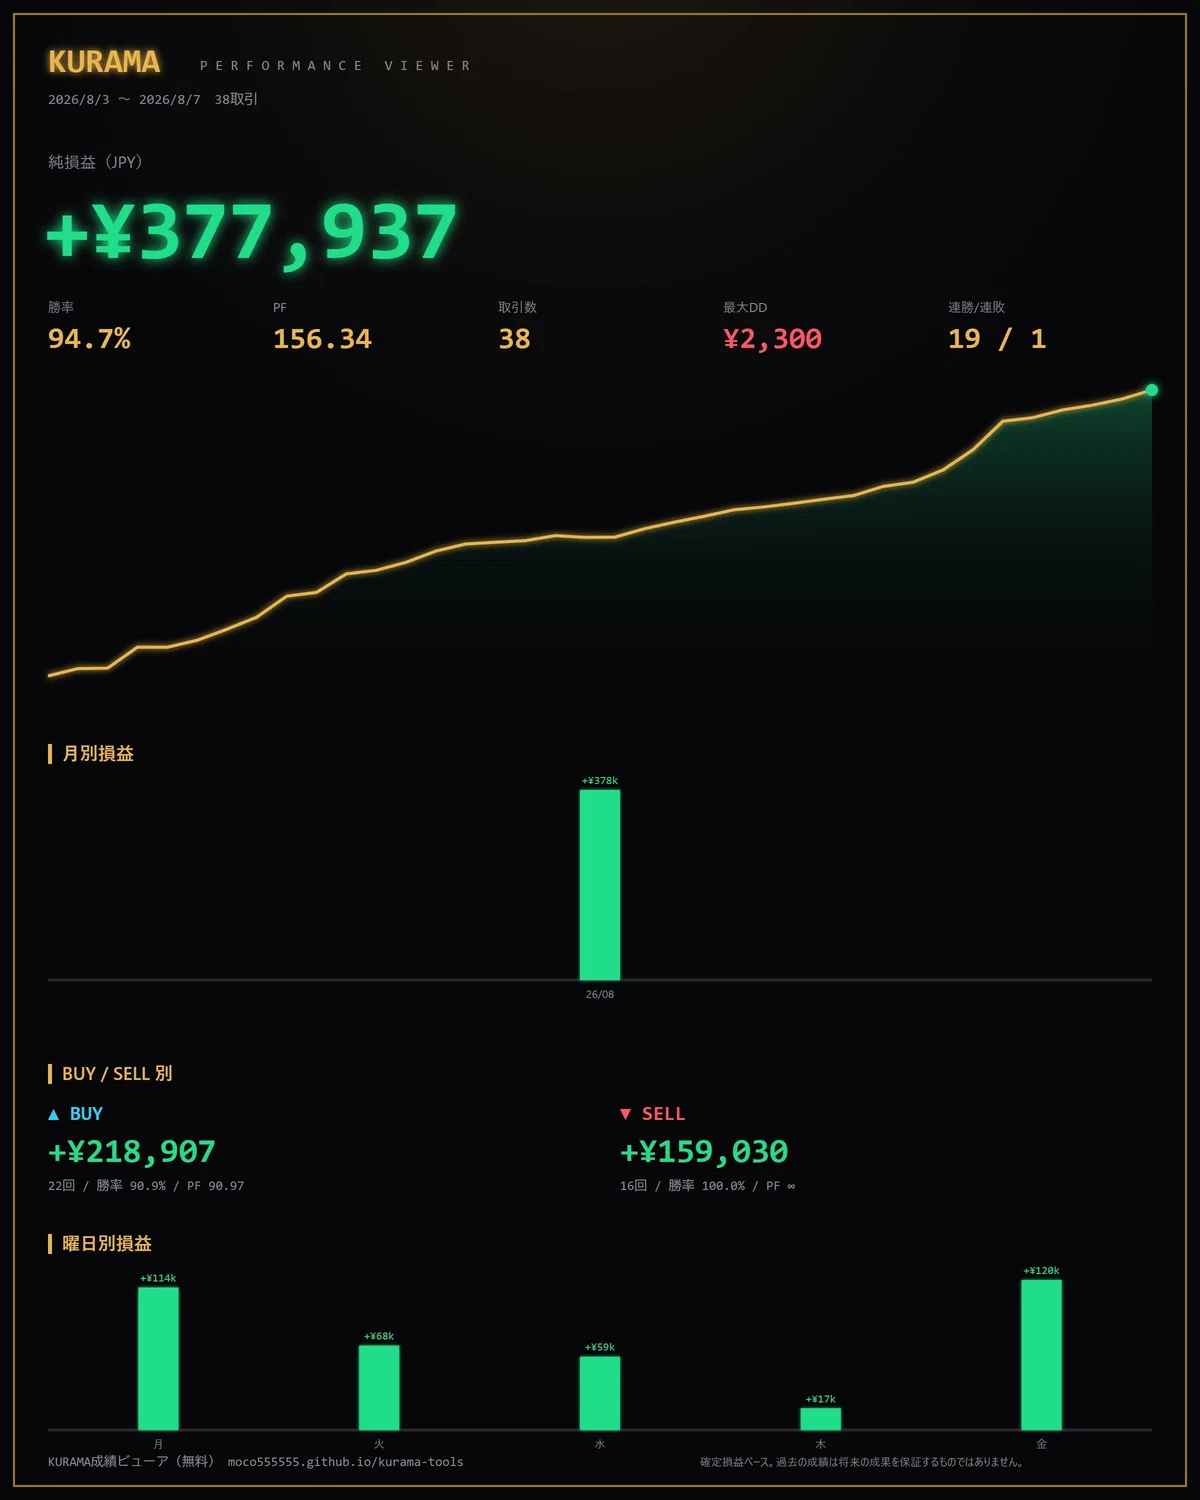
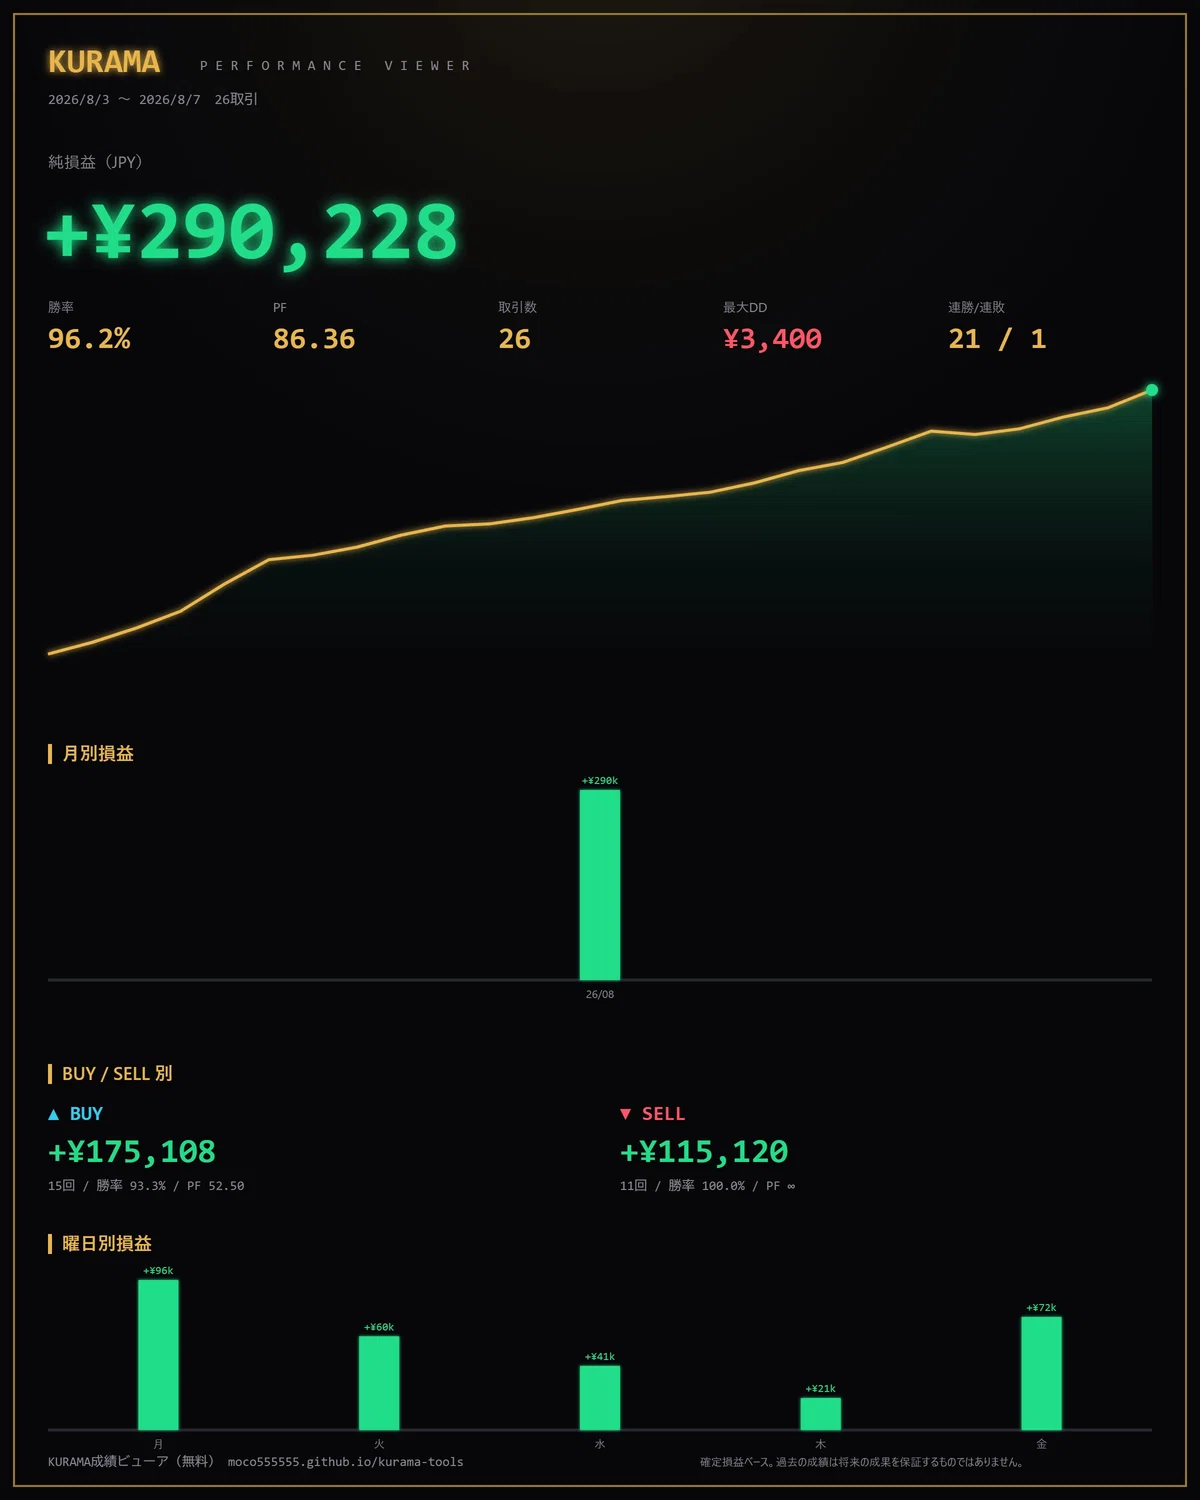
What matters isn’t the amount of money.
All 64 entries were judged solely by moving averages.
There’s nothing else on the chart. Therefore there’s no other basis for judgment.
After 12 years, I’ve concluded this suffices.
Even what I’m building is ultimately just automation of this
I’m also creating indicators. Let me write about that as well.
But that isn’t new logic.
It’s merely judging the lines everyone is watching with the same standard each time.
What I wrote earlier as “reproducibility”—I’ve put the task into a machine. It’s nothing like a groundbreaking invention.
Why have a machine do it?
Because humans relax their standards when tired.
“I haven’t entered today yet” “This should be okay”
That’s how we soften conditions. I do it too.
So I have the machine make the judgments.Not an invention, but a tool to prevent compromise.
What’s truly difficult isn’t remembering things
Finally, I’ll be honest.
The way of thinking about moving averages is easy to memorize. I believe you can understand what I wrote here just by reading it.
That isn’t the problem.
It’s being able to open your own chart and judge for yourself.
“Is this situation a valid entry?” “Was that yesterday’s decision to be avoided?” “Am I judging by the same standard as yesterday?”
Self-study, this is where you hit a wall.
There’s no one to tell you the correct answer. So your judgments waver. When you lose, you don’t know what went wrong.
Because you don’t know, you go in search of a new method again.
You’re back at square one.
Returning to the beginning of this article.
I’ve blown through years in this way. If only one person beside me had said, “That’s not right,” I probably could have finished in half that time.
What to memorize is less important than aligning judgments.
That, I’ve come to believe, is the most effective approach.
Summary
・The period when I had eight indicators in use was the time I lost the most
・More lines lead to interpretations that favor oneself
・Strategy hunting is a process of relocating the reason for losses outside yourself
・Indicators that no one watches don’t work. The number of participants determines the effect
・Moving averages work not because they’re correct, but because many people are watching
・The same reason works across different instruments. There’s no need to relearn
・What matters is reproducibility. Will everyone see the same judgment?
・The hard part isn’t memorizing; it’s learning to judge for yourself
How many indicators are currently on the chart?
Among them, how many are dispensable?
Probably most of them.
I’ve compiled the part I didn’t write about “the standard for judgment” into a教材.