The use of "Visual Indicator" (Part 263)
“Visualization Indicator” usage(its 263)
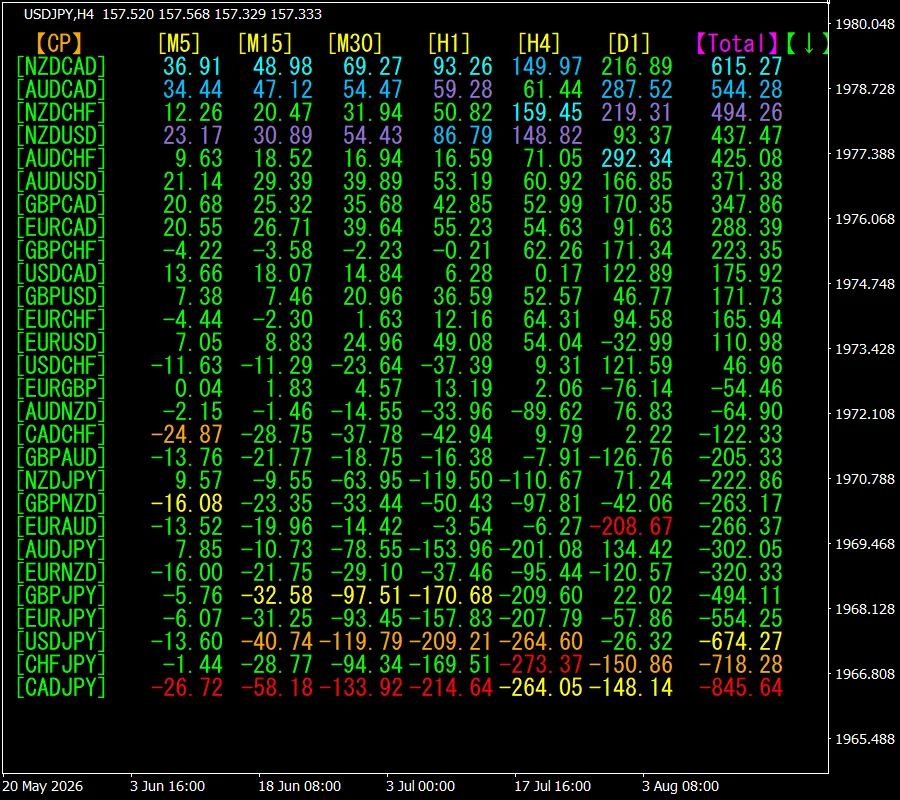
“28 currency pairs list indicator” to evolve further into indicators
“8CP Visualization Indicator”でCADJPY を描く
“8CP Visualization Indicator”にはOceania版、London版、NewYork版、AnyCP版があります。今回はNewYork版を使いました。
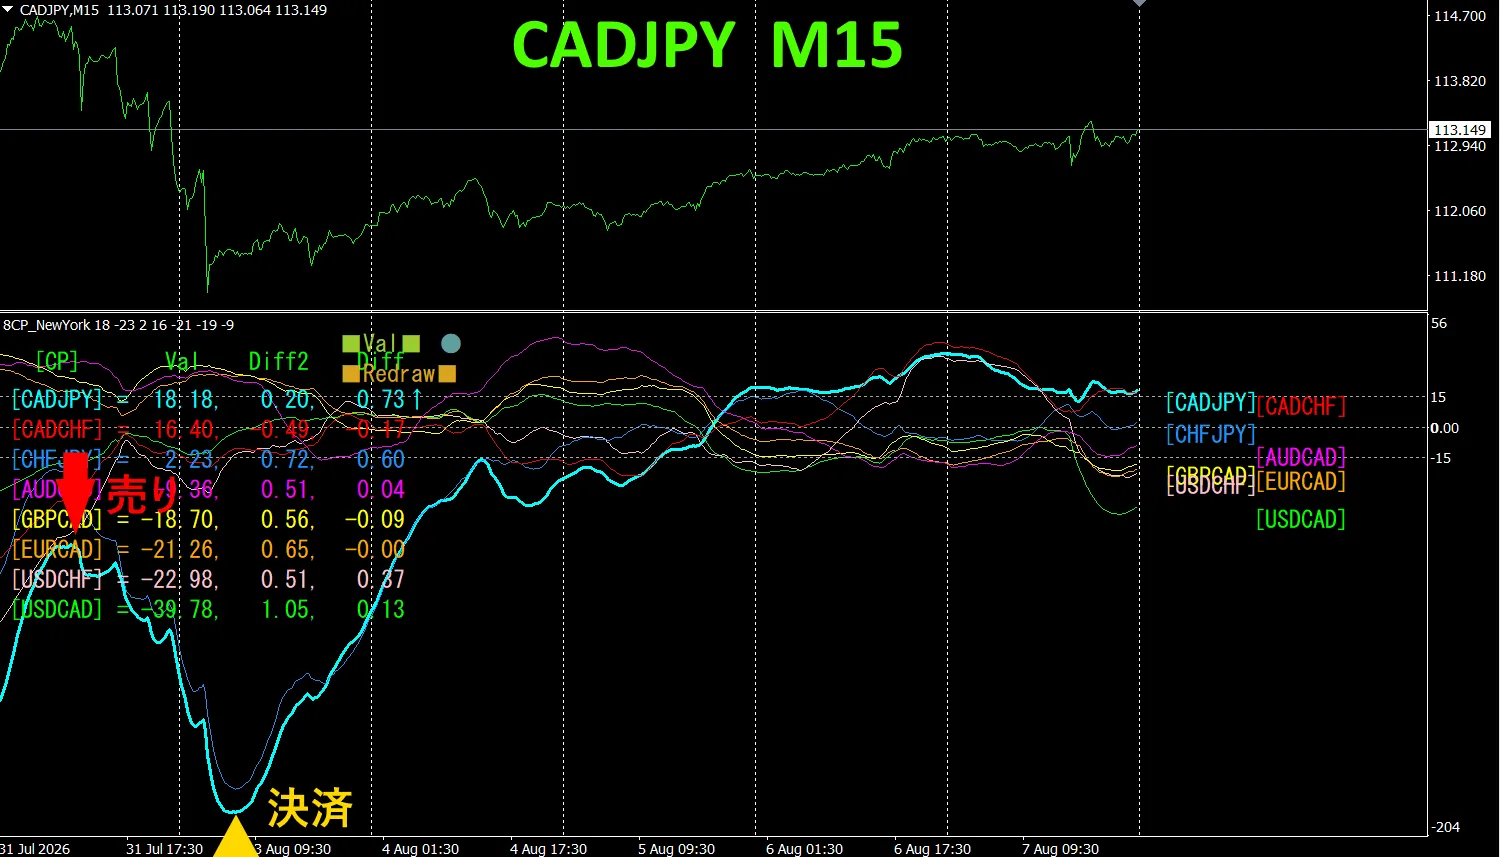
Upper half shows、CADJPYの15分足チャートです。下半分は「8CP Visualization Indicator」によるものです、水色太線のグラフがCADJPYに相当します
Last weekend, CADJPYグラフが他のグラフ群から下に勢いよく抜けてきたので、売ります月曜日の底で決済して約180pipsの利益が得られました
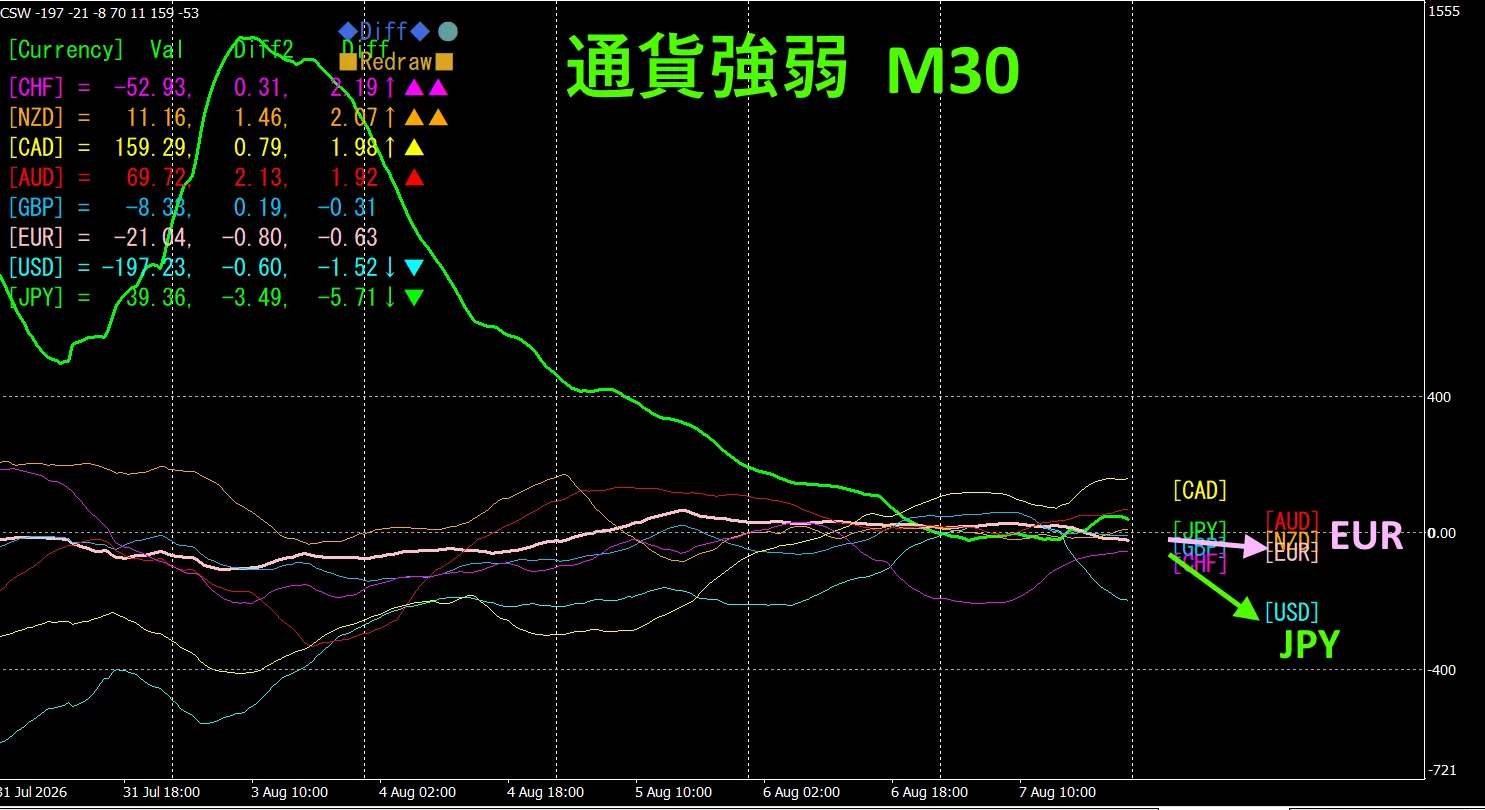
Currency Strength/Weakness Graph
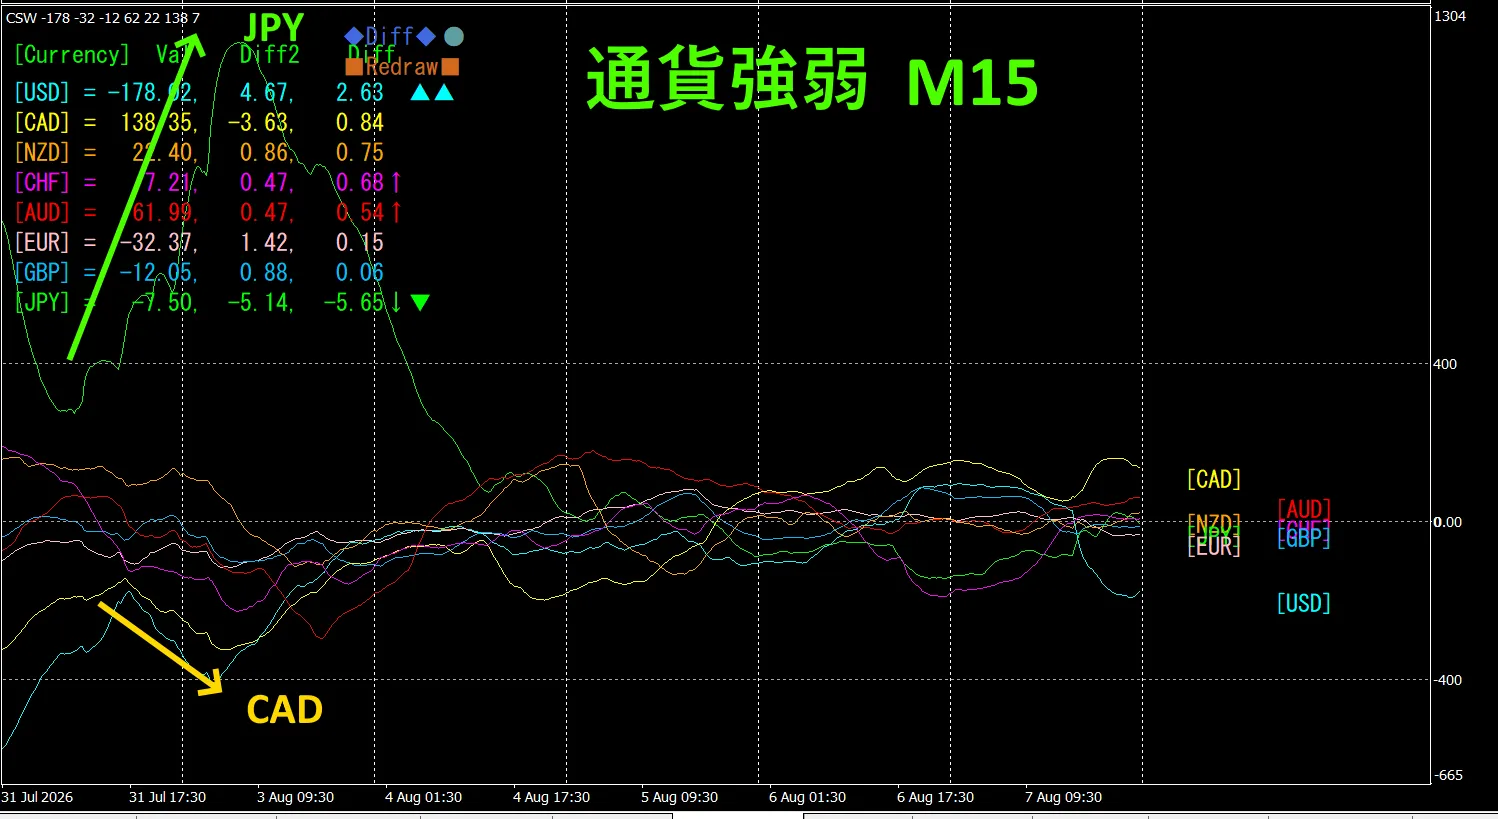
Looking at the 15-minute currency strength graph, JPY and CAD are in an inverse correlation.Because JPY > CAD
Try the indicator
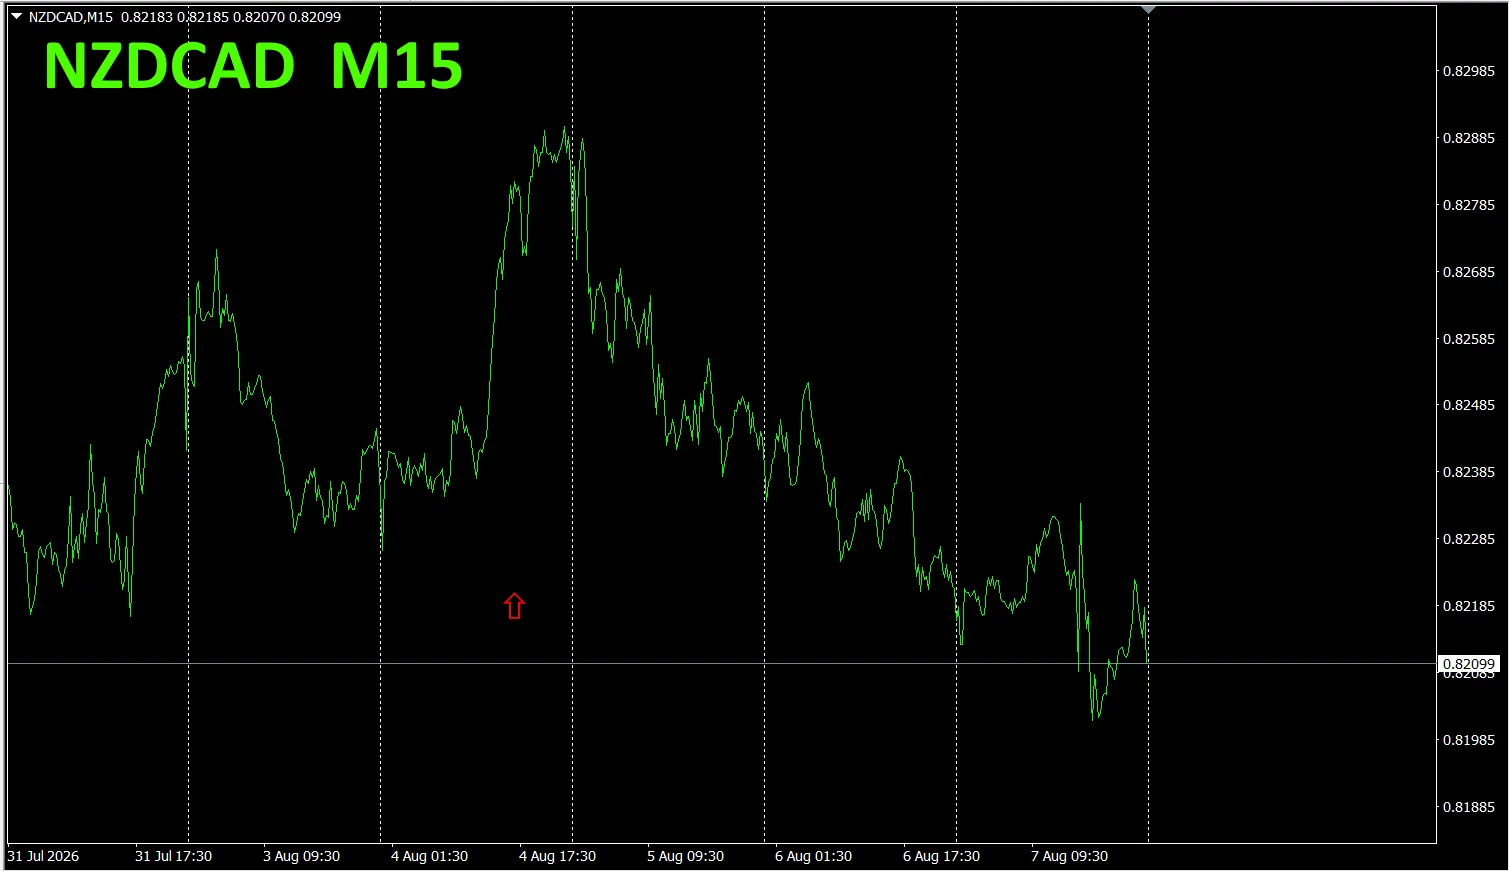
”

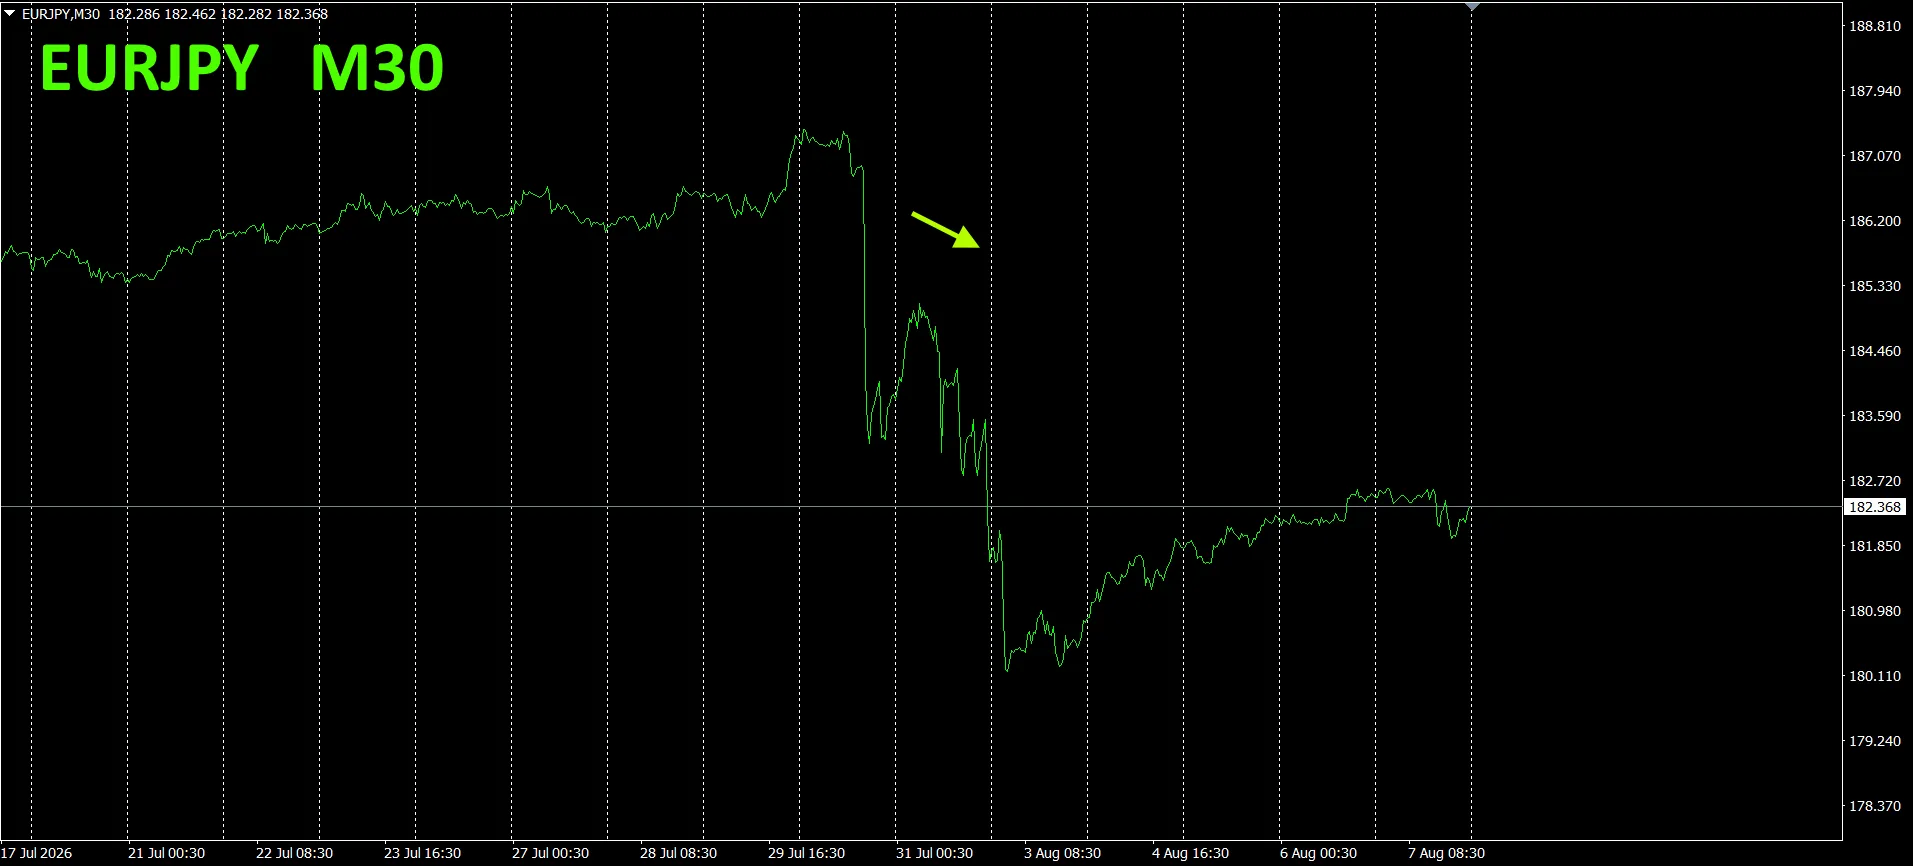
3. Since May 2021, the EURJPY movement has been tracked; what happened??
4. Tried new indicator Dual_MACD_Trend_Indicator
New Indicator“Dual_MACD_Trend_Indicator”.
This indicator clearly shows trend direction by color.
The red area for selling and the green area for buying are clearly separated, making trading easier at a glance.
“Dual_MACD_Trend_Indicator”.
Using the Dual_MACD_Trend_Indicator removes any doubt about trade direction
※ Note: The Dual_MACD_Trend_Indicator
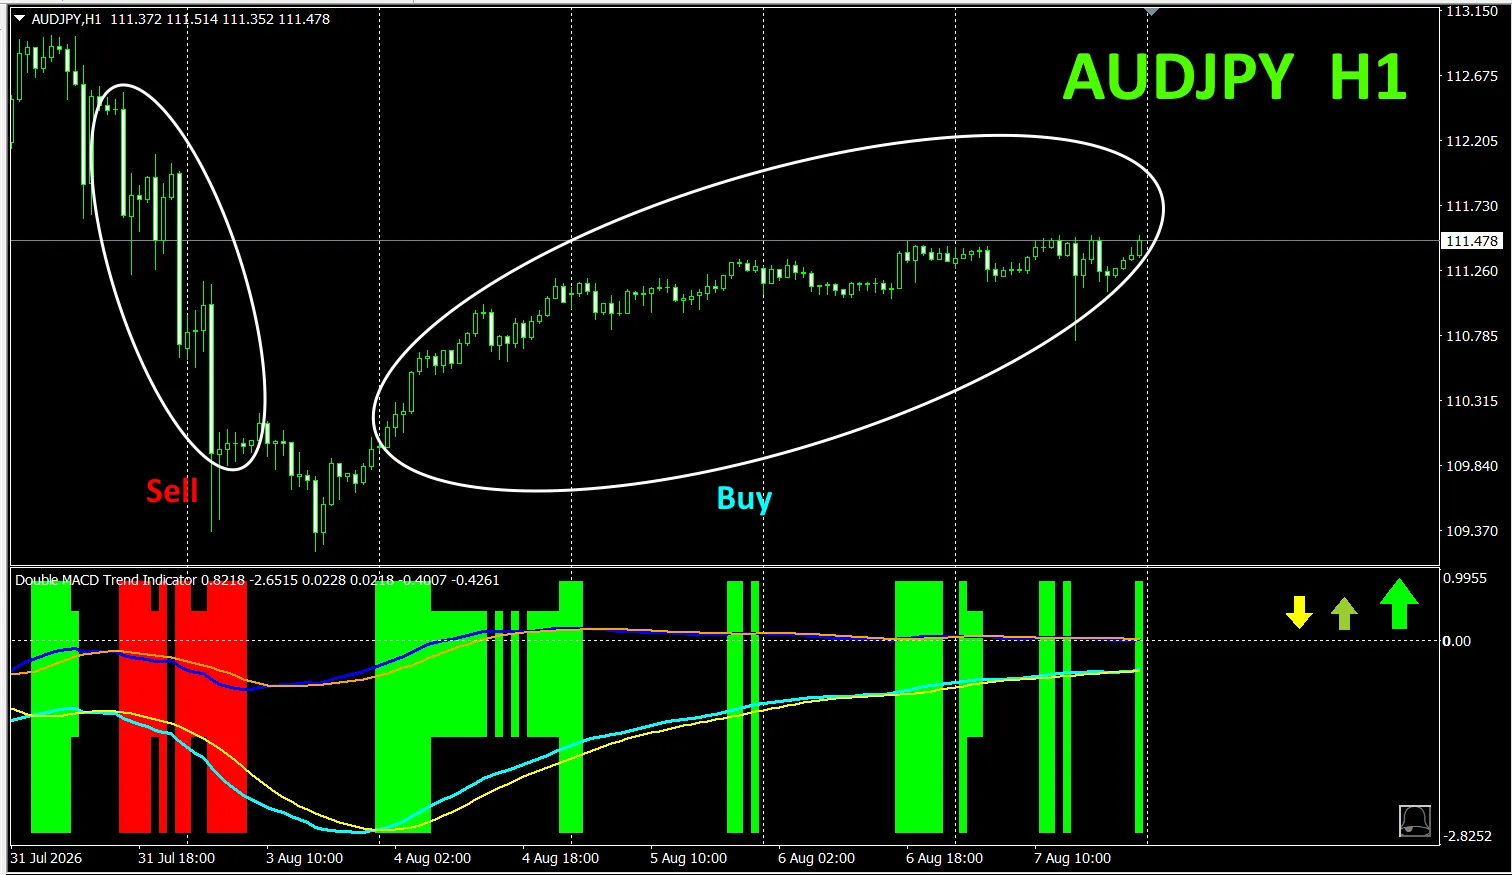
As an example.
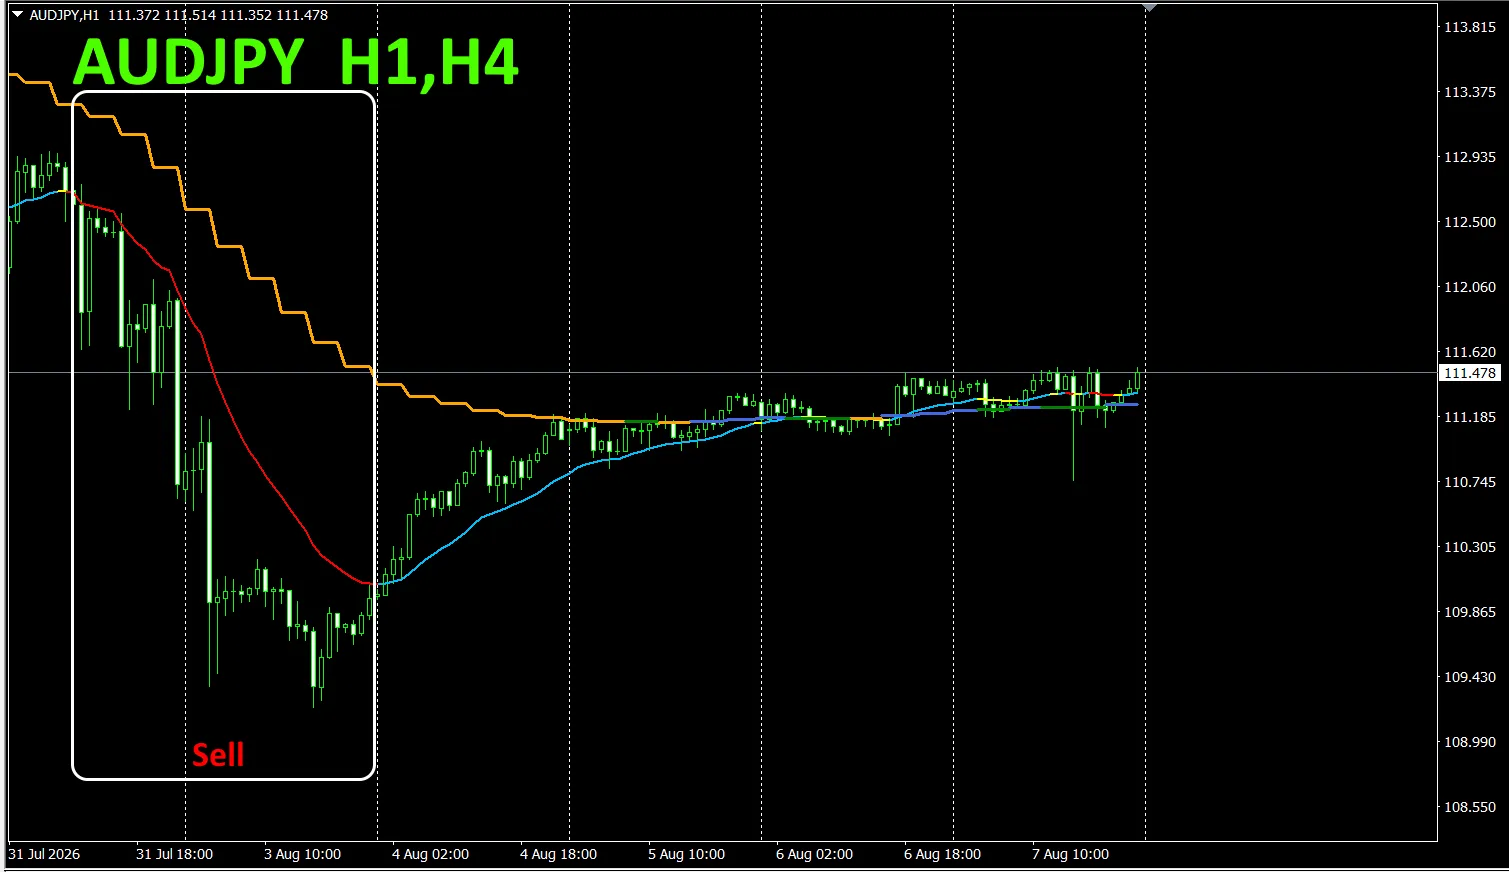
When the colors of the higher timeframe and the current timeframe align in the same hue,
In the upper diagram, focus on the area enclosed by the white square to trade sells.
For details, please see the following link.
https://www.gogojungle.co.jp/tools/indicators/75985
「8CFD」

https://www.gogojungle.co.jp/tools/indicators/32288
「」
https://www.gogojungle.co.jp/tools/indicators/50115
「TrendLine-EX」

https://www.gogojungle.co.jp/tools/indicators/42257
“8 Currencies Strength Visualization Indicator”。

MT4 https://www.gogojungle.co.jp/tools/indicators/39150
MT5 https://www.gogojungle.co.jp/tools/indicators/39159
【