

2026/08/08 Pound-Dollar Yuri (Yuri) market analysis
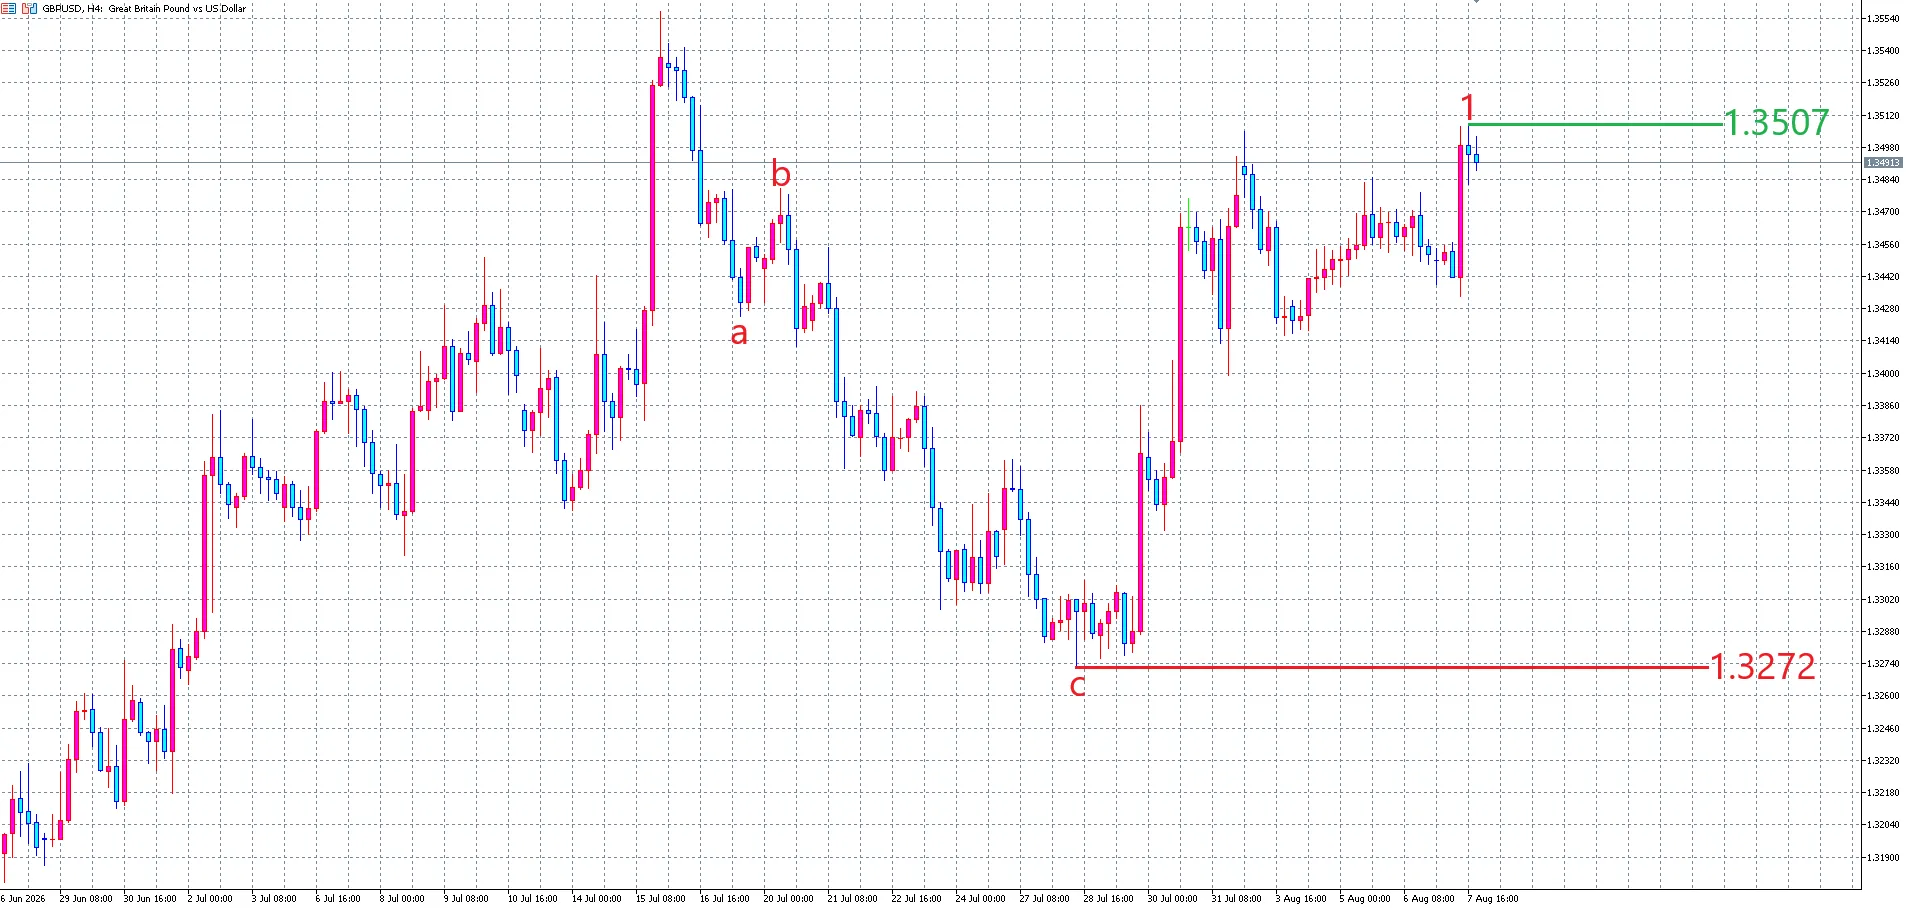
This is the four-hour chart of the pound-dollar.
The four-hour Elliott Wave is currently the first wave of an uptrend Elliott Wave.
The four-hour cyclered lineoriginates from the starting point, and we are currently viewing 51 scenarios.
The four-hour Elliott Wave might look like the third wave of an uptrend, but since the four-hour cycle is currently at 51 bars to the top time, there will be a decline toward the four-hour cycle bottom, so labeling it as the third wave is unlikely.
Therefore, the four-hour Elliott Wave is counted as the first wave of an uptrend.
The monthly Elliott Wave is currently the third wave of an uptrend, and the monthly third wave is formed by the weekly waves 1–5.
Thus, the weekly Elliott Wave is forming the current uptrend Elliott Wave.
The weekly Elliott Wave is presently the third wave of an uptrend, and since the weekly third wave is formed by the daily waves 1–5, the daily chart is in the process of forming an uptrend Elliott Wave, so the mid- to long-term uptrend will continue for a while.
The primary cycle started at the previous major cycle’s starting point (1.3139) with the bottom at the 34th low, so the primary cycle began at the previous major cycle’s starting point (1.3139), and we are currently viewing seven scenarios.
Therefore, there is still room for further upside in the primary cycle as well.
The previous four-hour cycle formed a left translation, and the current four-hour cycle is more likely to form a right translation, so the major cyclered lineis likely to have started with a shorter duration.
Therefore, there is ample time for an upward cycle.
From this situation, the four-hour Elliott Wave is currently the first wave of an uptrend, and there will be a decline in the four-hour second wave, with the low of the four-hour second wave expected to become the four-hour cycle bottom.
This four-hour cycle is a right translation, so the second wave will never drop below the starting point of the first wave,red lineand will not fall below it.
The current uptrend Elliott Wave on the four-hour chart corresponds to the third wave of the daily uptrend, and there is still upside in the daily fifth wave.
Therefore, the next four-hour Elliott Wave will also form an uptrend Elliott Wave.
Both the four-hour cycle and the major cycle must form a right translation to rise to the daily fifth wave, so this major cycle will form a right translation, and the next four-hour cycle will also form a right translation.
From the above situation, I am looking at the market with a bullish bias.
As a trading strategy, I am aiming to go long near the bottom of this four-hour cycle.
Place a stop-loss for the long position around the low that you think is the four-hour cycle bottom.
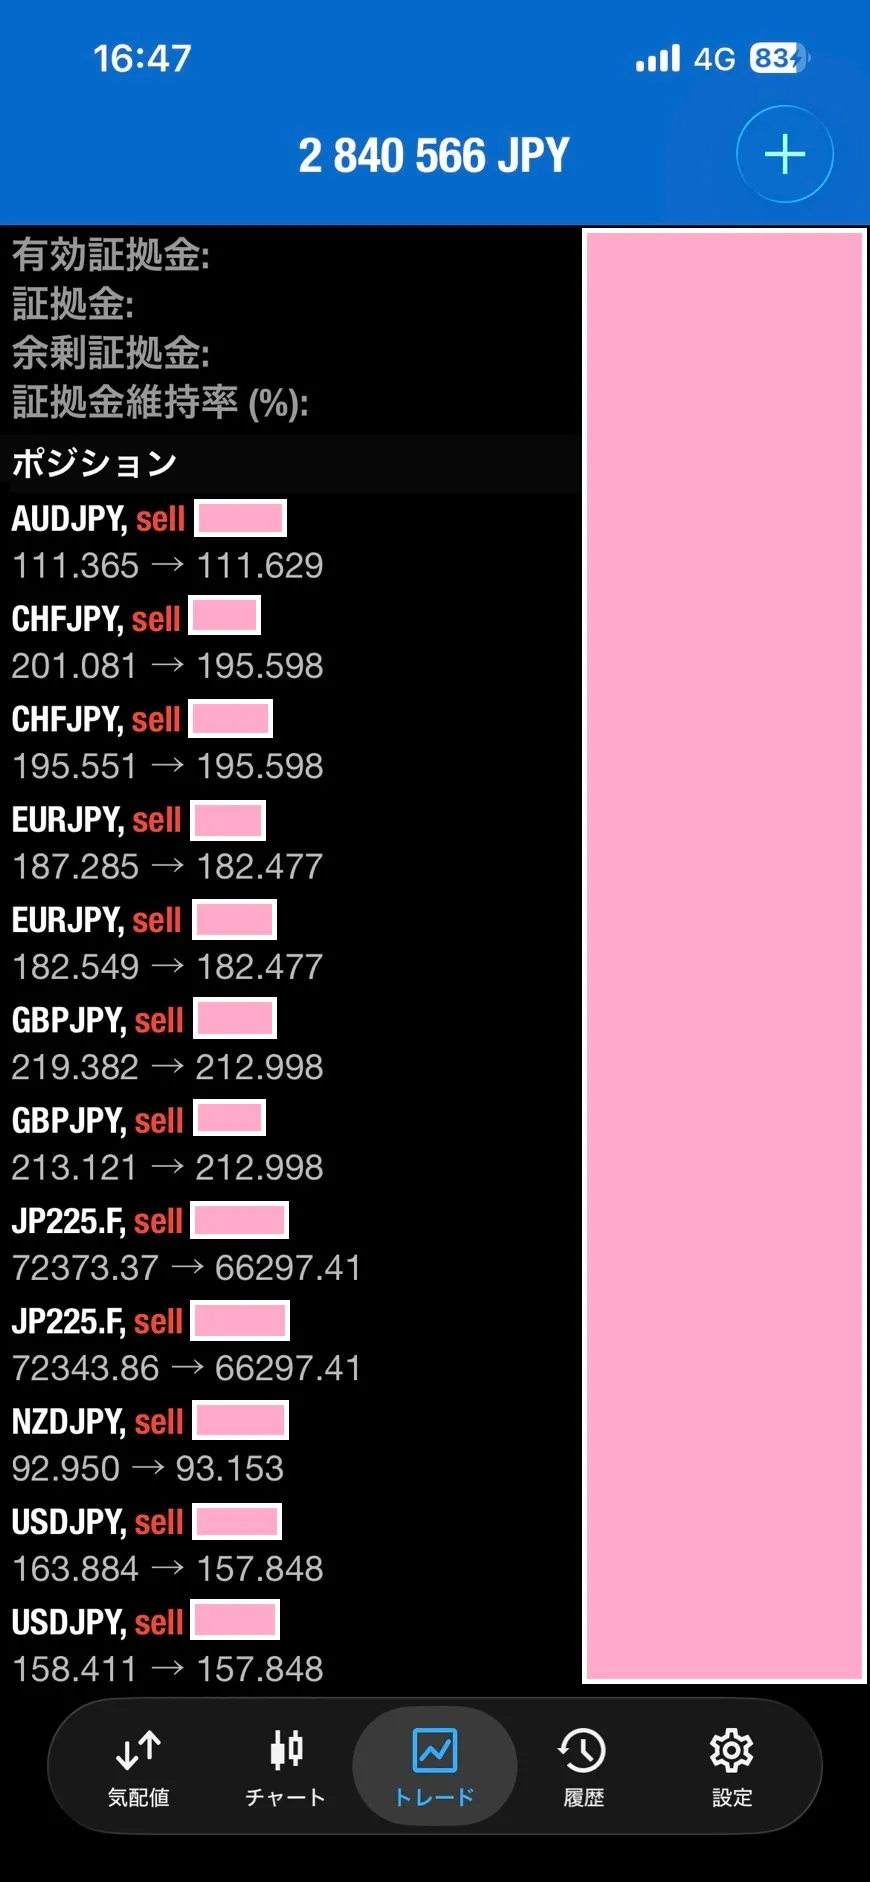
Current position.
The CADJPY short was-12 pipsand was stopped out.
The Nikkei average (72373.37) short position has already realized 50% of the position, so even if the stop is hit later, it will not become a loss financially.
Current unrealized profit is+14295 pips, right?
Although employment data fell, it did not continue to decline further.
The four-hour cycle for cross-yen pairs is at the top time, so even if there is a new high, I will look to enter short from Monday.
Cross-yen pairs are in a long-term downtrend, and dollar crosses are in a long-term uptrend scenario.
Therefore, I generally view cross-yen and dollar-strength as moving inversely to each other in the market.
As of 2026, the accumulated profit is+4015 pips❣️