

2026/8/8 Dollar-Yen, Gold, SP500, and Nikkei 225 environment

For verification purposes, we provide a weekly video of the USD/JPY price movement.
USD/JPY
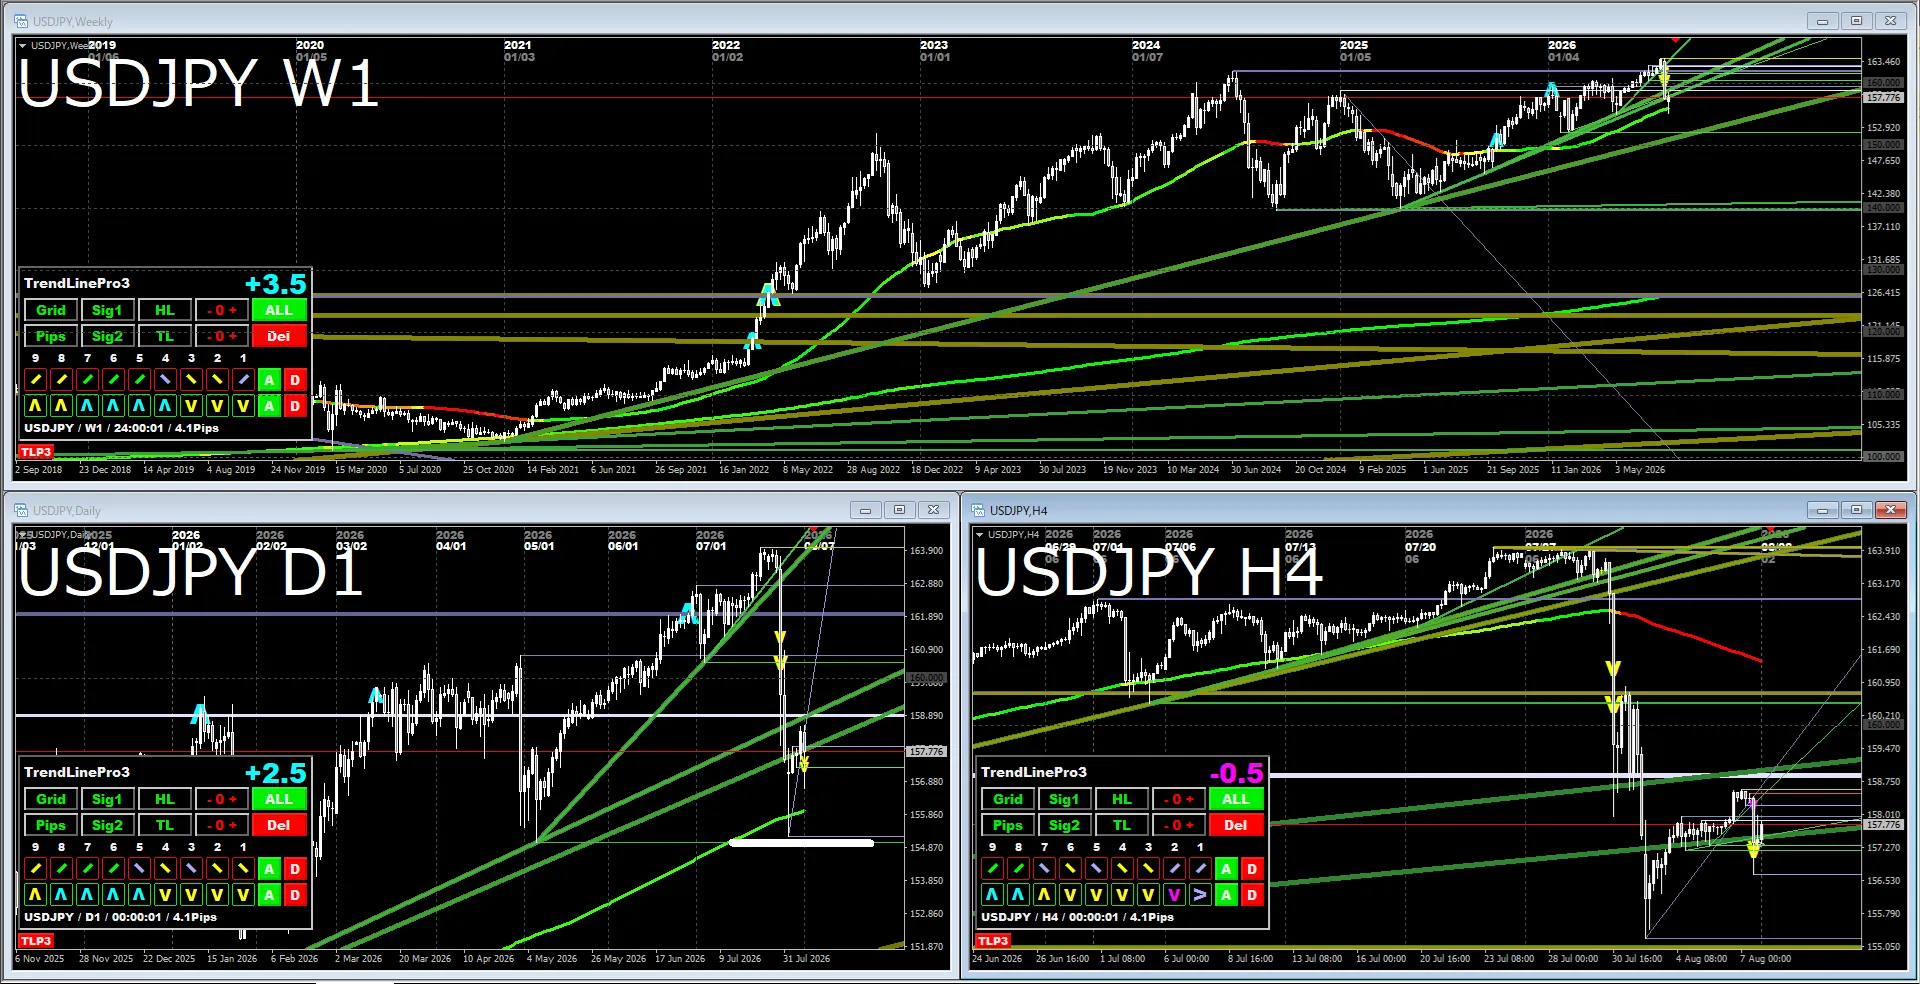
WeeklyThe trend is continuing to rise, with solid new highs. Since a break below the trendline occurred, a mid-term range-bound development is likely.
Daily・4-hourIf the white thick line breakout of the noted support is breached, the rise may pause, but it has not broken yet. For a mid-term decline, this level must be breached, or there must be a price-action adjustment to breach it. Recently, unless there is intervention, the expectation is either a rise or to hold steady.
Gold
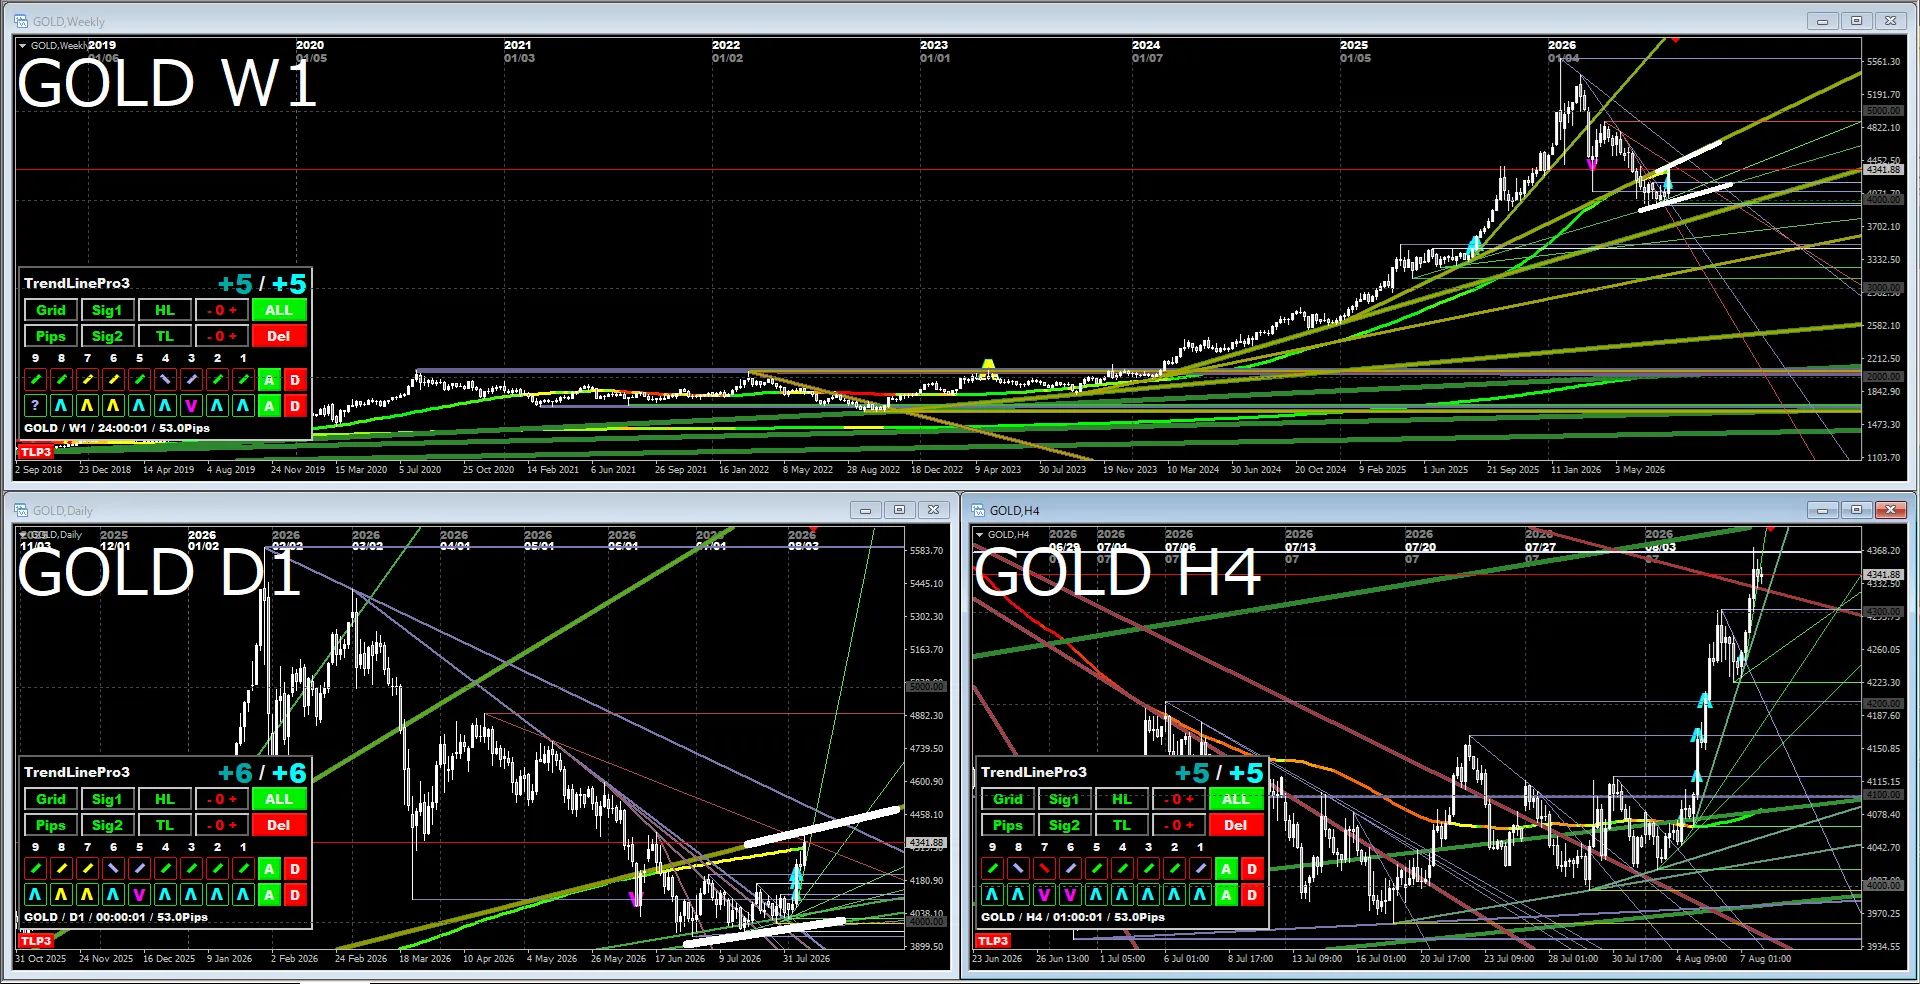
WeeklyAs currency value is perceived to be declining, in the long term, gold is expected to rise. However, overheating may have diminished, and a long-term adjustment may be beginning. The score indicates a rise.
Daily・4-hourThe score also indicates a rise, and there is a possibility of continuing upward, but when looking at the weekly highs and lows, it is not yet clear that a full-scale rally has begun, and the path to 3,500 is not zero. If it dips and then breaks above the added white line, buying may become easier.
S&P 500
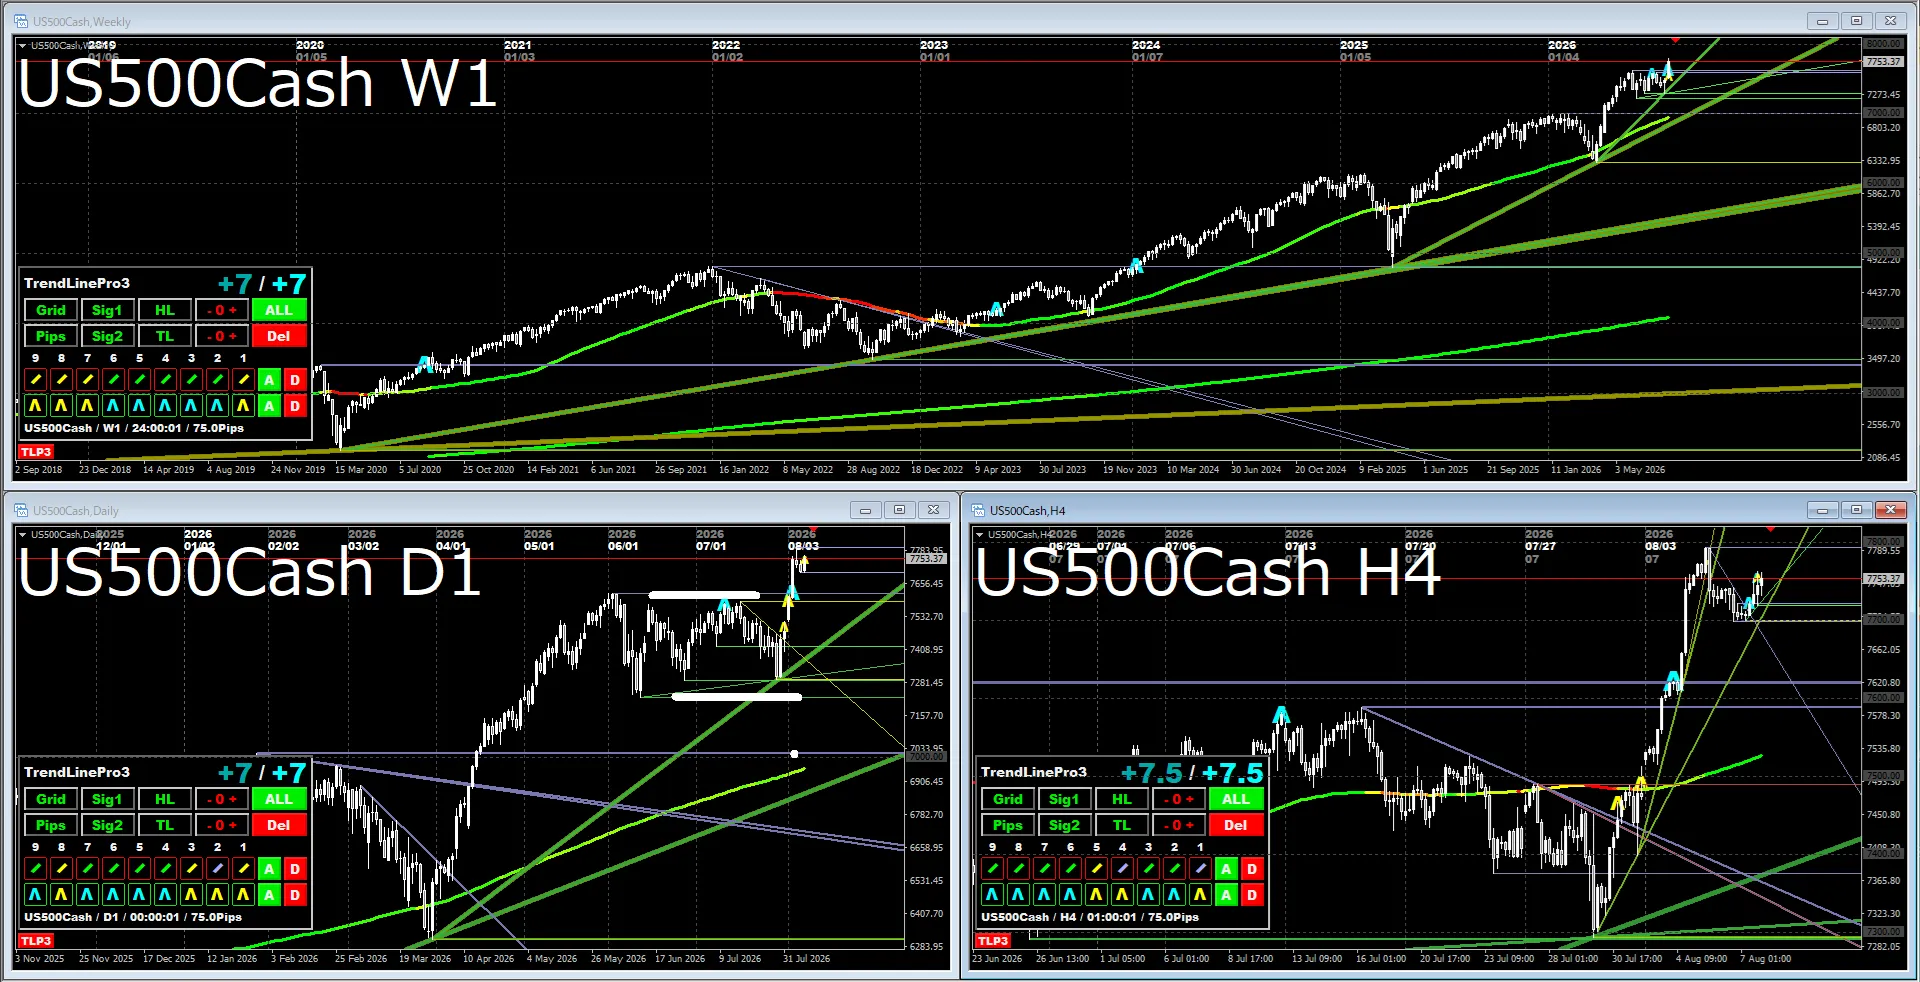
WeeklyThe recent high has been exceeded and the rise is confirmed. Culturally, buying tends to be easier.
Daily・4-hourLooking at the daily chart, a flag pattern seems to be forming. The target value according to the flag pattern is around 8,500. Personally, I plan to close most positions before reaching 8,500.
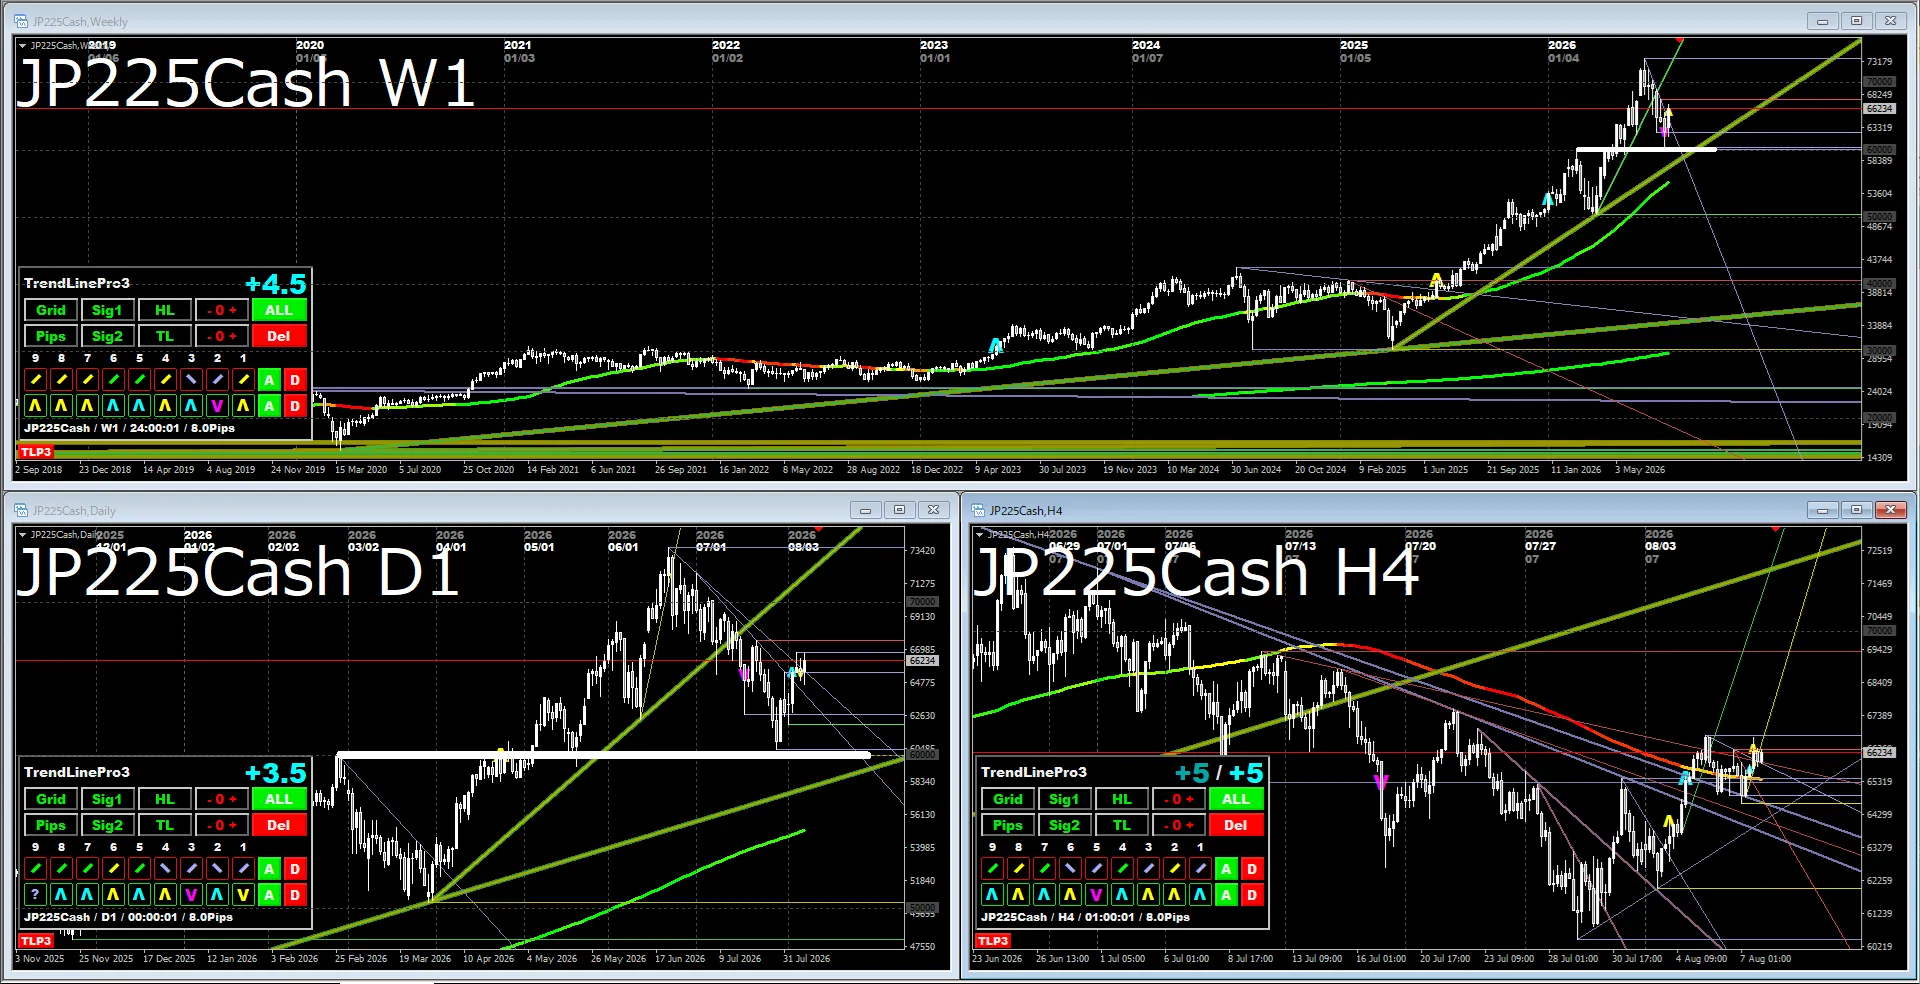
WeeklyThe upward trend continues, but it is unclear whether it will rise rapidly to the immediate high of 80,000.
Daily・4-hourFrom a support-resistance reversal, it is gradually rising, and if it breaks above the red horizontal line near 67,500, where the daily chart shows a retracement high, buying becomes easier. In the near term, there may be a little more price-action adjustment before rising.
The indicators in the attached image use the following indicators.
If you are interested, please take a look.