

NK225 futures MTF Dow Theory: 4-scenario analysis report 2026-08-07
NK225 Futures MTF Dow Theory Analysis Report
Date and time: August 7, 2026, 06:00 JST / Night session close
Current value: 65,530 yen
Target: For intraday session (Friday, 8/7)
Conclusion
In conclusion, price peaked at 66,810 on 8/6 and then declined, with lows at 64,980 and 64,940, turning the 1H trend downward. However, at night it rebounded from 64,940, and the closing price exceeded the rebound high of 65,880 to reach 66,370, meaning the upward breakout itself is valid. Subsequently, it pulled back to 65,530 by close, making the question of whether it can surpass 66,370 again the focus for Friday.
If the 15m close returns to 65,790, the downward wave ends and a follow-long is warranted; if it rebounds from the dip to 65,110–65,530, buy on dips. In either case, a 1H close back above 65,880 would confirm the position. The positions become fully active at 65,880’s 1H close. Do not place sells below the established levels; if price fails to reclaim 66,370 and stalls, aim to enter between 66,370 and 66,810 with the expectation of a trend reversal. If 64,940 (the starting point of the advance) breaks, the setup is invalid and downside continuation is expected. Given the large volatility, simply reaching the zone is not enough; wait for a close to confirm the shape.
4H Analysis
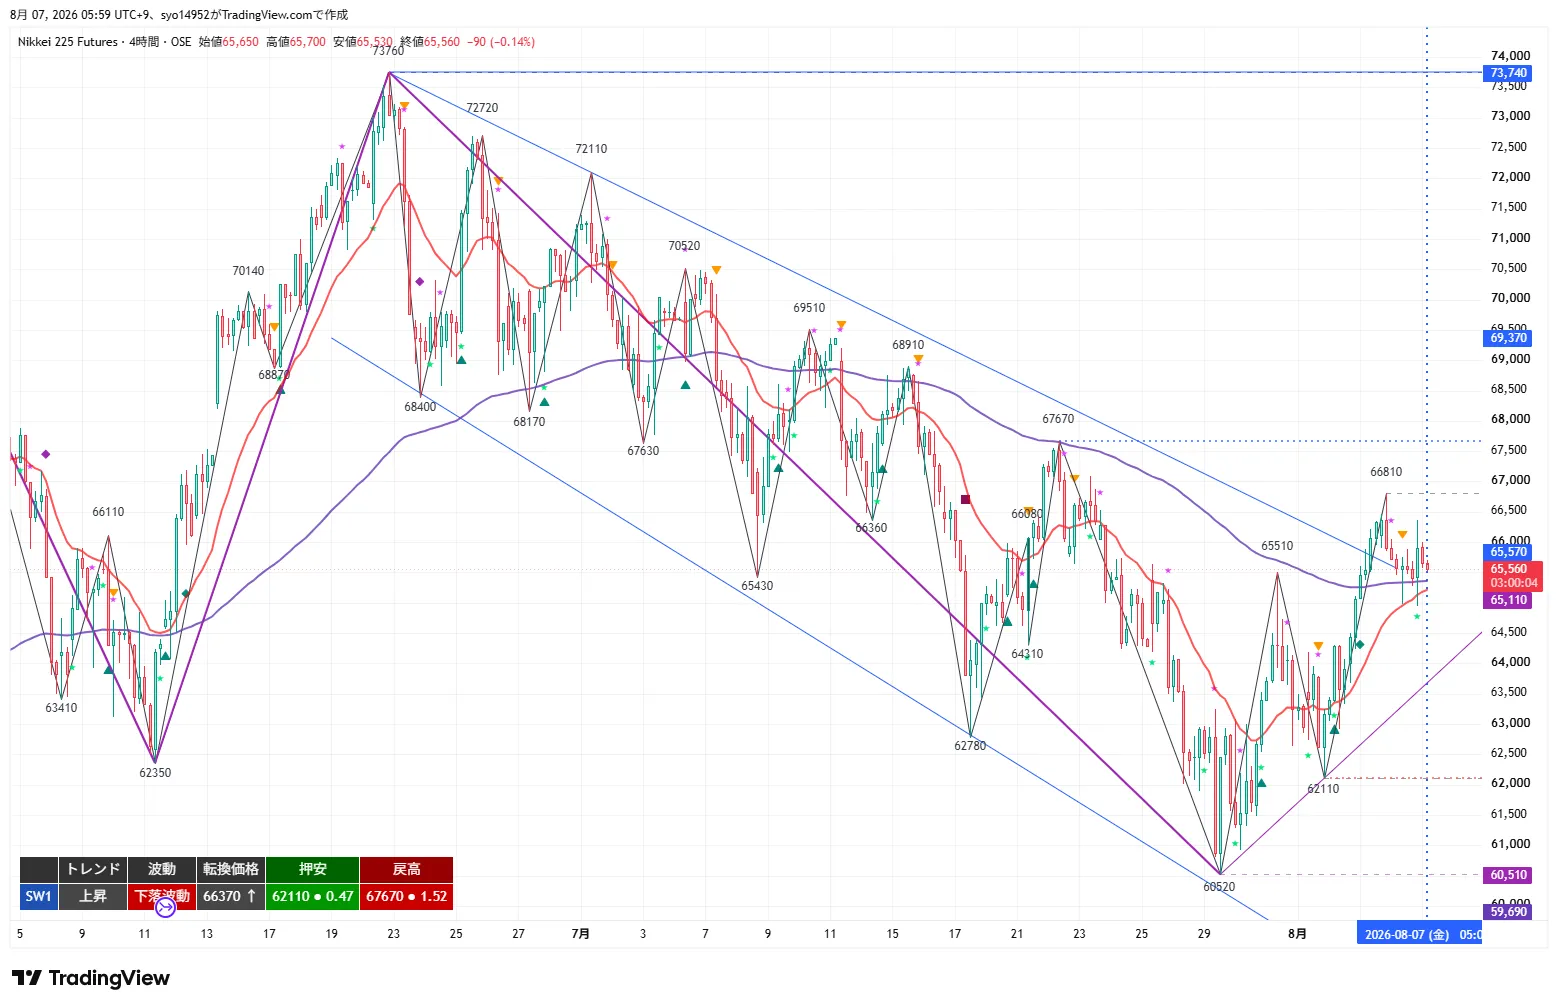
The 4H chart remains in an uptrend, but the wave has shifted to a downtrend with 66,810 as the high. The turning price is 66,370; only by completing a close above this level can the upward wave resume. After falling to 64,940 and rebounding to 66,370, price is now around the 120 EMA (roughly 65,570, equivalent to the daily 20 EMA). The 20 EMA is rising, and price sits above it; the minor low at 62,110 is substantially distant below.
Key resistance targets include 66,370 (turning price), 66,810, 67,140 (daily half-back level), and 67,670 (retracement high). Key supports include 65,530 (1H turning), 65,110, 64,940 (1H dip low), 64,500, 62,910, and 62,110. As long as 62,110 is not broken, the 4H uptrend structure remains intact, but currently price has undergone a large swing from 66,810 to 64,940 and back to 66,370, creating an uncertain directional environment.
1H Analysis
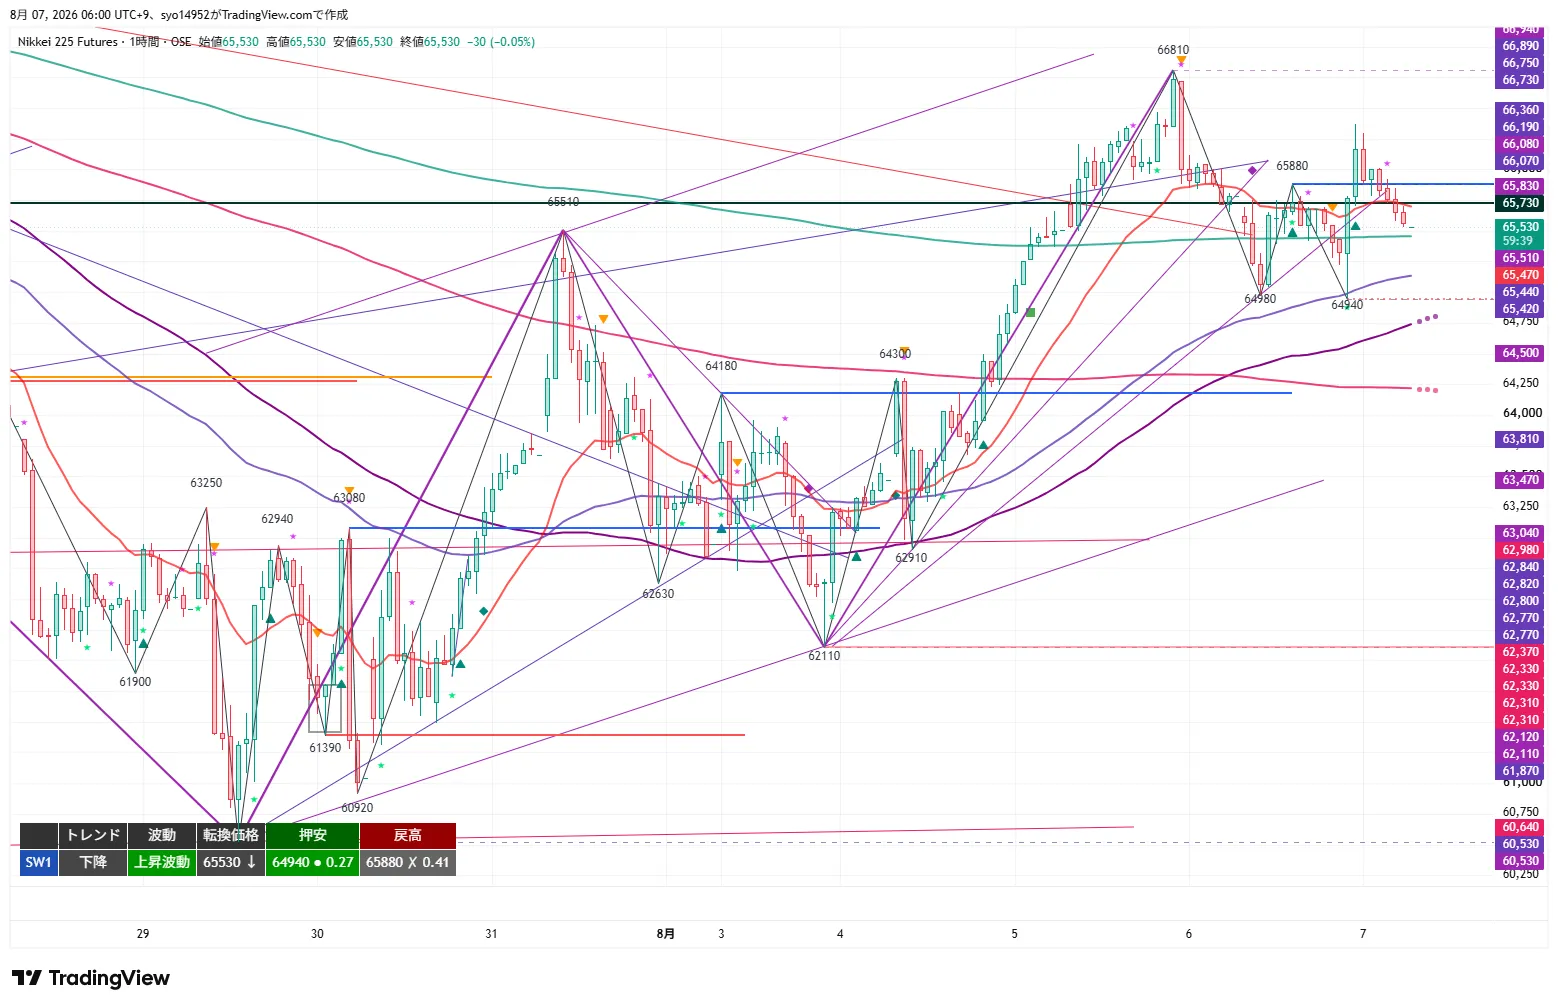
The primary structural analysis on the 1H chart shows a bearish turn, with the trend shifting to downward as 66,810 peaks and 64,980–64,940 lows are made, and the rebound high also declines. However, the wave remains in an upward phase, with the rally starting at 64,940 breaking the rebound high of 65,880 on a close and reaching 66,370, so the breakout upward is valid. The turning price is 65,530, and the current price sits right around this level. The 20 EMA, 80 EMA (4H equivalent of 20 EMA), and 480 EMA (daily 20 EMA equivalent) cluster around 65,420–65,830, with price inside this band.
Although the breakout occurred, price retraced below 65,880 to 65,530, so the continuation strength of the trend is not yet confirmed. The key question remains whether price can reclaim 66,370 after the breakout, which would confirm ongoing trend formation; if price cannot reclaim and stalls, consider it a failed breakout and pursue a short, with a loss if 64,940 is broken to confirm failure of the upward starting point.
15m Analysis
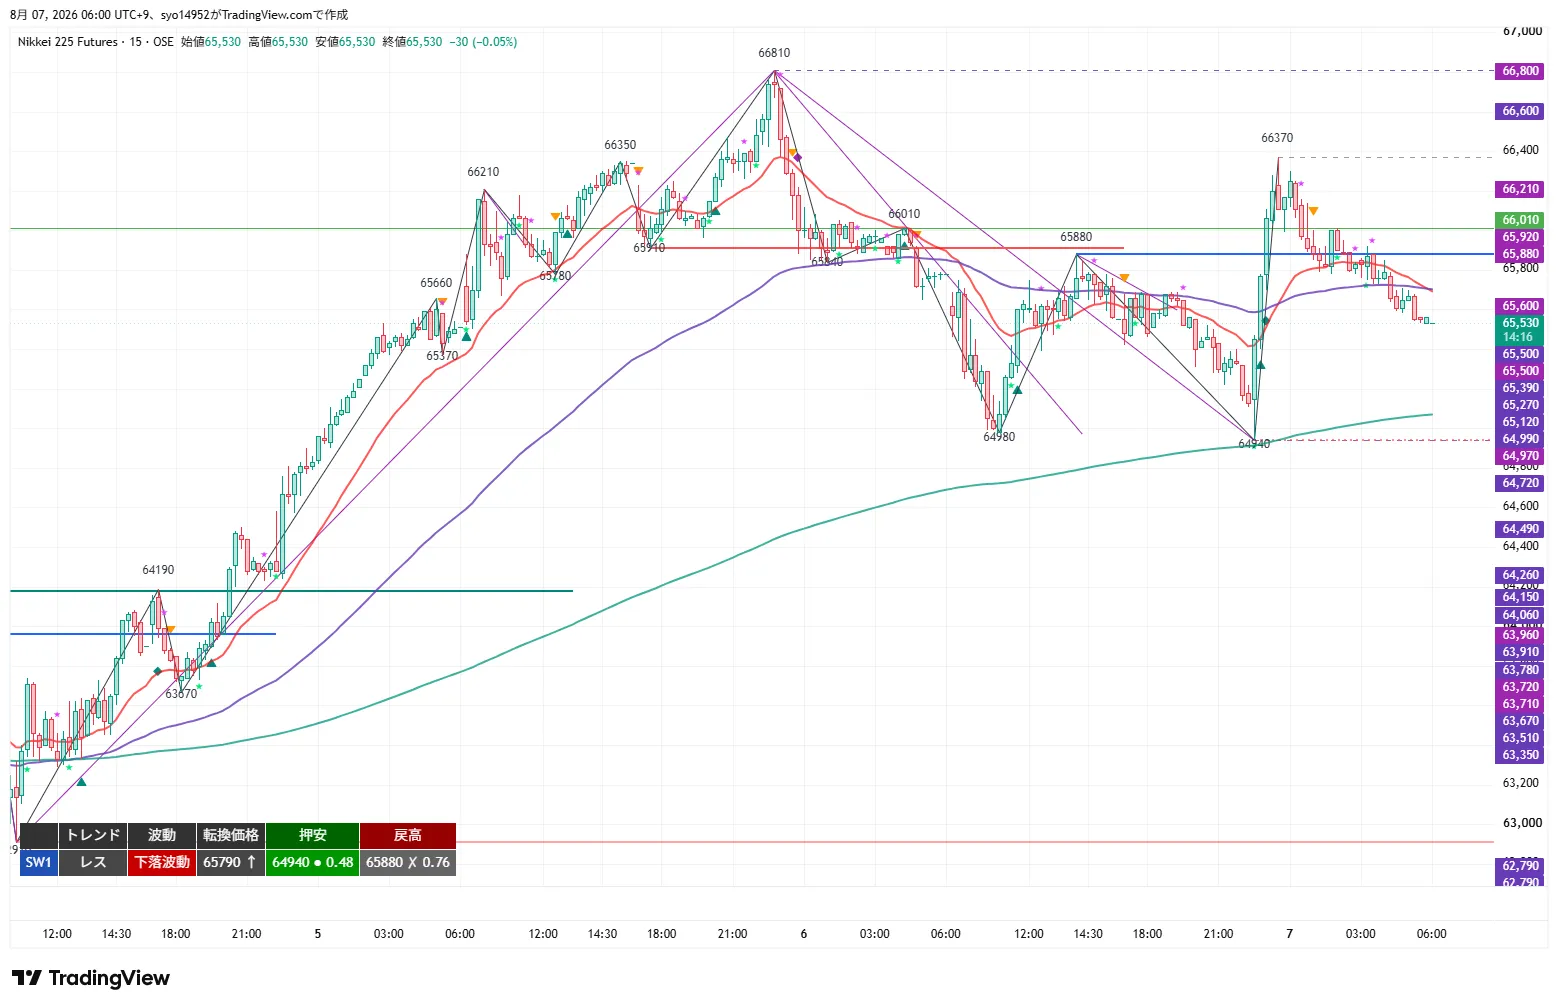
The 15m chart shows a range-bound downtrend. The turning price is 65,790, support at 64,940, and the rebound high at 65,880 has been broken above. From the high of 66,370 price pulled back to 65,530 by close. The 20 EMA around 65,700 has a negative slope with price below it, and the 320 EMA (4H 20 EMA equivalent around 65,120) is also below.
From execution perspective, a close above 65,790 signals the end of the downwave, and a bounce to 65,110–65,530 would provide a buy-the-dip setup. A close below 64,940 would break the upward starting point and switch to a selling stance. The range from 64,940 to 66,370 spans 1,430 points and price action is fast; avoid chasing solely based on zone reach—wait for a close to confirm the shape.
MTF State
- 4H: Upward / Downward wave. Price dropped from 66,810 to 64,940, then rebounded to 66,370. Turning price 66,370; support at 62,110; rebound high 67,670. 20 EMA upward; price above it; around 120 EMA (daily 20 EMA) near 65,570.
- 1H: Downward / Upward wave. Lowes lower; trend shifted downward, but the upward movement starting at 64,940 closed above 65,880 to reach 66,370—upward breakout occurred. Turning price 65,530; dip support 64,940; rebound high 65,880 (X). All MAs cluster around 65,420–65,830 with price inside.
- 15m: Range / Downward wave. Price pushed from 66,370 to 65,530 and closed there. Turning price 65,790; dip support 64,940; rebound high 65,880 (X). 20 EMA negative slope; price below it.
- Consistency: 4H is in an uptrend with a downward wave, 1H is in a downward trend with an upward wave, 15m is range-bound with a downward wave. The 1H breakout is valid but price has returned below 65,880, so the continuation is not yet confirmed. Treat all four timeframes as equally relevant in parallel. The MA bands for 1H (65,420–65,830) support pullback zones but are not used as breakout criteria.
Important Prices
- 73,760 yen: Daily rebound high. Final upward target (for reference).
- 67,930 yen: Higher-level milestone. Complete retreat.
- 67,670 yen: 4H rebound high. Upper bound of Rebound Sell Zone 2.
- 67,140 yen: Daily 0.5 retracement level. Lower bound of T2/ Rebound Sell Zone 2.
- 66,810 yen: 8/6 high. Upper bound of T2 / Rebound Sell Zone 1.
- 66,370 yen: 8/7 Night high / 4H turning price (post-break high). Lower bound of T1 / Rebound Sell Zone 1.
- 65,880 yen: 1H old rebound high (X = breakout). Support turning. Fully active for T1/T2 consolidation and as reference for pullbacks.
- 65,790 yen: 15m turning price. Trigger 1.
- 65,530 yen: Current price / Night close price / 1H turning price. Upper bound of Dip Buy Zone 1 / T1 / Complete retreat for ④.
- 65,420–65,830 yen: 1H MA bands. Levels prone to rebound.
- 65,120 yen: 15m 320 EMA (4H 20 EMA equivalent).
- 65,110 yen: Lower milestone. Lower bound of Dip Buy Zone 1.
- 64,980 yen: 8/6 low. Upper bound of Dip Buy Zone 2.
- 64,940 yen: 8/7 Night low / 1H / 15m dip low (starting point of the rise). Lower bound of Dip Buy Zone 2 / T2 / Fully active / Trigger.
- 64,500 yen: Lower milestone. Complete retreat / T1 fully active / ④ T1 fully active.
- 63,810 yen: Lower milestone. ④ T2.
- 62,910 yen: 1H old dip low. ④ T2.
- 62,110 yen: 4H dip low.
Trade Ideas
① Breakout Following (Long)
- Trigger: Recover 65,790 (15m turning price) with 15m close (end of the 15m down wave).
- Leading entry price: 65,790. After recovery, pull back near breakout price or around the tilted 20 MA on short timeframes (1m, 5m) to front-run (back-entry; RR based on breakout price).
- Actual entry price: 65,880 (support turning) recovered by 1H close = fully active position.
- Stop/Invalidate: backup at 65,490; main position breaks below 64,940. Complete retreat below 64,940.
- Targets: 66,370 (partial take + base), 66,810 / 67,140.
- RR: T1 (66,370) = 1.9 / T2 (66,810) = 3.4.
- MFE protection: close at +200 yen or small profit, or trail at +300 yen to secure at least +100. Since a pullback of 66,370 to 66,010 is likely, if cannot reclaim and stalls, switch to ③.
② Buy on Dip (Long)
- Standard conditions: Dip to 65,110–65,530 (lower milestone to 1H turning price) and verify rebound shape with 15m close. Where 1H MA align, rebound is likely. Deep pullback to 64,940–64,980 (starting point of the rise on 8/6) would switch loss cut to 64,640.
- Leading entry price: 65,300. After rebound confirmation on 15m close, and if 20MA turns upward and price recovers above it, enter ahead.
- Actual entry price: 65,880 (support turning) recovered by 1H close = fully active position.
- Stop/Invalidate: backup at 65,000; main at 64,940. Complete retreat at 64,500 (switch to ④).
- Targets: 66,370 (partial take + base), 66,810 / 67,140.
- RR: T1 (66,370) = 3.6 / T2 (66,810) = 5.0.
- MFE protection: +200 for base or small profit, +300 for at least +100 or trailing. The deep dip zone is the breakout origin, so a rebound from here preserves structure.
③ Sell on Retrace (Short)
- Standard conditions: In the range 66,370–66,810 (post-break high–8/6 high), clearly break above 66,370 at close; if not, look for a failure of the breakout by checking 15m close and target zone 2 (67,140–67,670) with loss cut at 67,770.
- Leading entry price: 66,420. After price stalls confirmed by 15m close, measure near breakout high with 1m/5m to front-run (avoid early plays above the rising 20MA).
- Actual entry price: 64,940 (starting point of rise) break below 1H close = breakout failure confirmed and full entry for short. At this point the leading position has reached T1; take partial profit and move base to lock in, then add more if 1H close below.
- Stop/Invalidate: leading 66,720 recovery; main 65,880 recovery. Complete retreat 67,930.
- Targets: 65,530 (partial take + base), 64,940 / 64,500.
- RR: T1 (65,530) = 3.0 / T2 (64,940) = 4.9.
- MFE protection: +200 for base or small profit, +300 for at least +100 or trailing. Do not hold sells below established levels. Do not chase; protect promptly as zones are reached. If a confirmed trigger reaches T1, skip further actions.
④ Breakout Following (Short)
- Trigger: Break below 64,940 (8/7 Night low / 1H/15m dip low = starting point to 66,370) by 15m close (breakout failure confirmed).
- Leading entry price: 64,940. After break, pull back near breakout price or tilted 20MA with short timeframes (1m, 5m) to front-run (back-entry; RR based on breakout price).
- Actual entry price: 64,500 (lower milestone) break below 1H close = fully active. Since Target 1 equals this level, take partial profit and move base; if 1H close below is confirmed on the same candle, add more to position.
- Stop/Invalidate: leading 65,290 recovery; main 64,940 recovery. Complete retreat at 65,530.
- Targets: 64,500 (partial take + base), 63,810 / 62,910.
- RR: T1 (64,500) = 1.3 / T2 (63,810) = 3.2. Because T1 is thin, emphasize back-entry.
- MFE protection: +200 for base or small profit, +300 for at least +100 or trailing. Do not place sells below established levels. Do not chase; protect firmly as zones are reached. If a clear end-of-bar break occurs and T1 has been reached, skip further actions.
Current Actions
- Most important Line 1: 66,370 yen. 8/7 Night high (post-break high) / 4H turning price. If reclaimed, ongoing trend continuation is confirmed, with the retracement from close at 65,790 as the follow-through path (leading 65,790; main 65,880 recovered at 1H close). If not reclaimed and stalls, switch to a pullback sell (leading 66,420).
- Most important Line 2: 65,530–64,940 yen. 1H turning price (current price) to the start of the rise. Rebound from 65,110–65,530 is a dip buy (leading 65,300); deep pullbacks are 64,940–64,980. If 64,940 breaks on 15m close, this triggers ④ (leading 64,940).
Entry prices, triggers, and stops are set based on chart shapes at close (turning prices, dip lows, rebound highs of each timeframe). If the structure changes over time but the higher-timeframe structure remains, adjust entry prices using the turning prices of lower timeframes (e.g., when a short-term timeframe first rises, then turns to a down wave) to better reflect reality, using the more accurate figure compared to the initial value.
※ This report is for information purposes and is not investment advice. Please make your own investment decisions at your own risk.