
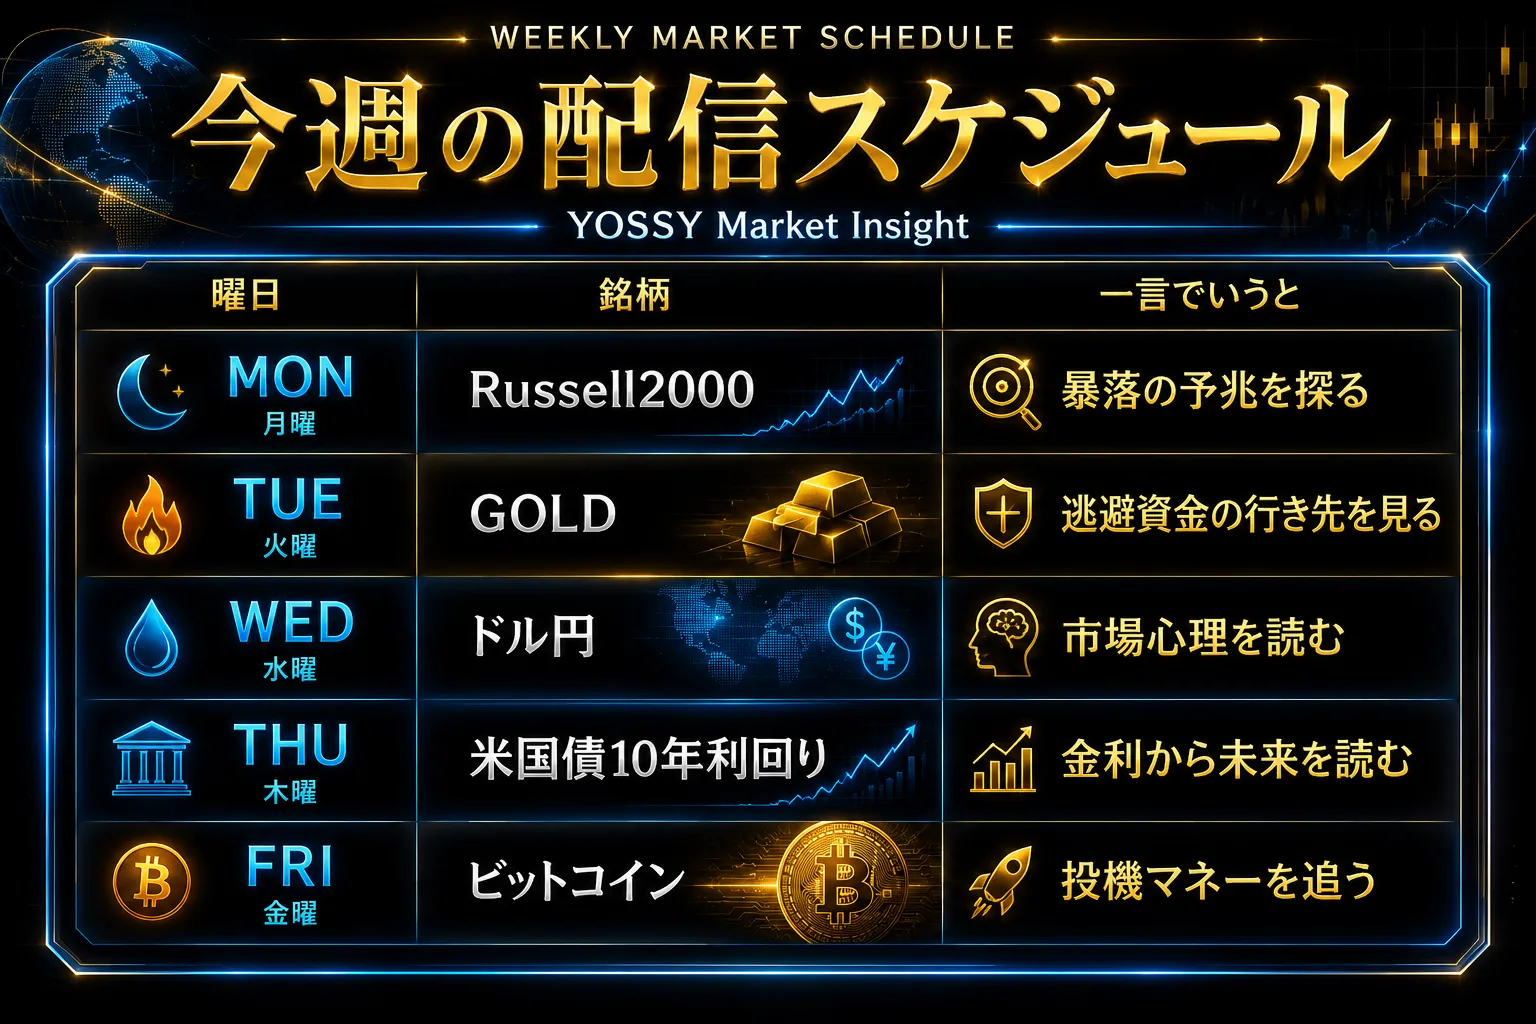
August 7 (Fri): 【BB&HM】 Nikkei 225 VS Bitcoin
This time
tends to move slightly ahead of the four major U.S. indices
“Bitcoin”
We will compare with.
【Overall Scenario Probability】
This week's overall market is…
“Rise: 55% / Fall: 45%”
※Although the four major U.S. indices continue to rise【Expansion】 and the rising U.S. 10-year yield on the【Shark】 momentum provides an【inverse correlation】 boost, there is a risk that signs of a stagnation in the S&P 500 and the Russell 2000 and a potential shift into a “Boji” may keep gains in check.
※ Presented as a reference level.
【This Week's Market Focus Points】
This week's market shows the four major U.S. indices continuing to rise【Expansion】, but signs of stagnation are beginning to appear in the S&P 500 and the Russell 2000, suggesting a pause in the upward momentum.
There is a new signal that Bitcoin’s short-term chart has reached the PRZ, so it is worth watching whether it will rise to the T/P Zone (green).
The Nikkei 225 continues to battle at important moving averages, and this week may be a turning point between continued gains and a temporary pullback.
Details will be explained in the paid section.
➥The rest is explained in detail in the members-only report.
If you are not yet registered, please go here ↓
【Integrated Version】
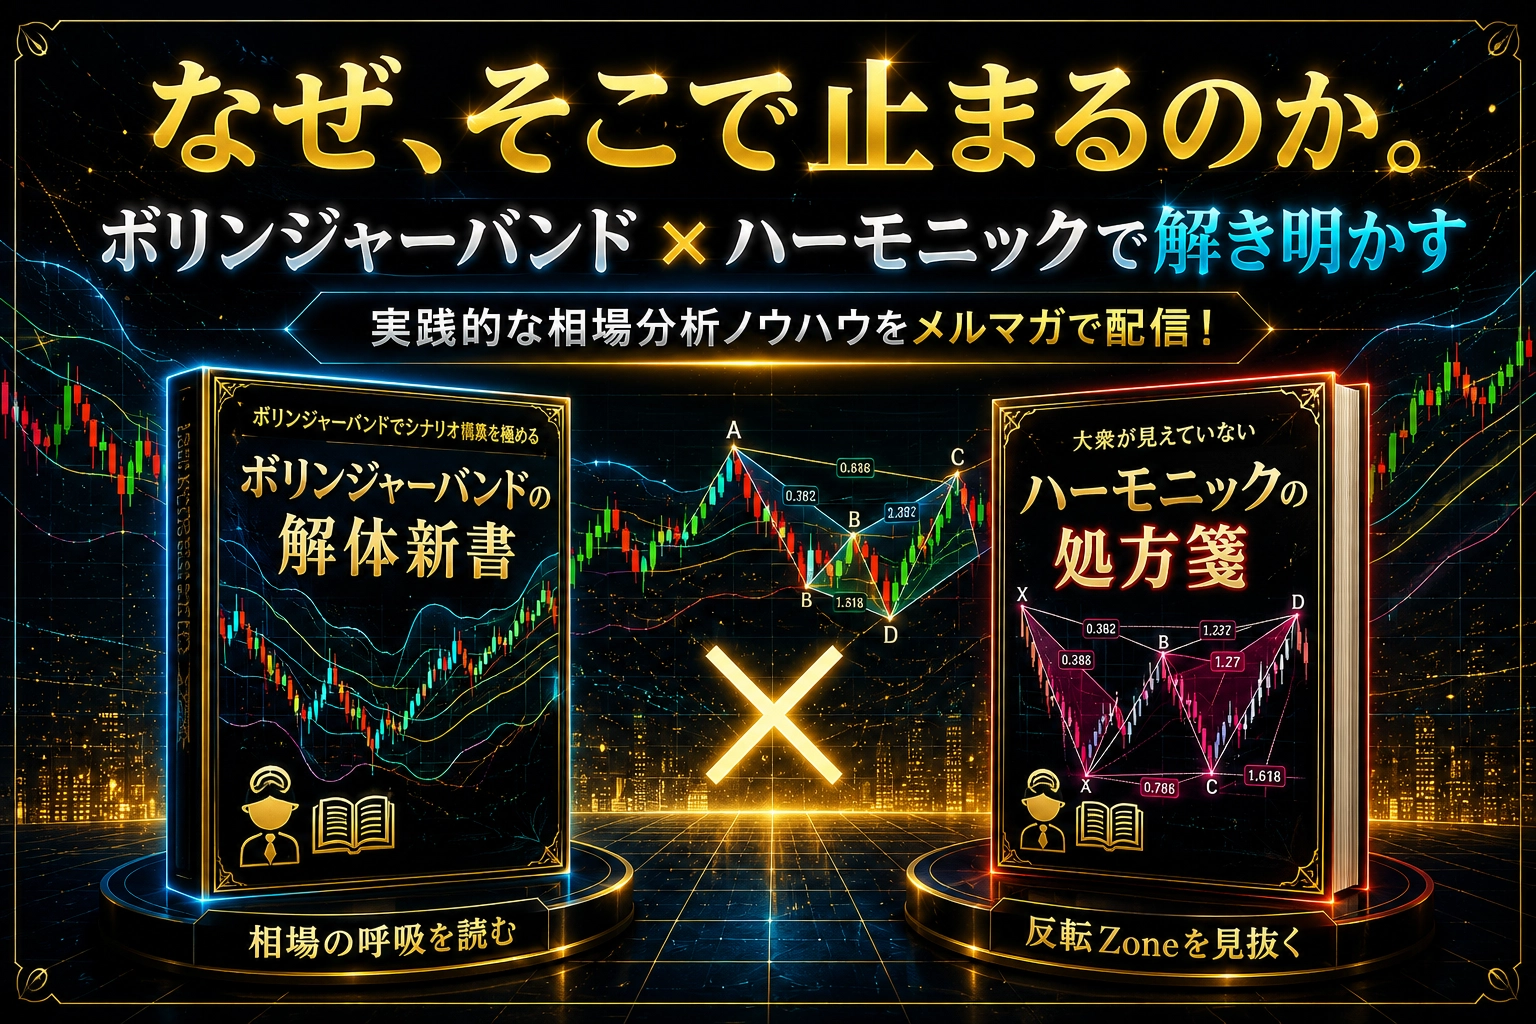
“Why does the market stop there? Bollinger Bands × Harmonics: fusion of statistics and geometry to capture market turning points with high precision!
https://www.gogojungle.co.jp/finance/navi/series/1613?via=articles_detail_aside
(※The following content is for members only.)
-----------------------------------------------
【Environmental Recognition】