

2026/08/06 USD/JPY Yurīsō analysis?
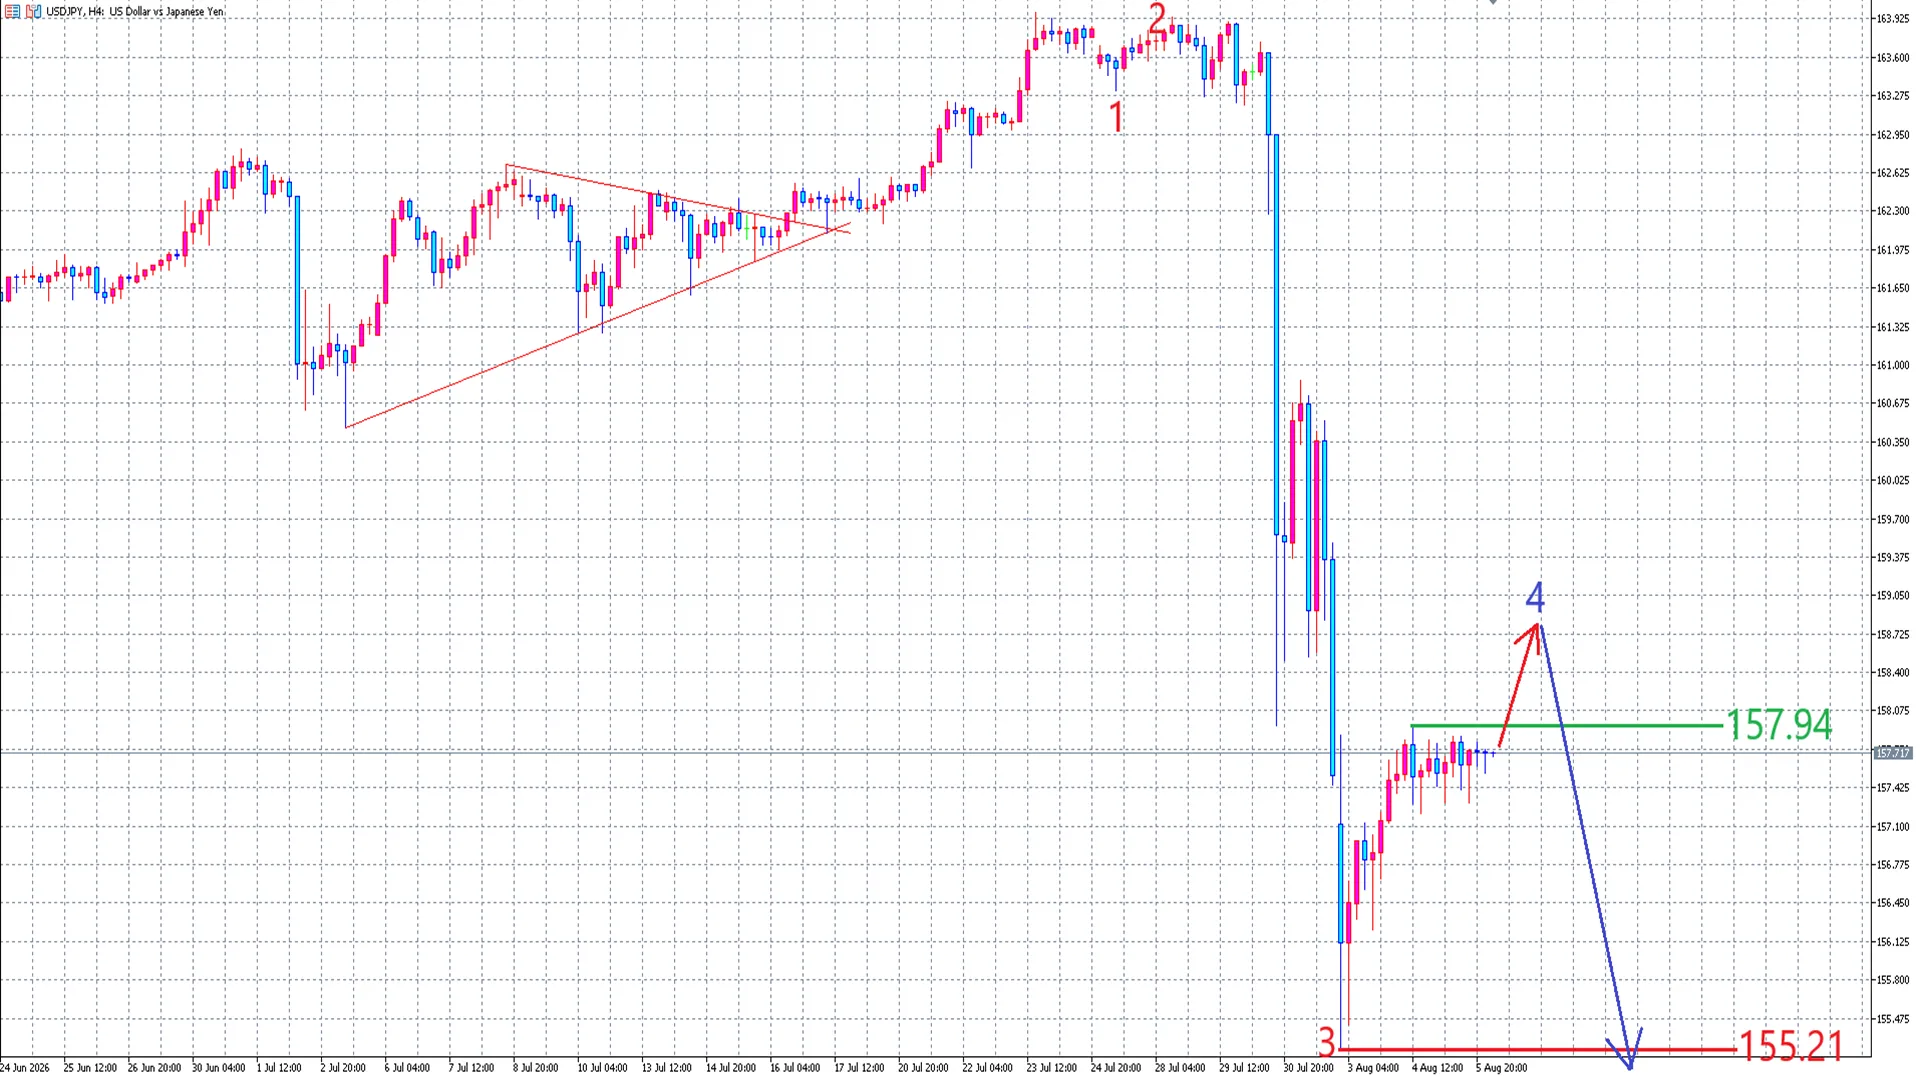
This is the four-hour chart of USD/JPY.
The four-hour Elliott wave is currently the fourth wave of a downtrend Elliott wave.
The four-hour cyclered lineis the starting point, and I am looking at 20 scenarios at present.
The fourth wave on the four-hour chart is formed by waves a through c on the one-hour chart, and the Elliott wave on the one-hour chart is currently the b-wave of the downtrend Elliott wave, so there is still a rise in wave c remaining.
Therefore, the fourth wave on the four-hour chart is still ongoing, and from heregreen lineI expect a rise that breaks above it.
The major cycle is currently 25 waves and has not yet reached bottom time, and given that the decline in the fifth wave on the four-hour chart remains, this four-hour cycle is highly likely to form a left translation.
So from heregreen lineI expect a rise that breaks above it, but at an early stage I anticipate topping out on the four-hour cycle and falling below thered lineto form the fifth wave on the four-hour chart.
The U.S. employment data is tomorrow, and if there is no rise beyond the green line before the data release, I think there will be a rise at the employment report.green lineIf there is no rise above it before the employment report, I expect a rise at the employment data.
If there is a rise on the one-hour chart that can be seen as wave c before the employment data, I expect a decline at the employment data.
However, I think this is unlikely, butgreen linethe high of the green line could be the high of the current fourth wave on the four-hour chart, and the current range could be the second wave of the downtrend on the one-hour chart, so please consider the possibility that the high of the green line is the top of the four-hour cycle as well.
In any case, always be wary of the four-hour cycle top.
There is a possibility that the high after the employment data will become the top of the four-hour cycle, so I think this employment data timing is a bit tricky for trading.
From the above, I expect a little more upside before the four-hour cycle top, but I am watching the market from a selling perspective.
As a trading strategy, I aim for a short entry near the four-hour cycle top this time.
Place the short stop beyond what you consider to be the four-hour cycle top.
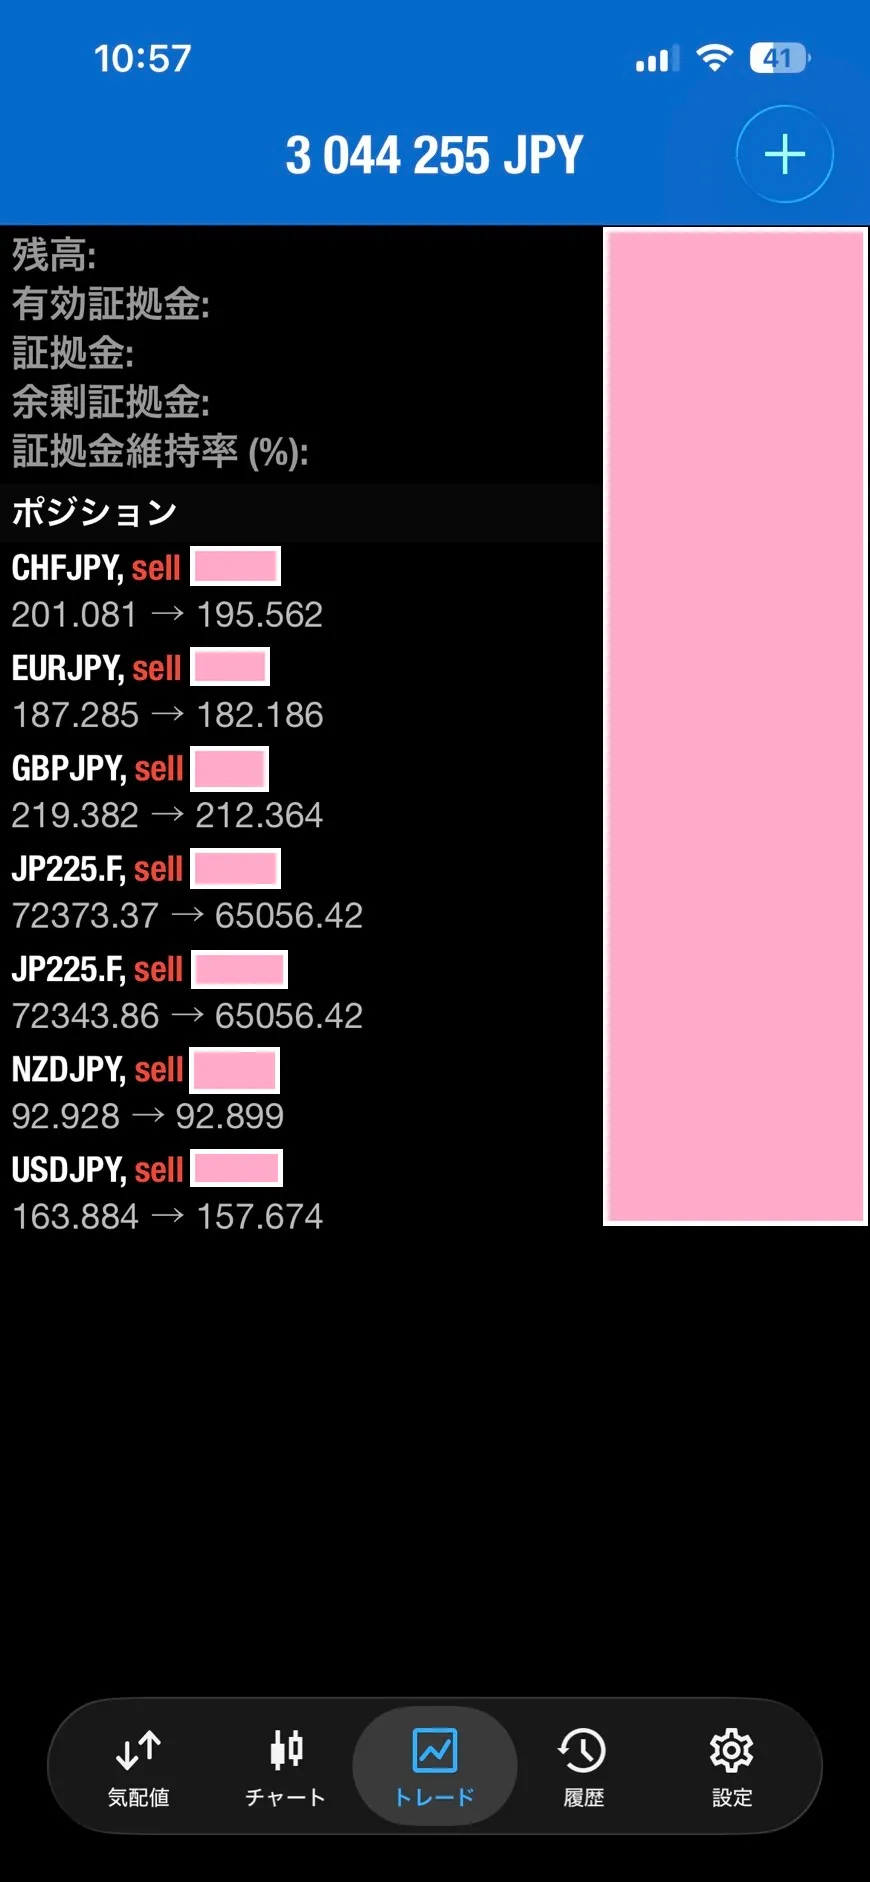
Current position.
The Nikkei 225 (72373.37) has already taken 50% of the short position profits, so even if the stop is hit, there will be no money loss from a capital perspective.
Current unrealized profit is+16569 pips, right?
This time, since the four-hour cycle reaches its top at the employment data, if the high due to the employment data rises to become the four-hour cycle top, the spread widens, making entry more difficult.
If possible, I would like the four-hour cycle top to form before the employment data, or for a little stagnation near the four-hour cycle top.
As of 2026, the accumulated profit is+4027 pips❣️