
NK225 Futures MTF Dow Theory 4-Scenario Analysis Report 2026-08-06
NK225 Futures MTF Dow Theory Analysis Report
Date and Time: August 6, 2026 06:02 JST / Night Session
Current Price: 65,780 JPY
Subject: For intraday session (Thu, 8/6)
Conclusion
In conclusion, during 8/5 intraday price rose to 66,350, then in the night session extended to 66,810 before rapidly reversing to 65,650, closing at 65,780. The 1-hour chart maintained an uptrend before turning into a downward move, the 4-hour chart continued an uptrend and up-move, and the daily chart sits just above the 0.382 retracement level. The focus for Thursday is whether price can again exceed 66,810, considering both a renewed rise from a pullback and a shape that stalls without breaking above, which would indicate a continuation of the trend.
If 66,010 is recovered on a 15-minute close, the down move ends and a follow-on long may be taken; if a pullback to 65,510–65,650 produces a rebound, that could be a pullback-buy. Do not place sells below already-formed support levels; instead, enter at 66,810–67,140 if price stalls without breaking above 66,810. If 65,650 (reversal point) is broken, the pullback deepens; breaking 65,060 (4H turning point) would undermine the upward structure. Given the large volatility immediately after a sharp reversal, do not enter merely upon reaching a zone; wait for a close to confirm the pattern.
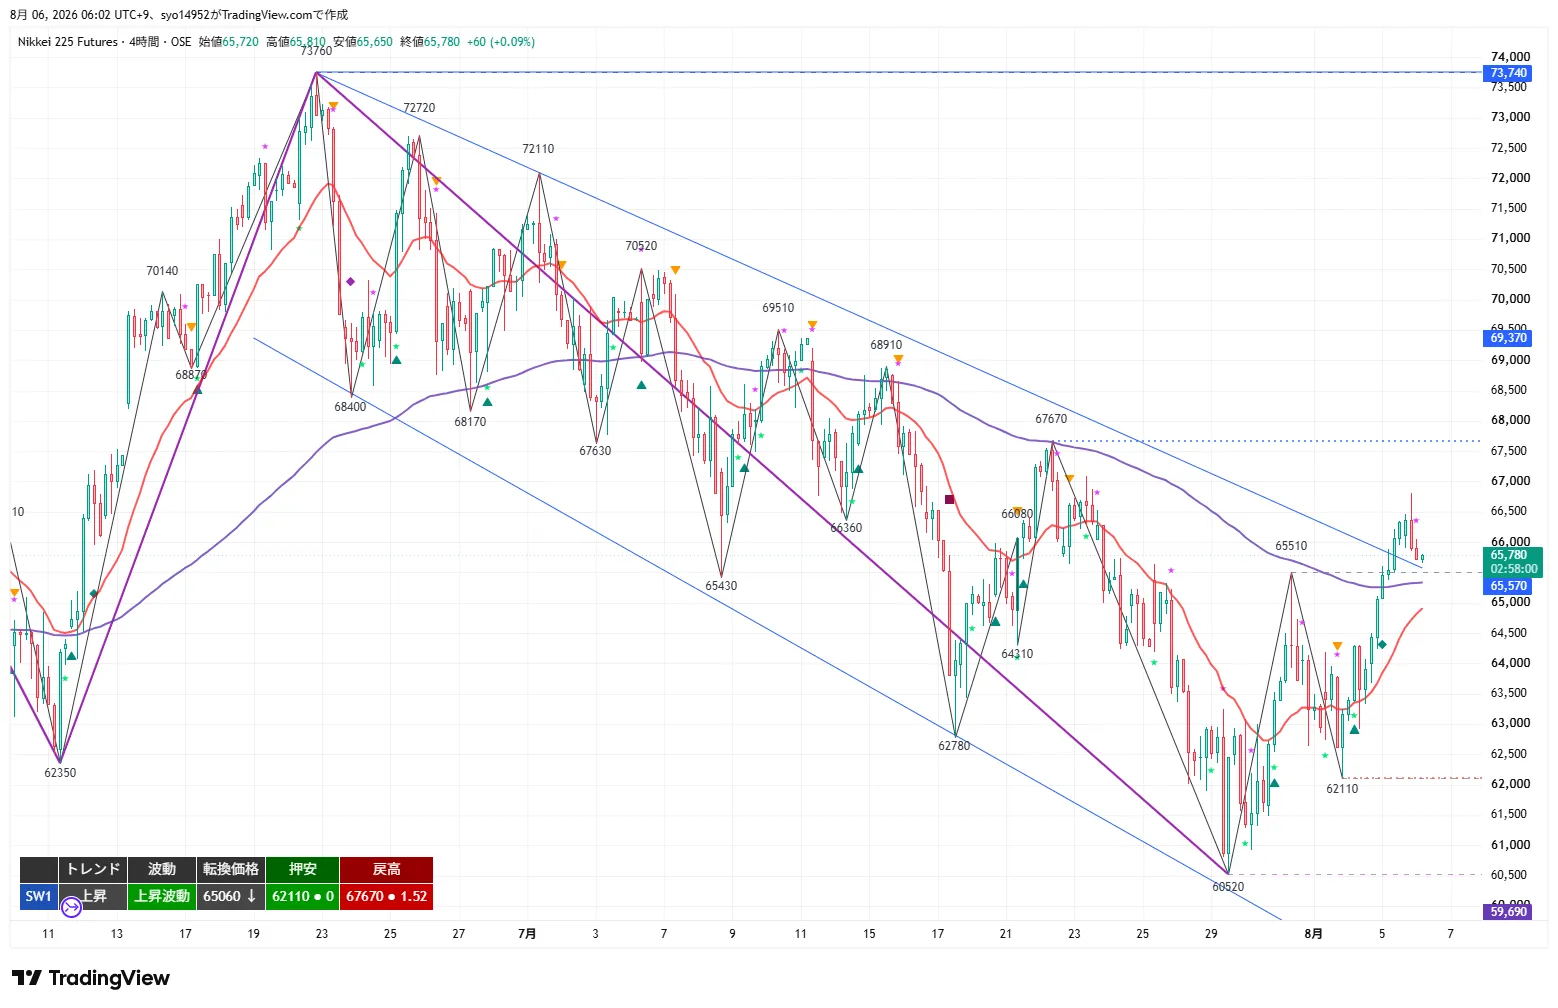
4H Analysis
The 4H chart shows the uptrend and the up-move continuing. Prices rose from a push-low of 62,110 and closed higher near 65,780 with a bullish candle. The turning price is 65,060, and prices have closed above the 120 EMA (roughly the daily 20 EMA around 65,570). The price remains above the 20 EMA, which is rising. The rebound highs formed from the decline from 67,670 are being broken to the upside gradually.
Key resistance levels to watch are 66,810 (night high), 67,140 (daily 0.5 retracement level), 67,670 (retracement high), and then 68,700 (daily 0.618 retracement level). Key supports are 65,650 (night low), 65,510 (support-turned), 65,060 (turning price), 64,500, 62,910 (1H pullback low). As long as 65,060 holds, the 4H uptrend structure remains intact, but on the daily frame it sits just above the 0.382 retracement, suggesting upside may not be one-sided.
1H Analysis
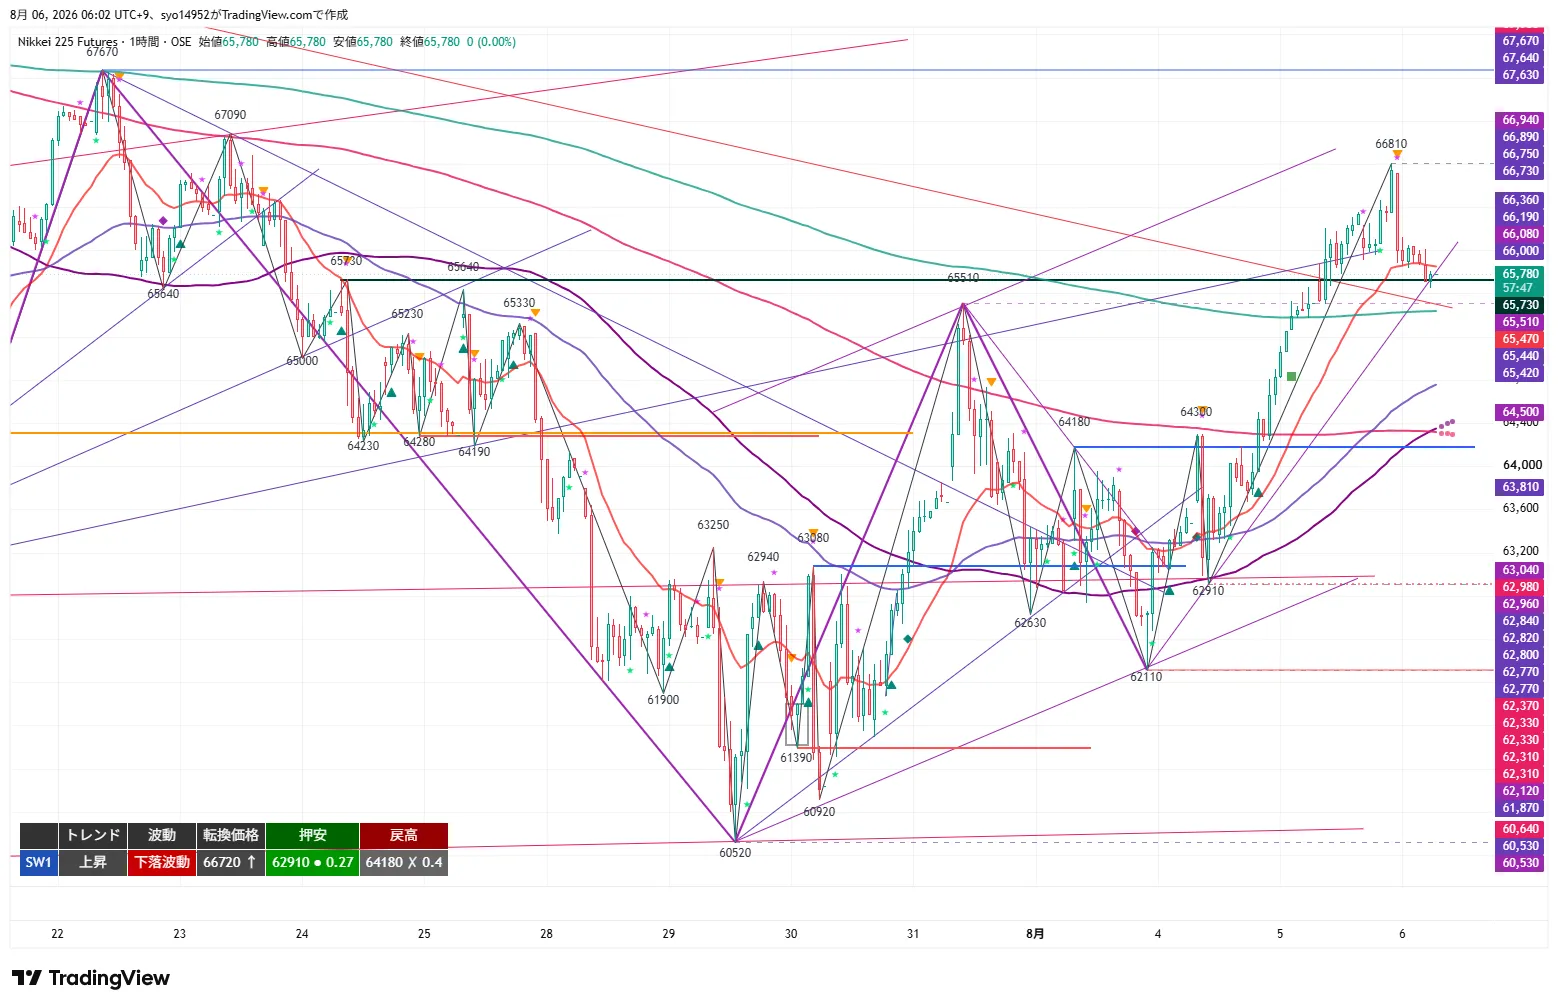
The 1H is the core for structural judgment; it maintained an uptrend while the wave turned into a downward move. On 8/5 price broke above 65,510 to confirm the uptrend, rose to 66,810, then sharply reversed to 65,650 and closed at 65,780. The turning price is 66,720; if recovered by the close, the up-move resumes. The 20 EMA, 80 EMA (4H equivalent to 20 EMA), and 480 EMA (daily 20 EMA equivalent) cluster around 65,400–65,730, with price just above them.
Since the upside breakout has already occurred, the next focal point is whether price can exceed 66,810. If exceeded, the up move continues; if not and it stalls, it signals a continuation-failure of the trend and a sell signal, with a break of 65,650 increasing the depth of the pullback. Further, a break of 65,060 (4H turning point) would undermine the upward structure itself.
15m Analysis
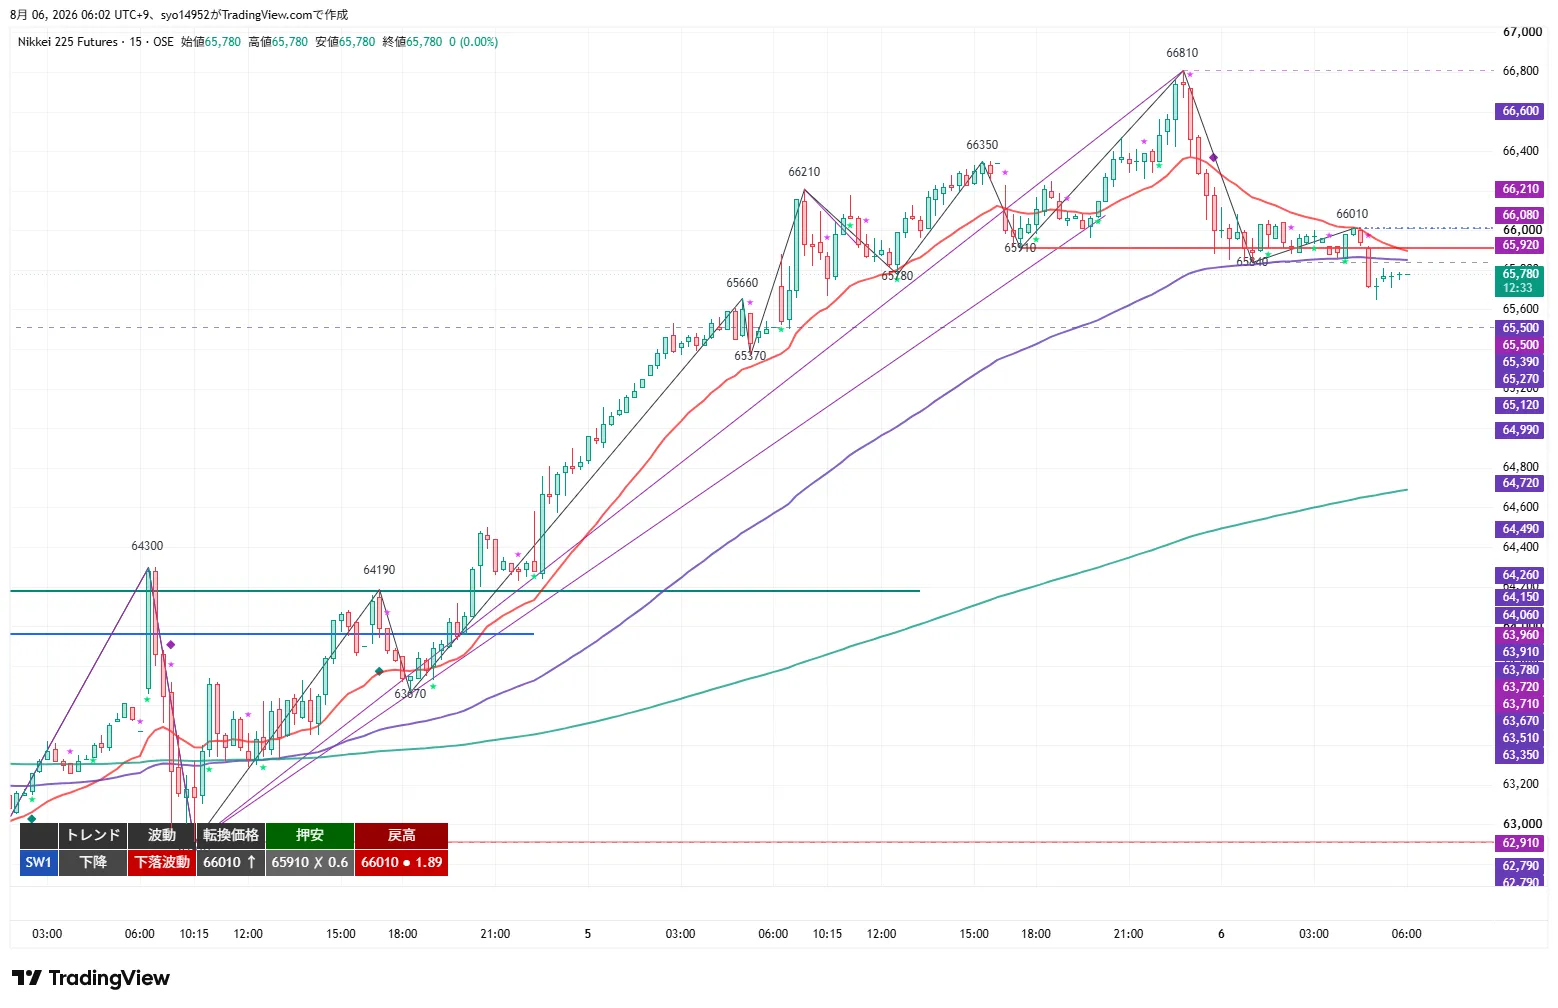
The 15m chart shows a down and falling wave. The turning price is 66,010; the pullback low 65,910 has already been breached, with a rebound high at 66,010. From the high of 66,810 down to 65,650, price dropped, then recovered to 66,010 and closed at 65,780. The 20 EMA around 65,920 is negatively sloped and price sits below it; the 320 EMA (4H 20 EMA equivalent around 64,720) is significantly below.
In terms of execution, a close above 66,010 ends the downward wave and makes a rebound pattern. A pullback to 65,510–65,650 that shows a rebound would offer a pullback-buy opportunity. If 65,650 closes below, the pullback deepens and a shift to a sell is warranted.
MTF State
- 4H: Up / Up-move. 65,780 +0.09% bullish close. Turning price 65,060; pullback low 62,110; rebound high 67,670. 20 EMA rising; price above it. The retracement from 67,670 has been breached progressively.
- 1H: Up / Down move. Reached 66,810 before tumbling to 65,650. Turning price 66,720; pullback low 62,910; rebound high 64,180 (X). MA bands cluster around 65,400–65,730 with price directly above them.
- 15m: Down / Down move. 66,810 → 65,650 → 66,010 → 65,780. Turning price 66,010; pullback low 65,910 (X); rebound high 66,010. 20 EMA negative; price below it.
- Consistency: 4H uptrend/up-move, 1H uptrend/down move, 15m down/down move. Higher-timeframe up-structure remains while lower timeframes pull back. Strategy centers on trend-following pullbacks and chasing longs; sells target failures of upward continuation, limited to above recent highs. The MA bands on 1H and 4H 120 EMA support the pullback zones but are not used as break signals.
Key Prices
- 73,760 JPY: Daily retracement high. Upper target (for reference).
- 68,700 JPY: Daily 0.618 retracement level (reference).
- 67,930 JPY: Higher-level milestone. Complete retreat point.
- 67,670 JPY: 4H retracement high. Upper limit of pullback zone 2.
- 67,630 JPY: Upper milestone on 1H. Lower limit of pullback zone 2.
- 67,140 JPY: Daily 0.5 retracement level. Upper limit of pullback zones 1 and 2.
- 66,810 JPY: 8/6 night high. Lower limit of pullback zone 1 / T1 / pullback zone 1.
- 66,720 JPY: 1H turning price. Core significant price.
- 66,350 JPY: 8/5 intraday high.
- 66,210 JPY: Upward milestone.
- 66,010 JPY: 15m turning price / retracement high. Trigger / core significance / complete retreat.
- 65,910 JPY: 15m pullback low (X = breached).
- 65,780 JPY: Current price / night close.
- 65,730 JPY: 1H around 80 EMA (4H 20 EMA equivalent).
- 65,650 JPY: 8/6 night low (recent reversal point). Upper limit of pullback zone 1 / T1 / core significance / trigger.
- 65,570 JPY: 4H 120 EMA (daily 20 EMA equivalent). Previously broken support band.
- 65,510 JPY: 8/5 high (broken) = support-turned. Lower limit of pullback zone 1.
- 65,370 JPY: Upward milestone. Upper limit of pullback zone 2.
- 65,060 JPY: 4H turning price. Lower limit of pullback zone 2 / T2 / T1 / core significance.
- 64,500 JPY: Lower milestone. Complete retreat / T2.
- 62,910 JPY: 1H pullback low. T2.
Trade Ideas
① Breakout Follow-Through (Long)
- Trigger: Recover 15m turning price 66,010 (15m turning price / rebound high) by 15m close (end of 15m down-move).
- Early entry price: 66,010. After rebound, measure back near breakout price or near the sloped 20 MA with a short-term chart (1m, 5m) to anticipate (back-entry; RR based on breakout price).
- Actual entry price: 66,720 (1H turning price) recovered by 1H close = completion of 1H down-move and core position.
- Stop/invalid: Early leg below 65,710; core below 65,650. Complete retreat below 65,060.
- Targets: 66,810 (partial profit + base), 67,140 / 67,670.
- RR: T1 (66,810) = 2.7 / T2 (67,140) = 3.8.
- MFE protection: take at +200 for base or small profit, or +300 to secure at least +100 or use trailing. Given the immediate rebound after a sharp reversal, expect limited bounce; if cannot recover above 66,810 and stalls, switch to method ③.
② Pullback Buy (Long)
- Standard conditions: Pull back to 65,510–65,650 (support-turned from 8/5 high to night low = reversal point) and confirm rebound shape with 15m close. The 1H MA bands and 4H 120 EMA create a zone conducive to rebound. Deep pullbacks would be 65,060–65,370 (in which case set stop at 64,960).
- Early entry price: 65,600. After rebound is confirmed by 15m close, ensure 20 MA is turning up and price recovers above 20 MA before entering early.
- Actual entry price: 66,010 (15m turning price) recovered by 1H close = core position.
- Stop/invalid: Early leg below 65,300; core below 65,060. Full retreat below 64,500 (switch to ④).
- Targets: 66,810 (partial profit + base), 67,140 / 67,670.
- RR: T1 (66,810) = 4.0 / T2 (67,140) = 5.1.
- MFE protection: +200 for base or small profit exit, +300 to ensure at least +100 or trailing. Zone is anchored to reversal points; MA bands are supportive but not used as breakout signals.
③ Pullback Sell (Short)
- Standard conditions: 66,810–67,140 (night high to daily 0.5 retracement) where price fails to clearly close above 66,810 by 15m close, signaling a continuation-failure. Zone 2 is 67,630–67,670 (stop loss at 67,770 in this case).
- Early entry price: 66,850. After stalling is confirmed by 15m close, anticipate near recent highs using 1m/5m or other short-term legs (avoid early shots above rising 20 MA).
- Actual entry price: 65,650 (night low = reversal point) breached by 1H close = stronger evidence of failed upward move; core position reached T1; add to core after partial profit taking.
- Stop/invalid: Early leg back to 67,150; core back to 66,010. Full retreat to 67,930.
- Targets: 65,650 (partial profit + base), 65,060 / 64,500.
- RR: T1 (65,650) = 4.0 / T2 (65,060) = 6.0.
- MFE protection: +200 for base or small profit exit, +300 to secure at least +100 or trailing. Do not place sells below already-formed levels. In an uptrend, avoid excessive chasing; if T1 is reached on the trigger, skip further moves.
④ Breakout Follow-Through (Short)
- Trigger: Break 65,650 (night low = point that reversed the decline from 66,810) on 15m close.
- Early entry price: 65,650. After breakdown, measure back near breakout price or near a sloped 20 MA with short-term legs (1m, 5m) for anticipation (back-entry; RR based on breakout price).
- Actual entry price: 65,060 (4H turning price) broken by 1H close = 4H up-move collapses and core position forms. At this point, T1 has been reached; partial profit-taking and base-move, then add core position.
- Stop/invalid: Early leg back to 66,000; core back to 65,650. Full retreat to 66,010.
- Targets: 65,060 (partial profit + base), 64,500 / 62,910.
- RR: T1 (65,060) = 1.7 / T2 (64,500) = 3.3. 65,510 and 65,370 have RR below 1.0, so they are not used for T1.
- MFE protection: +200 for base or small profit exit, +300 to secure at least +100 or trailing. Do not place sells below already-formed levels. As this is a counter-trend within an uptrend, avoid over-pursuit; if T1 is reached on the confirming foot, skip further action.
Current Action
- Most important Line 1: 66,810 JPY. Night high. If exceeded, up move continues; the opportunity to follow comes with the close recovery of 66,010 (early 66,010, core at 66,720 with 1H close recovery). If not exceeded and price stalls, it signals trend continuation failure leading to a pullback sell (early 66,850).
- Most important Line 2: 65,650–65,510 JPY. Night low (reversal point) to 8/5 high support-turned. A favorable area where 1H MA bands and 4H 120 EMA cluster, making rebounds easier; rebounds would be pullback buys (early entry 65,600). If 65,650 breaks, trigger ④ (early 65,650) and if 65,060 breaks, upward structure collapses.
Entry price, trigger, and stop are set based on the chart shape at close time (turning prices, pullback lows, rebound highs for each timeframe). As time passes and structure changes, if there is no change in the higher-timeframe structure, adjust entry prices using the lower-timeframe turning prices (e.g., when a shorter timeframe enters a pullback up move and then turns into a down-move), selecting the option that aligns most with actual conditions.
※ This report is provided for information purposes and is not investment advice; trading decisions are at your own risk.