
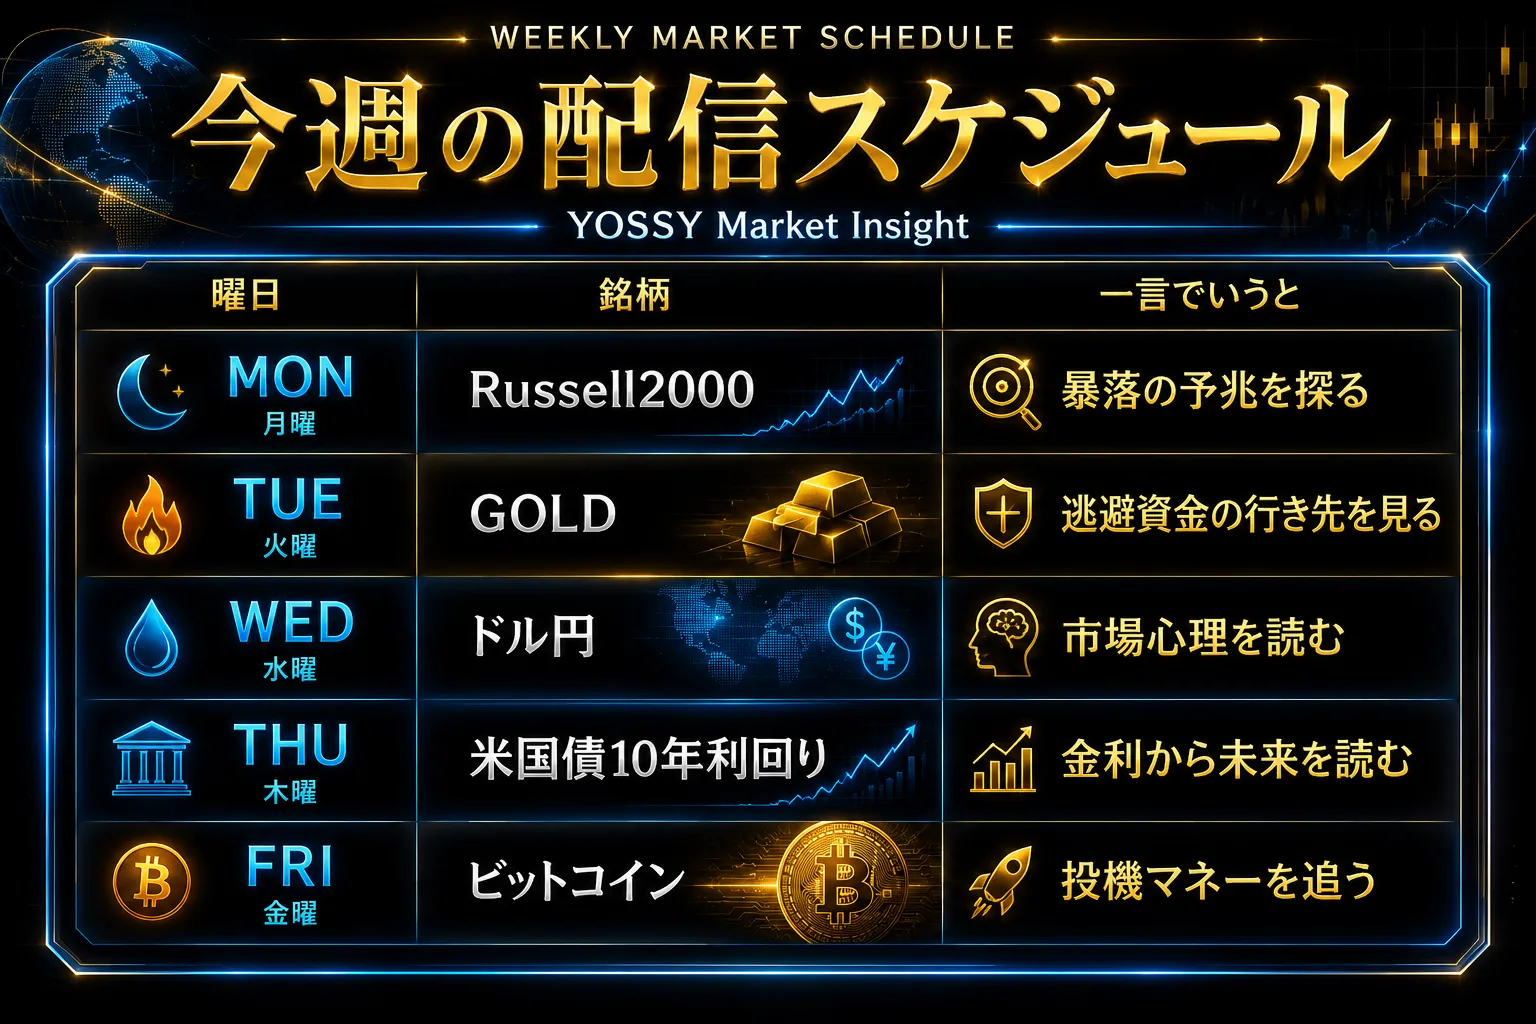
August 6 (Thu): 【BB & HM】 Nikkei 225 vs U.S. 10-year Treasury yield
This time
is referred to as the "temperature of the economy"
and the comparison with the “U.S. 10-year Treasury yield”
will be conducted.
【Overall Scenario Probability】
This week's overall market is…
“Rise: 65% / Fall: 35%”
Note: As the four major U.S. indices rise across all constituents and the Nikkei 225 breaks above an important milestone, the display of the U.S. 10-year Treasury yield’s [Shark] ⇧ supports a rise in [inverse correlation].
Presented as a reference level.
【This Week's Market Focus Points】
This week's market shows the four major U.S. indices moving into an expansion of gains, with overall upward momentum increasing. A new appearance of [Shark] ⇧ in the U.S. 10-year Treasury yield suggests that, should it descend to the [PRZ], the scenario of continued gains in the four major U.S. indices via inverse correlation would be consistent.
The key focus this week is the tug-of-war at important moving averages for the U.S. 10-year Treasury yield, and price action here is likely to influence the overall market direction.
Details will be explained in the paid section.
➥The rest is explained in more detail in the members-only report.
If you are not yet registered, please click here ↓
【Integrated Edition】
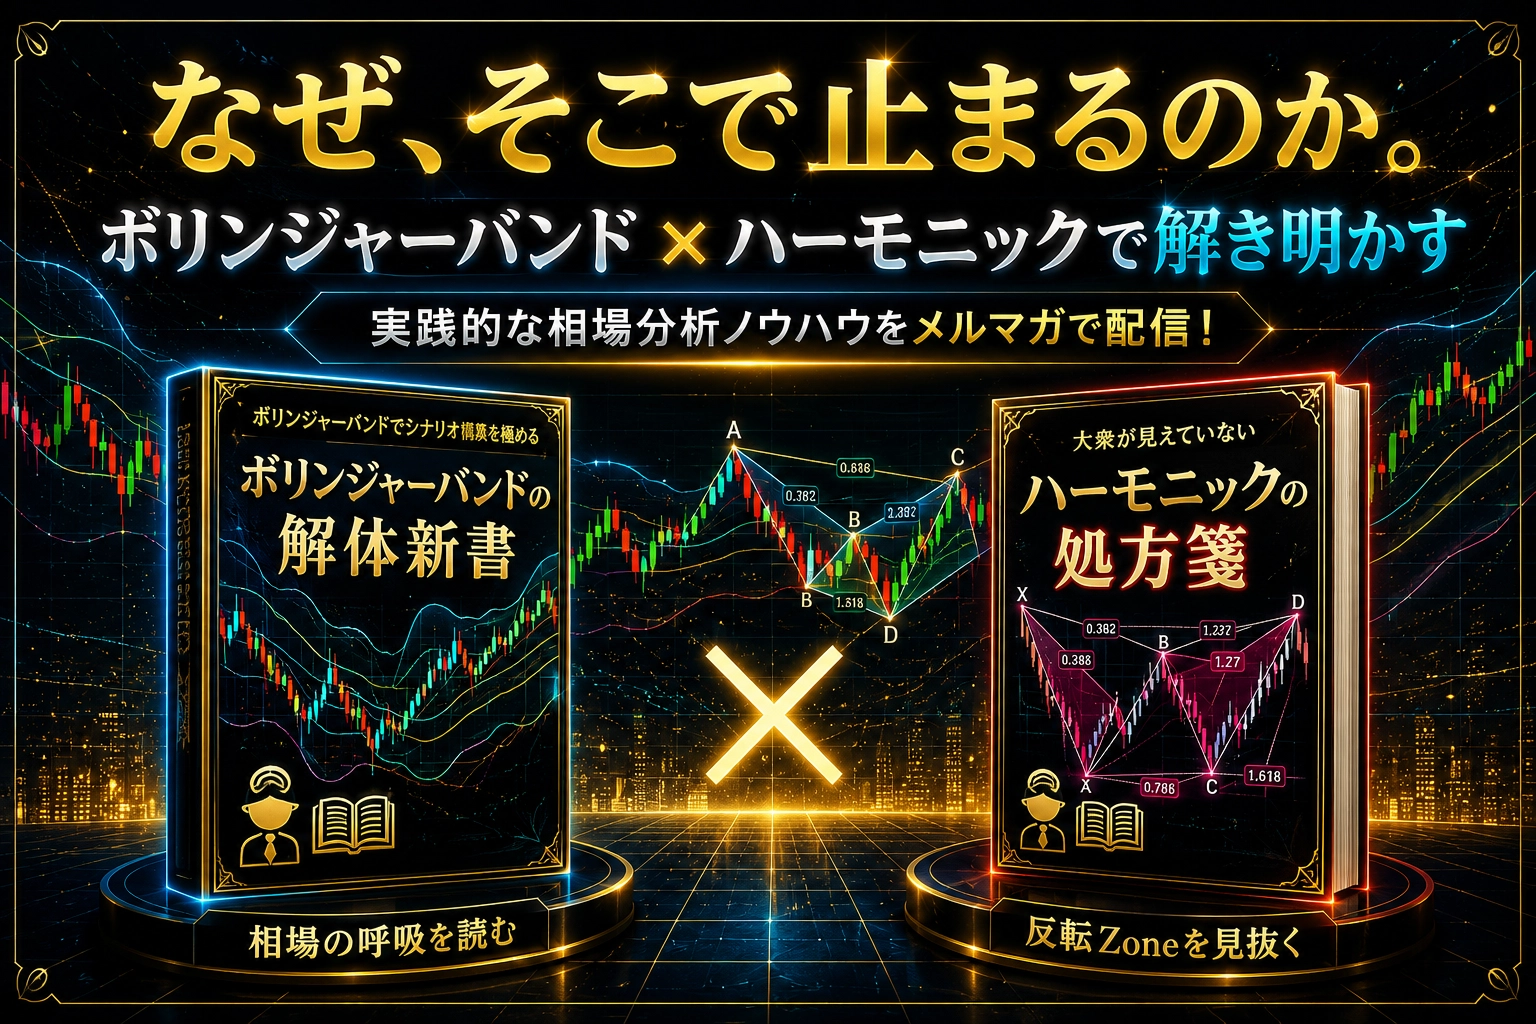
“Why does the market stop there? Bollinger Bands ✕ Harmonics: Fusion of statistics and geometry to precisely capture market turning points!”
https://www.gogojungle.co.jp/finance/navi/series/1613?via=articles_detail_aside
(※From here on, it is for members only.)
--------------------------------
【Environmental Perception】