
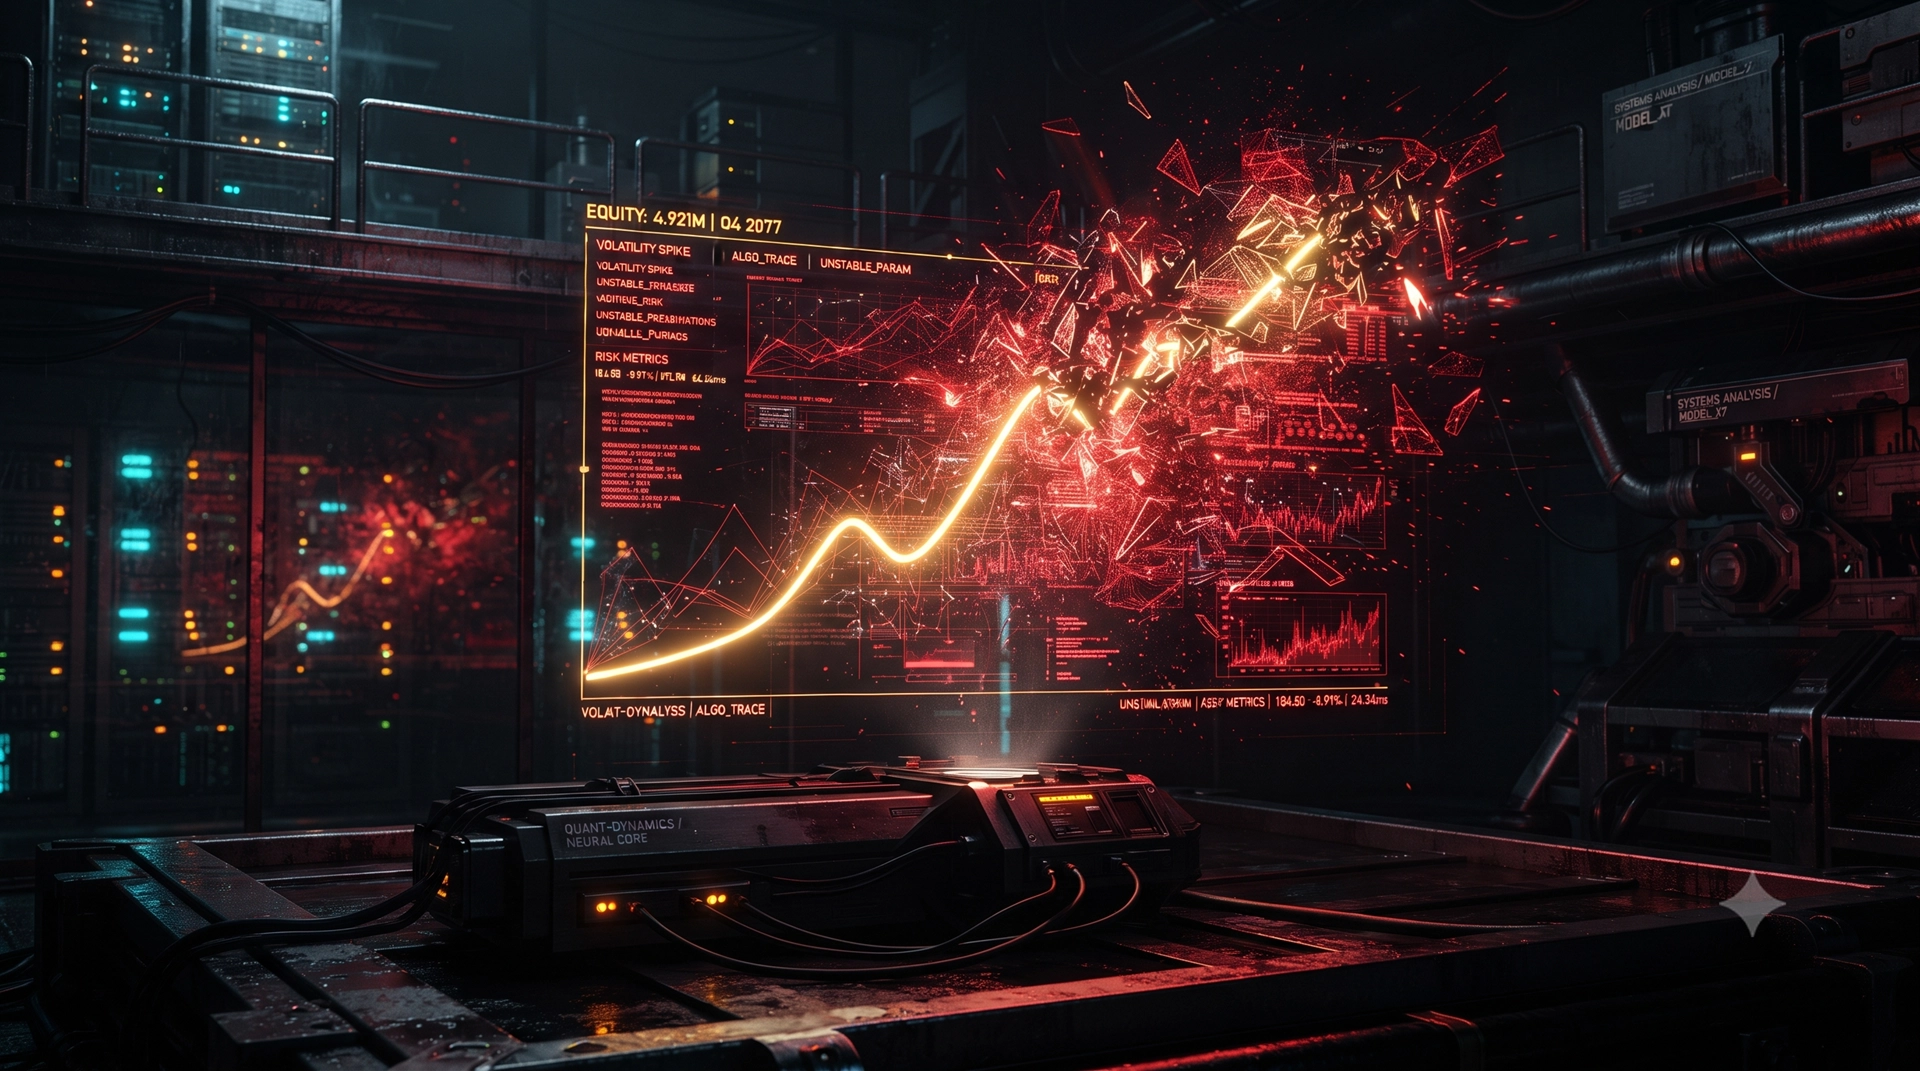
[Laboratory Development Perspective] Deconstructing Backtesting: The Illusion of a Continuously Rising Trend and the "Valley of Death" of Live Ammunition ~
In the development domain of system trading and EAs (expert advisors / automated trading), much of the test data shared with us at Semura Lab. paints a remarkably steadily rising equity curve.
However, immediately after deploying a finely optimized system to real-money (forward) environments, performance deteriorates rapidly and often falls into the “Valley of Death.”
In this voyage log, from an engineering perspective, we dismantle the structural limits of the backtest environment, examine the vulnerabilities caused by over-optimization, and describe the verification architecture we employ to ensure “survival.”
Structural divergence between test environment and forward environment
Backtesting is an essential process to verify the logic’s edge. However, it does not contain the physical load that exists in actual markets.
Between the “sterile room” of the test environment and the “rough seas” of the real-money forward environment, there are clear parameter differences as follows.
| Verification items (noise factors) | Backtest environment (sterile room) | Real-money forward environment (reality) | Structural impact on the system |
| Spread variation | In principle constant or limited | Sudden widening at indicator releases or rollovers | Direct erosion of net profit per trade (edge) |
| Order execution (slippage) | Zero latency, perfect fill at specified price | Execution delay and price slippage due to liquidity changes | Negative deviation from expected value, logic delays |
| Volatility | Limited to historical data | Unpredictable liquidity distortions by unknown market participants | Functional failure of overfitted parameters (drawdown) |
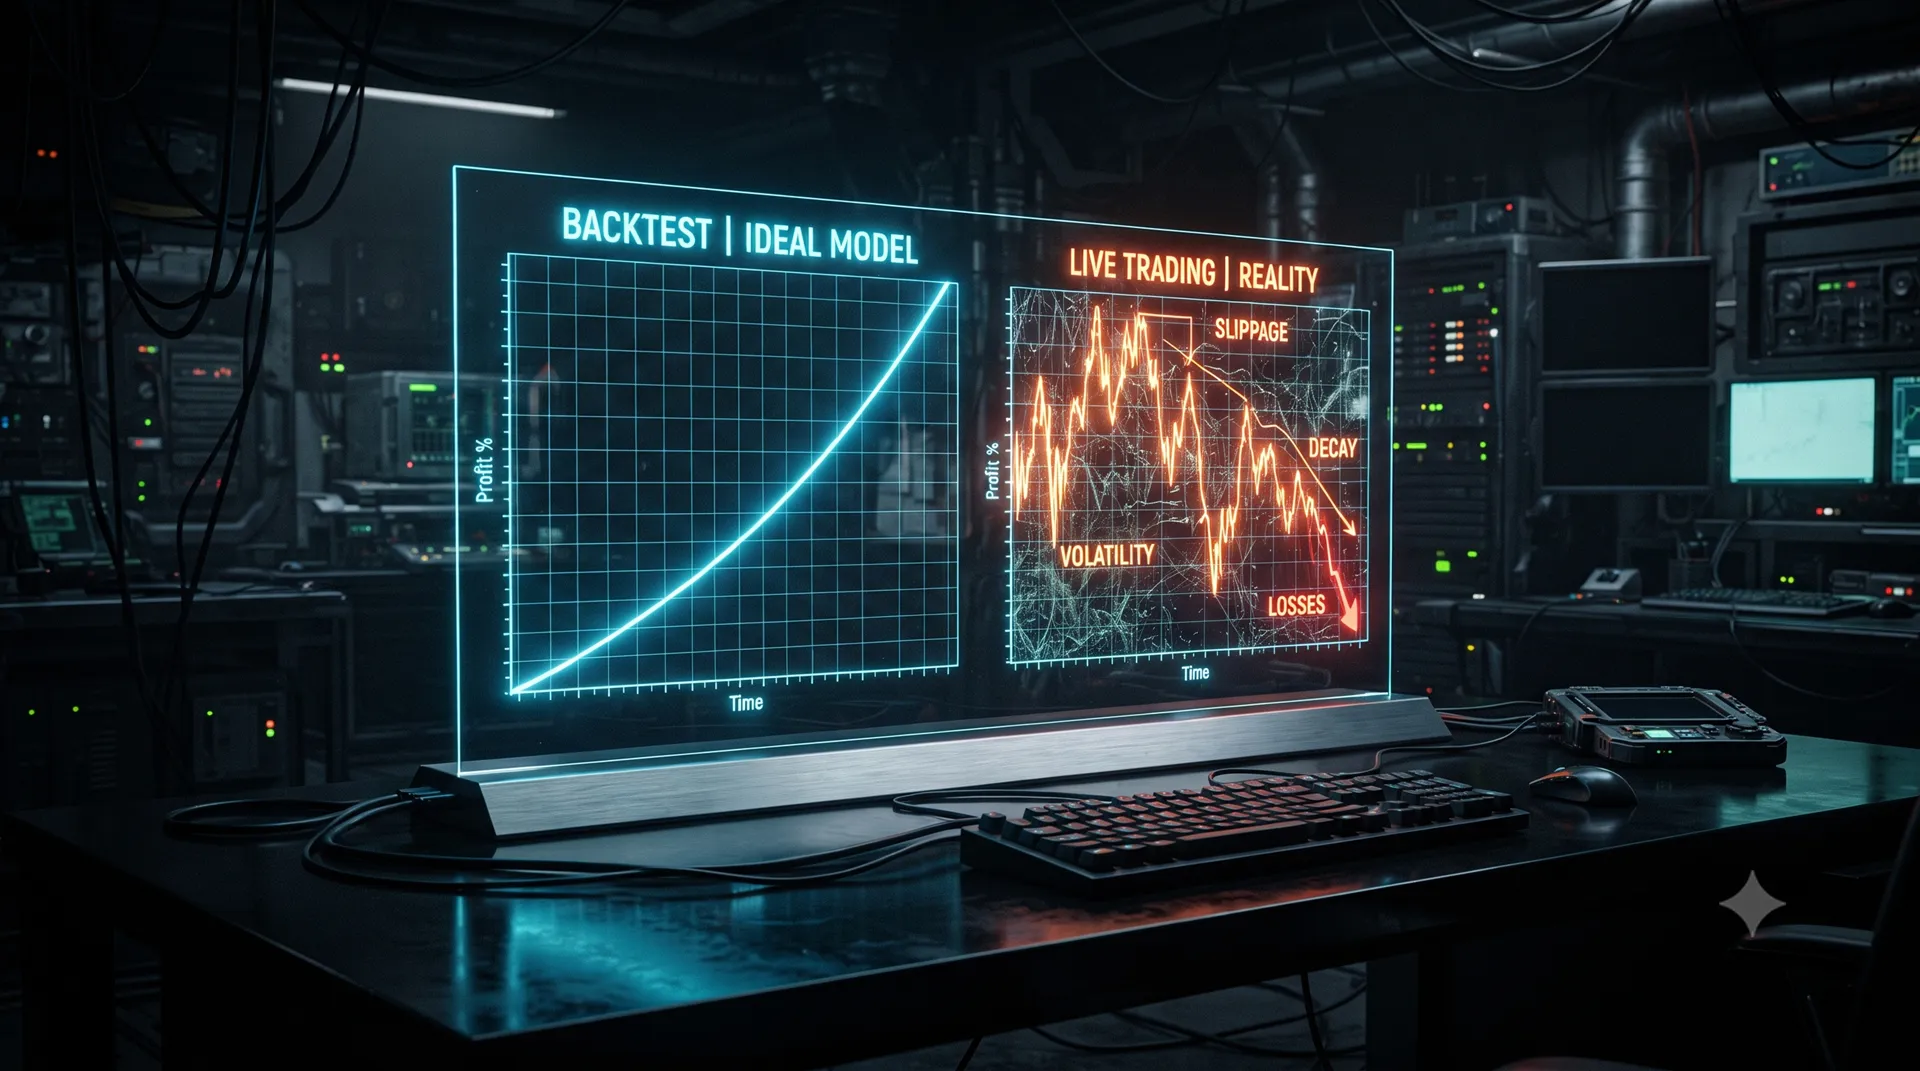
[Figure 1: Comparison between a beautifully curve-fitted backtest equity curve and live forward data where edge is eroded by slip and spread variation]
The moment the eliminated noise (spread and order delay) becomes apparent in the real-money environment, the rising-curve illusion collapses.
The “Valley of Death” produced by curve-fitting
If you add indicators’ variables and fit the system to historical data (curve fitting), mathematically it is easy to suppress drawdowns to the extreme.
However, a system perfectly adjusted to a specific past waveform lacks the “play (tolerance)” for unknown market fluctuations. As a result, the more beautiful the test results, the more fragile it becomes in real operation, unable to handle minute noises.
An architecture that guarantees robustness
In Semura Lab.’s process design, a visually pleasing backtest result is not a criterion for evaluation. The top priority is “survival” in harsh real-money environments.
Drawdown and sequences of losses are not bugs to be eliminated from the system; they must be embedded in the initial design (architecture) as an inevitable “tolerance to noise” in market structure.
Disclose all inconvenient facts (unfavorable annual data, etc.) and eliminate the black box. Extract only the fully causal logic such as market squeezes and surges, and continue verification by crawling through the Valley of Death of the Walk Forward Analysis, no matter how gritty.
This deductive design philosophy is what brings true robustness to the system, not fantasy.