

NK225 Futures MTF Dow Theory 4-Scenario Analysis Report 2026-08-05
NK225 Futures MTF Dow Theory Analysis Report
Date and Time: August 5, 2026 06:03 JST / Night Session Close
Current Value: 65,510 JPY
Subject: For Day Session (8/5, Wednesday)
Conclusion
In short, on 8/4 during the day session, a bullish break was established by closing above the 1H swing high of 64,180, reaching 64,300, then pulling back to 62,910. In the night session, price rose from 62,910, clearly surpassed the prior high of 64,300, and extended to 65,660 before settling at 65,510. The trend has been established, with the 4H also turning into an uptrend, and the daily candle showing a large bullish close of +2.52%. During Wednesday, the focus should be on buying the dip and following longs.
If 65,660 is closed above on a 15m basis, a follow-up long is warranted; if price bounces from the dip around 64,300–64,570, buy the dip. Do not place sells below the established levels; instead, enter in the 65,660–66,110 zone if price stalls after failing to move beyond 65,660. If 64,570 (1H turning point) is broken on a 1H close, the recent upward wave is invalidated; if 62,910 is broken, the breakout of 64,180 is confirmed as a failure. Since price has already reached the 4H120 EMA near 65,570 (the daily 20 EMA equivalent), keep upper-side protection in mind.
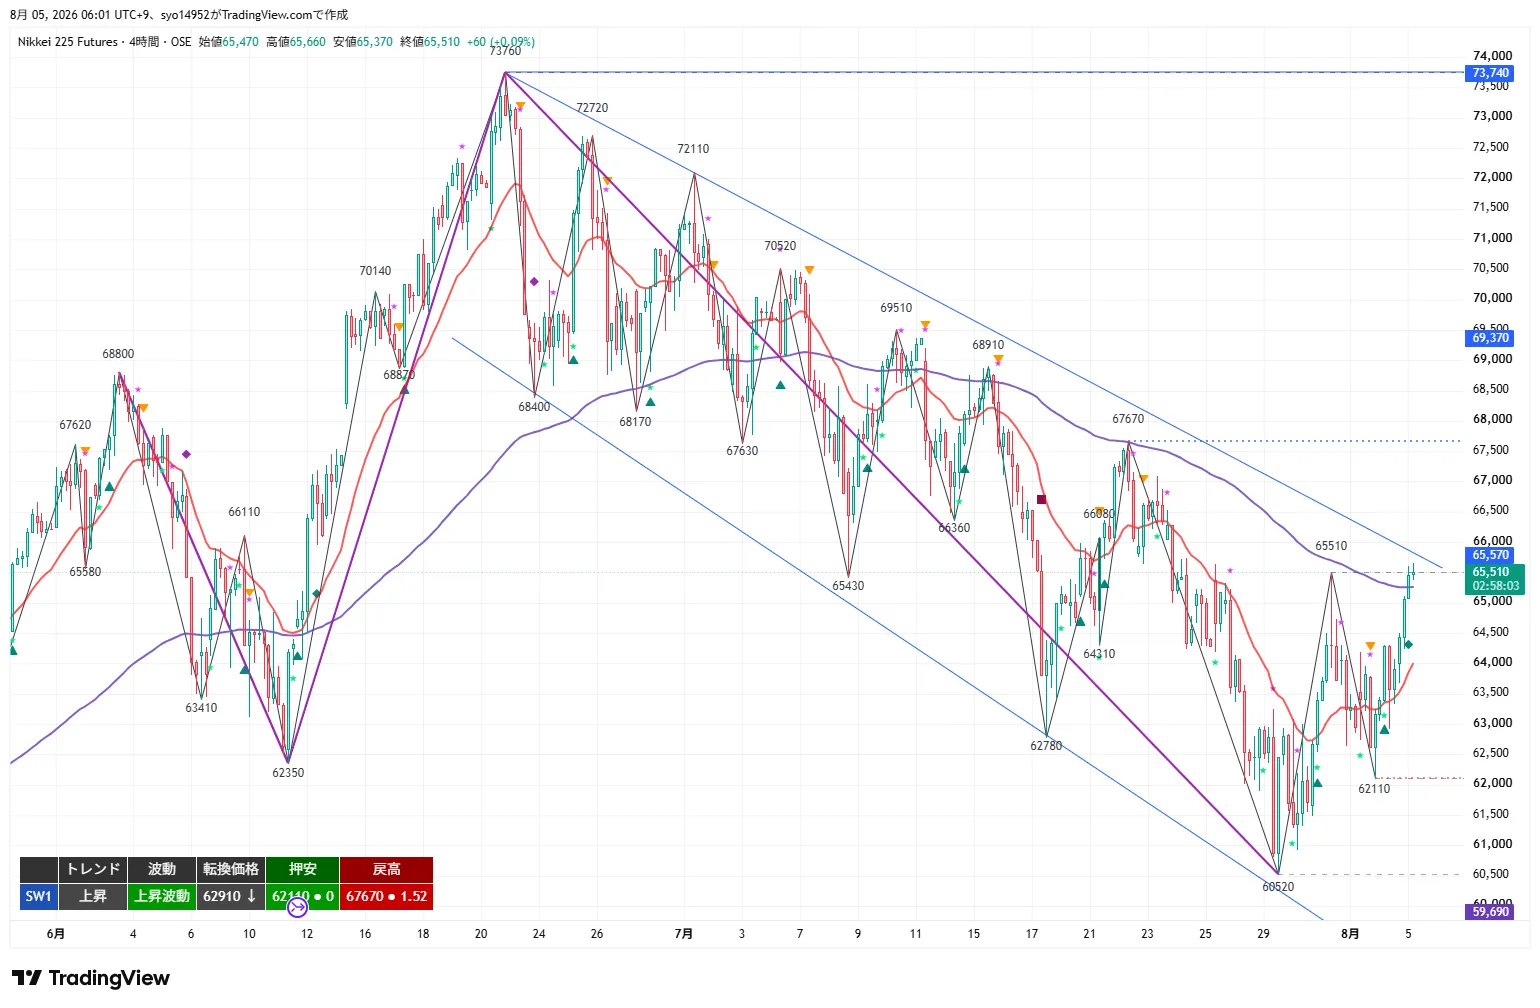
4H Analysis
The 4H chart shows a transition from a downtrend to an uptrend. From a low near 62,110, price retraced back up through the swing highs formed during the decline from 67,670, returning to 65,510 and closing higher with a bullish candlestick. The turning price is 62,910; the swing low is 62,110, both distanced downward. The 20 EMA (around 64,300) is rising, with price above it, and it has just reached the 120 EMA (roughly 65,570 on the daily equivalent 20 EMA) on a close.
Key upside targets: 66,110 (daily resistance zone), 66,360–66,730, and 67,670 (swing high). Support is at 64,570 (1H turning point), 63,960–64,180 (support-turned zone), 62,910 (turning price), 62,110 (swing low). As long as 62,910 holds, the 4H uptrend structure remains intact, but given the proximity to the 20 EMA band on the daily equivalent, upside moves may face some resistance.
1H Analysis
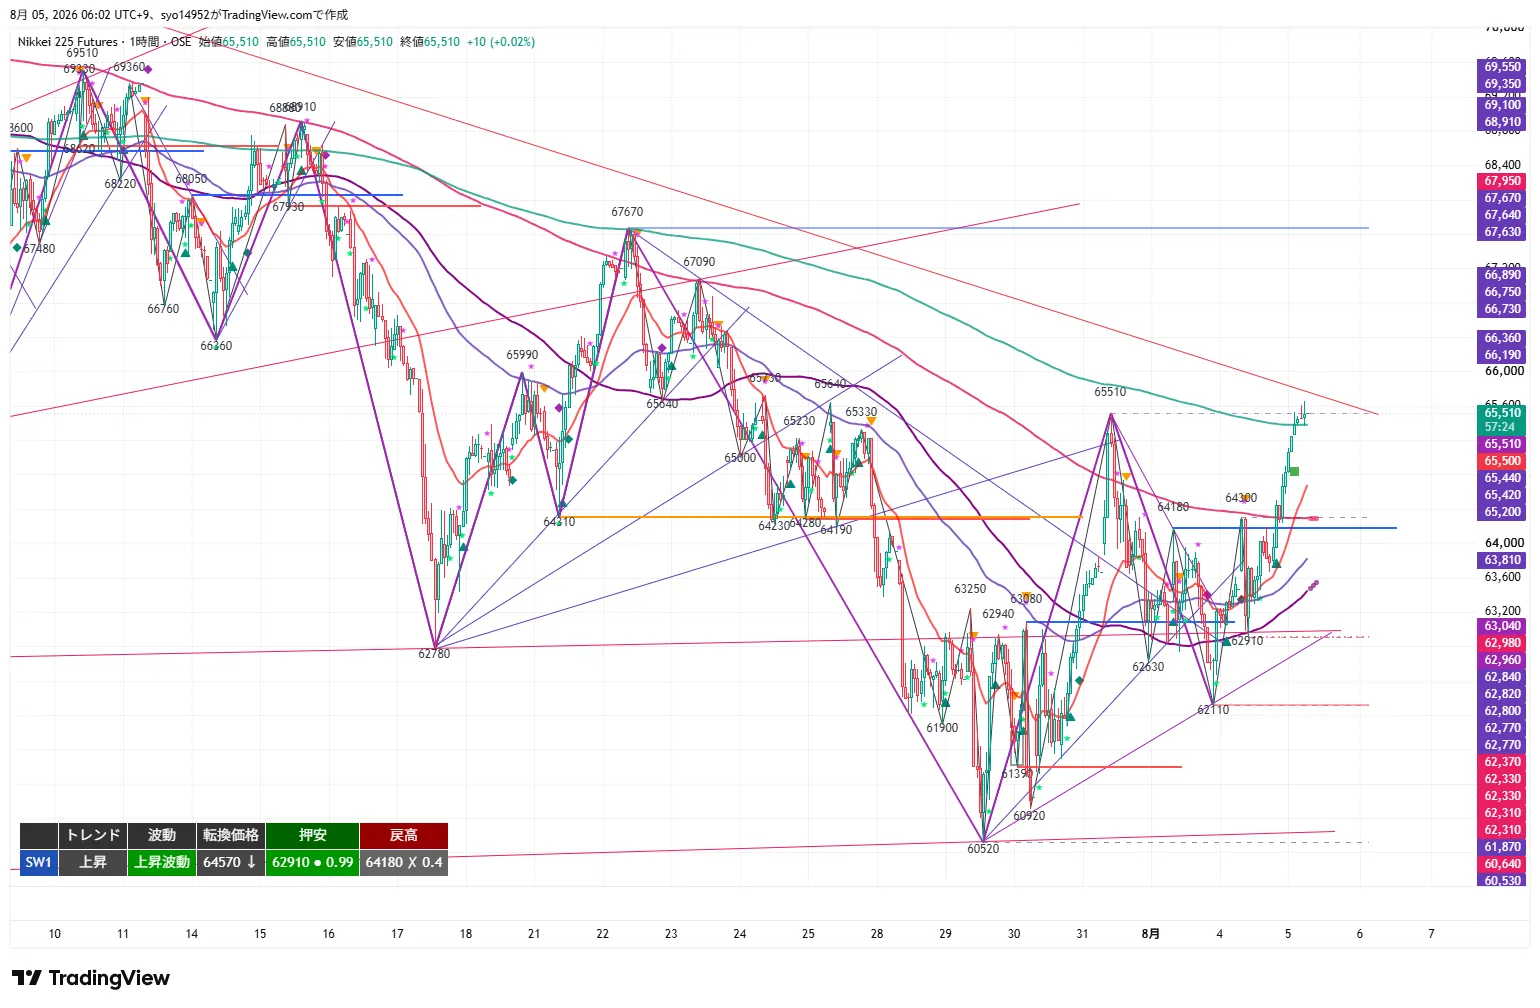
The core structural view comes from the 1H chart, showing an uptrend and an upward wave. The 64,180 swing high was exceeded on a close, price reached 64,300, then pulled back to 62,910. This pullback point is where the down move reversed; the decision whether the next upward wave can surpass the 64,300 breakout level determines if the trend is confirmed. Price indeed surpassed 64,300 and extended to 65,660, so the uptrend is considered confirmed. The turning price is 64,570, serving as the support for the current upward move. The 20 EMA and 80 EMA (4H equivalents) are rising, and the price remains above them, with the 120 EMA (daily equivalent around 65,440) also closed above.
If 65,660 is closed above, the up move should continue; if price fails to clear 65,660 and stalls, the uptrend continuation is in doubt, and a break below 64,570 on a 1H close would threaten the recent upward wave. If price falls below 62,910, the 64,180 breakout itself would be deemed a failed breakout.
15m Analysis
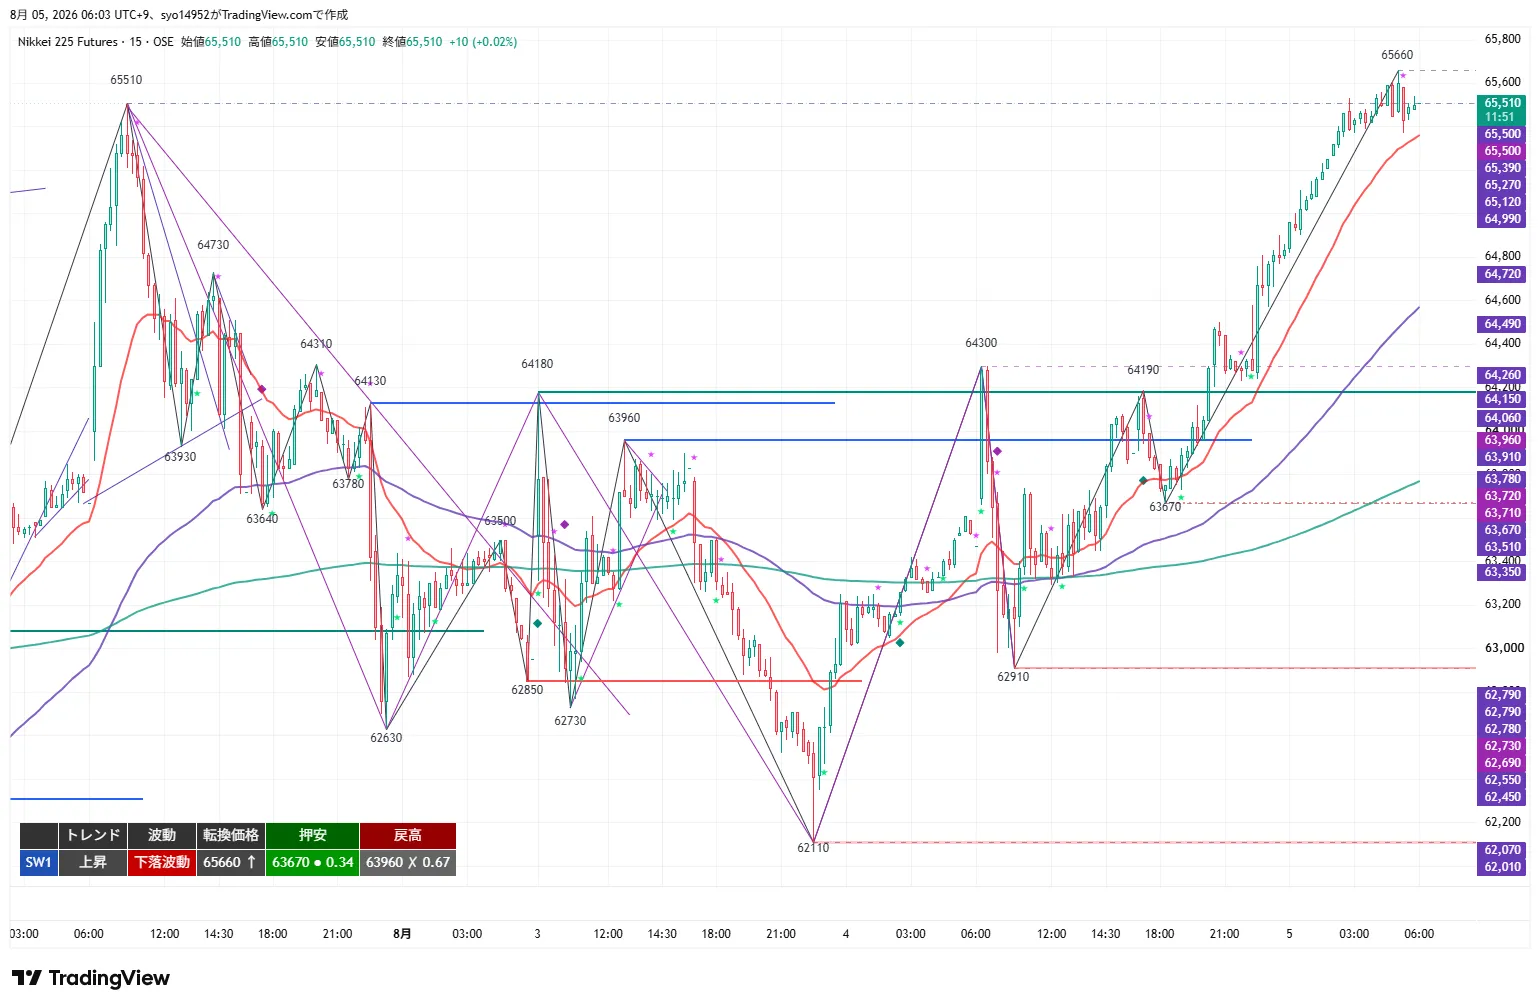
The 15m chart shows an uptrend with a minor pullback from 65,660 to 65,510, entering a corrective down move. The turning price is 65,660; the swing low is 63,670; the swing high is 63,960, which has already been broken. Price steps up from 62,910 to 63,670, 64,190 and surges to 65,660. The 20 EMA (around 65,200) is positively sloped, with price above it; the 80 EMA (around 64,700 on the 1H) and the 320 EMA (around 63,780 on the 4H) are both below price.
From an execution standpoint, a close above 65,660 on 15m marks a new high extension, while a dip to 64,300–64,570 and a rebound would indicate a dip-buying opportunity. Because the ascent is steep, expect both shallow pullbacks and deeper pullbacks toward around 64,180.
MTF State
- 4H: Up / Upward wave. From 62,110 low to 65,510, a +0.09% bullish candle. Turning price 62,910; dip low 62,110; swing high 67,670. The trend shifted from down to up. 20 EMA is rising; price is above it, with the 120 EMA (daily equivalent around 65,570) reached.
- 1H: Up / Upward wave. 64,180 closed above, then 64,300, then pullback to 62,910, and a breakout above 64,300 to 65,660. Turning 64,570; dip low 62,910; swing high 64,180 (X). All MAs are rising; the 480 EMA (daily equivalent) also surpassed on close.
- 15m: Up / Downward wave. From 65,660 to 65,510 a small pullback. Turning price 65,660; dip low 63,670; swing high 63,960 (X). 20 EMA has a positive slope; price is above it.
- Consistency: 4H and 1H both show uptrends/upward waves, 15m shows an uptrend with a small recent pullback, all aligned upward. The core approach is to buy on dips and chase breakouts; selling is reserved for failures of the uptrend and is limited to above recent highs. The 1H 80 EMA and 15m 320 EMA band around 63,780 can be used as support but not as a breakout criterion.
Key Prices
- 73,760 JPY: Daily swing high; upper bound target (for reference).
- 67,670 JPY: 4H swing high; upper bound of the upside and Complete retreat level 3.
- 66,730 JPY: Higher node; upper bound of Zone 2 for selling.
- 66,360 JPY: Higher node; lower bound of Zone 2 for selling.
- 66,110 JPY: Daily swing node; upper bound of Zone 1 for selling / T1 upper bound / trigger.
- 65,660 JPY: Night high on 8/5; 15m turning price. Trigger for entry, main position formation / Zone 1 lower bound of Zone 1 for selling.
- 65,570 JPY: 4H 120 EMA (daily 20 EMA equivalent); reached resistance band.
- 65,510 JPY: Current price / Night close.
- 65,440 JPY: 1H 480 EMA (daily 20 EMA equivalent). Closed above on the close.
- 64,570 JPY: 1H turning price (recent reversal point). Upper bound of Dip-buy Zone 1 / T1 / main formation / trigger.
- 64,300 JPY: 8/4 high (breakout high) = support-turned; lower bound of Dip-buy Zone 1.
- 64,180 JPY: 1H old swing high (X) = support-turned; upper bound of Dip-buy Zone 2.
- 63,960 JPY: 15m old swing high (X) = support-turned; lower bound of Dip-buy Zone 2 / T1.
- 63,780 JPY: 15m 320 EMA (4H 20 EMA equivalent). A zone that tends to hold on rebounds.
- 63,670 JPY: 15m dip low; ④ Main formation.
- 62,910 JPY: 4H turning price / 1H dip low (trend reversal point). Breaking below confirms failure / zones ③, ④ T2.
- 62,110 JPY: 4H dip low; ④ T2.
- 60,520 JPY: Daily turning price / structural low.
Trade Ideas
① Breakout Follow-Through (Long)
- Trigger: Break above 65,660 (8/5 night high / 15m turning price) on a 15m close (new high chase).
- Leading Entry Price: 65,660. After the breakout, pullbacks toward the breakout price vicinity or toward the sloped 20MA on a few minor bars (1m, 5m) as a front-run (back-entry; RR based on breakout price).
- Actual Entry Price: 65,660 recaptured on a 1H close = main position formation (two-step confirmation from 15m front-run to 1H confirmed).
- Stop loss / invalidation: Front-run below 65,360; main position below 64,570. Complete exit below 64,570.
- Targets: 66,110 (partial take + breakeven), 66,730 / 67,670.
- RR: T1 66,110 = 1.5; T2 66,730 = 3.6. Since T1 is not wide, emphasize back-entry.\n
- MFE protection: partial exit at +200; secure at least +100 or use trailing at +300. Since the move is from the 4H 120 EMA / daily 20 EMA band, protect early.
② Buy the Dip (Long)
- Standard condition: Dip to 64,300–64,570 (August 4 breakout high = support-turned to 1H turning price) and confirm rebound on 15m close. Deep pullbacks to 63,960–64,180 (support-turned zone) should have the stop at 63,620.
- Leading Entry Price: 64,500. After rebound is confirmed on 15m close, ensure price is above the rising 20MA and take the lead.
- Actual Entry Price: 65,660 recaptured on a 1H close = restart of new high chase; main position formed. At this point, some profit-taking and base price adjustment should be done, and additional quantity added to the main position.
- Stop loss / invalidation: Front-run below 64,200; main position below 63,670. Full exit below 62,910 (switch to ④).
- Targets: 65,660 (partial take + breakeven), 66,110 / 66,730.
- RR: T1 65,660 = 3.9; T2 66,110 = 5.4.
- MFE protection: +200 for breakeven or small profit exit; +300 to secure at least +100 or use trailing. Zone is anchored to reversal point, considering both shallow pullbacks and deeper pullbacks toward around 64,180.
③ Sell the Rally (Short)
- Standard condition: In the 65,660–66,110 zone (Night high to daily pivot), confirm on a 15m close that price cannot clearly close above 65,660, risking a continuation failure. Zone 2 becomes 66,360–66,730 (in this case, stop at 66,830).
- Leading Entry Price: 65,700. After the stall is confirmed on a 15m close, measure around the recent high on small timeframes (1m, 5m) to take a lead entry (avoid premature entry above rising 20MA).
- Actual Entry Price: 64,570 (1H turning price = reversal point) break on 1H close = main position formation; at this point, some profit-taking and base price adjustment should be done and additional main position added.
- Stop loss / invalidation: Front-run recovers to 66,000; main position recovers to 65,660. Full exit at 67,670. If 66,110 is broken on a 1H close, invalidate zone 1 selling and wait for zone 2.
- Targets: 64,570 (partial take + breakeven), 63,960 / 62,910.
- RR: T1 64,570 = 3.8; T2 63,960 = 5.8.
- MFE protection: +200 for breakeven or small profit exit; +300 to secure at least +100 or use trailing. Do not initiate sell below established support on rising trend; avoid overextending. If trigger is confirmed and T1 reached, skip further entries.
④ Breakout Follow-Through (Short)
- Trigger: Break below 64,570 (1H turning price = reversal point supporting the 65,660 rise) on a 15m close (the recent upward move collapses).
- Leading Entry Price: 64,570. After break, measure pullbacks toward the breakout price vicinity or the tilted 20MA on short timeframes (1m, 5m) as a front-run (RR based on breakout price).
- Actual Entry Price: 63,670 (15m dip low) break on 1H close = main position formation.
- Stop loss / invalidation: Front-run recovers to 64,920; main pos recovers to 64,570. Full exit at 65,660.
- Targets: 63,960 (partial take + breakeven), 62,910 / 62,110.
- RR: T1 63,960 = 1.7; T2 62,910 = 4.7. Since T1 is not wide, back-entry remains essential.
- MFE protection: +200 for breakeven or small profit exit; +300 to secure at least +100 or use trailing. Breakout reference is set at reversal point; do not use 1H 80 EMA or 15m 320 EMA as breakout criteria. If 62,910 is broken, the trend failure is confirmed, making T2 the center.
Current Actions
- Most critical Line 1: 65,660. Night high / 15m turning price. Close above triggers follow-on long (leading 65,660). If not cleared and price stalls, this indicates a trend continuation failure and sets up a reversion sell (leading 65,700). Just above lies the 4H 120 EMA around 65,570 as a nearby resistance to protect against.
- Most critical Line 2: 64,570–64,300. 1H turning price (reversal point) to 8/4 breakout high (support-turned). Rebounds in this zone indicate buying the dip (leading 64,500). A break below 64,570 on a 1H close triggers the ④ trigger (leading 64,570), and a break below 62,910 confirms trend failure.
Entry prices, triggers, and stops are set based on the chart shapes at the time of close (turning prices, swing lows, swing highs of each timeframe). If the structure changes over time but higher-timeframe structure remains, adjust entry prices using turning points on lower timeframes (e.g., 15m) and choose the option that aligns best with the current reality.
Note: This report is for information purposes and does not constitute trading advice; please make investment decisions at your own risk.