

【L Sign】Result Report July 2026
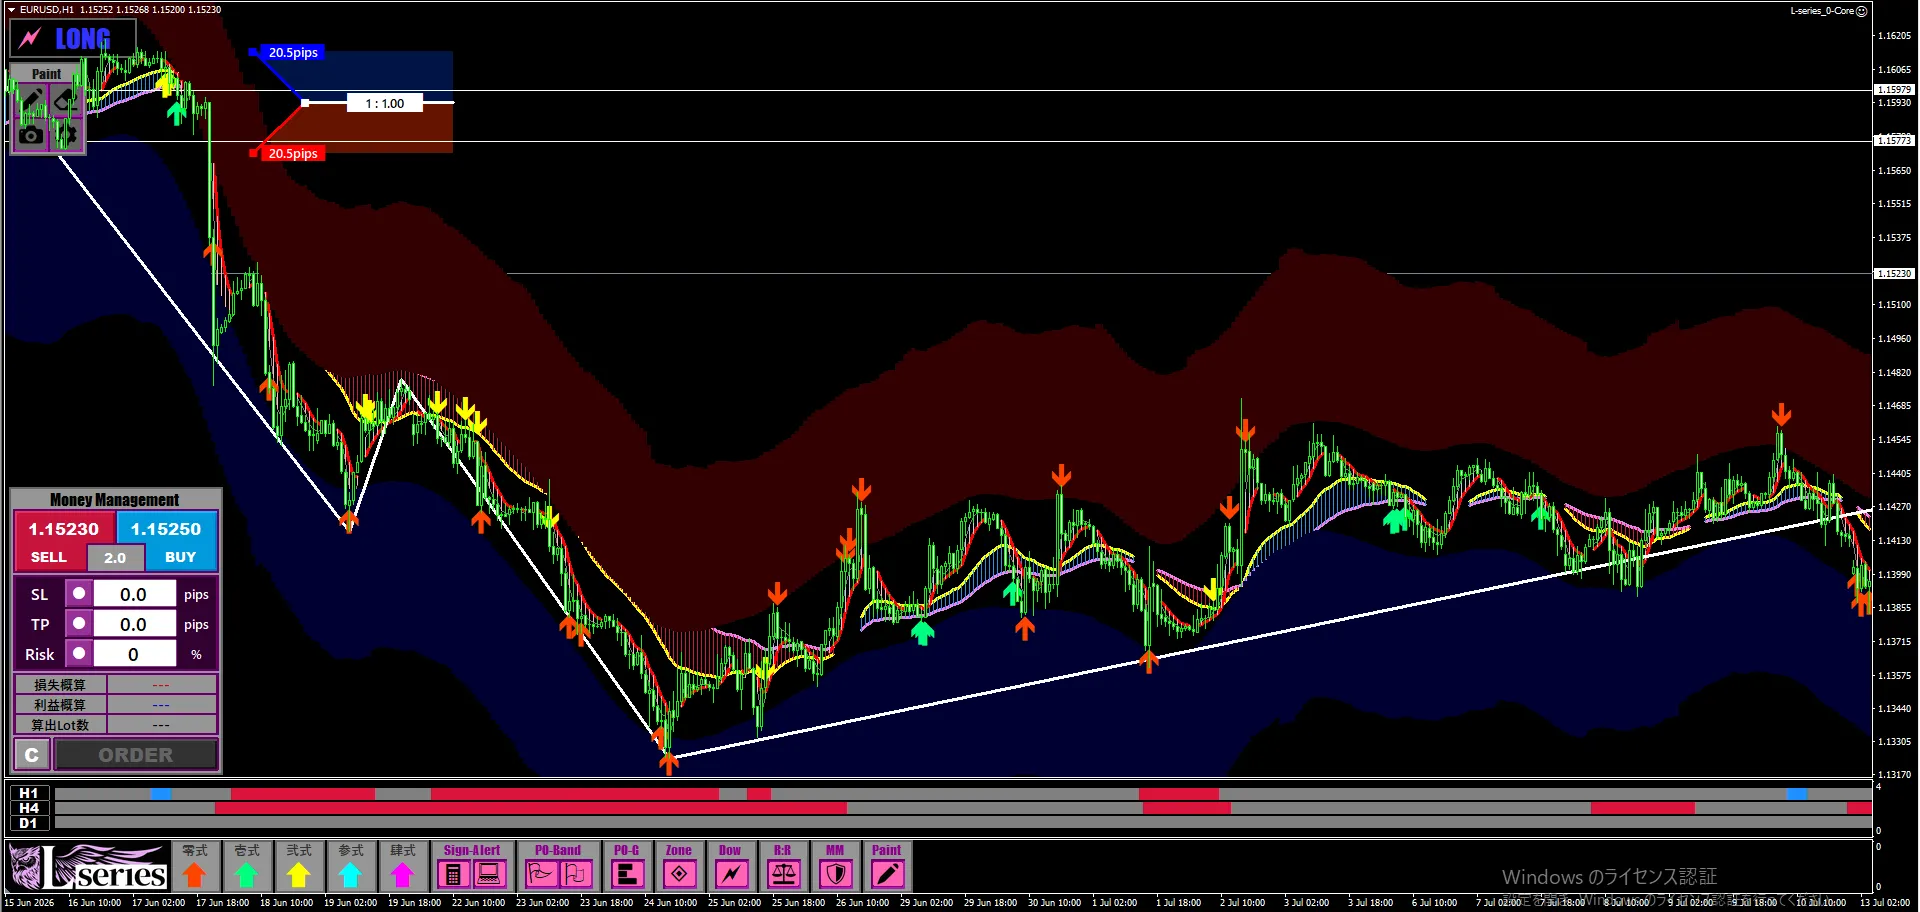
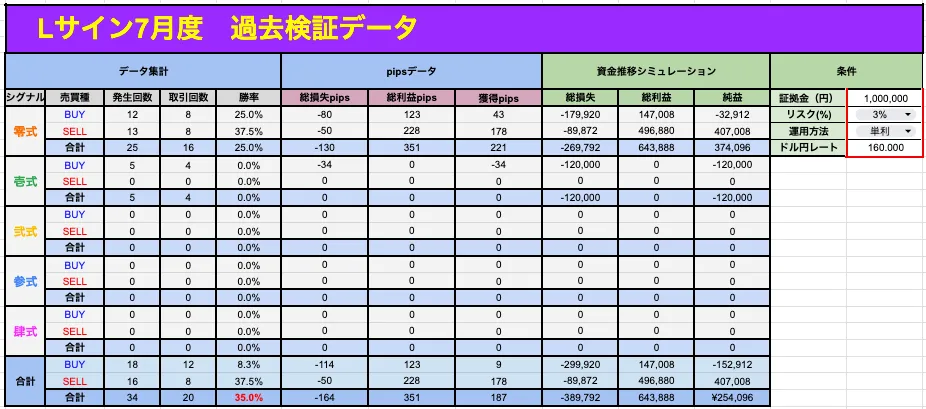
Trade signals: 20
Initial margin :1,000,000 JPY
Loss amount :-389,792 JPY
Profit amount :+643,888 JPY
Total profit :
〜Trading rules〜
To compare monthly cash flow, you need to tally with the same standard every month.
The main aggregation conditions for this time are as follows.
・Trade only EURUSD
・Target scenarios where L-signal is displayed
・Take profit and stop loss based on the most recent high and low
・Single-trade risk:【〇%】
・Simultaneous holding rule:【as described】
・Trading rules at data release:【as described】
・Spread:【not included】
・Trading times:【as described】
When publishing actual results, we will clearly state under what conditions trades were made each month.
If trading rules change, the results for the same signal can change.
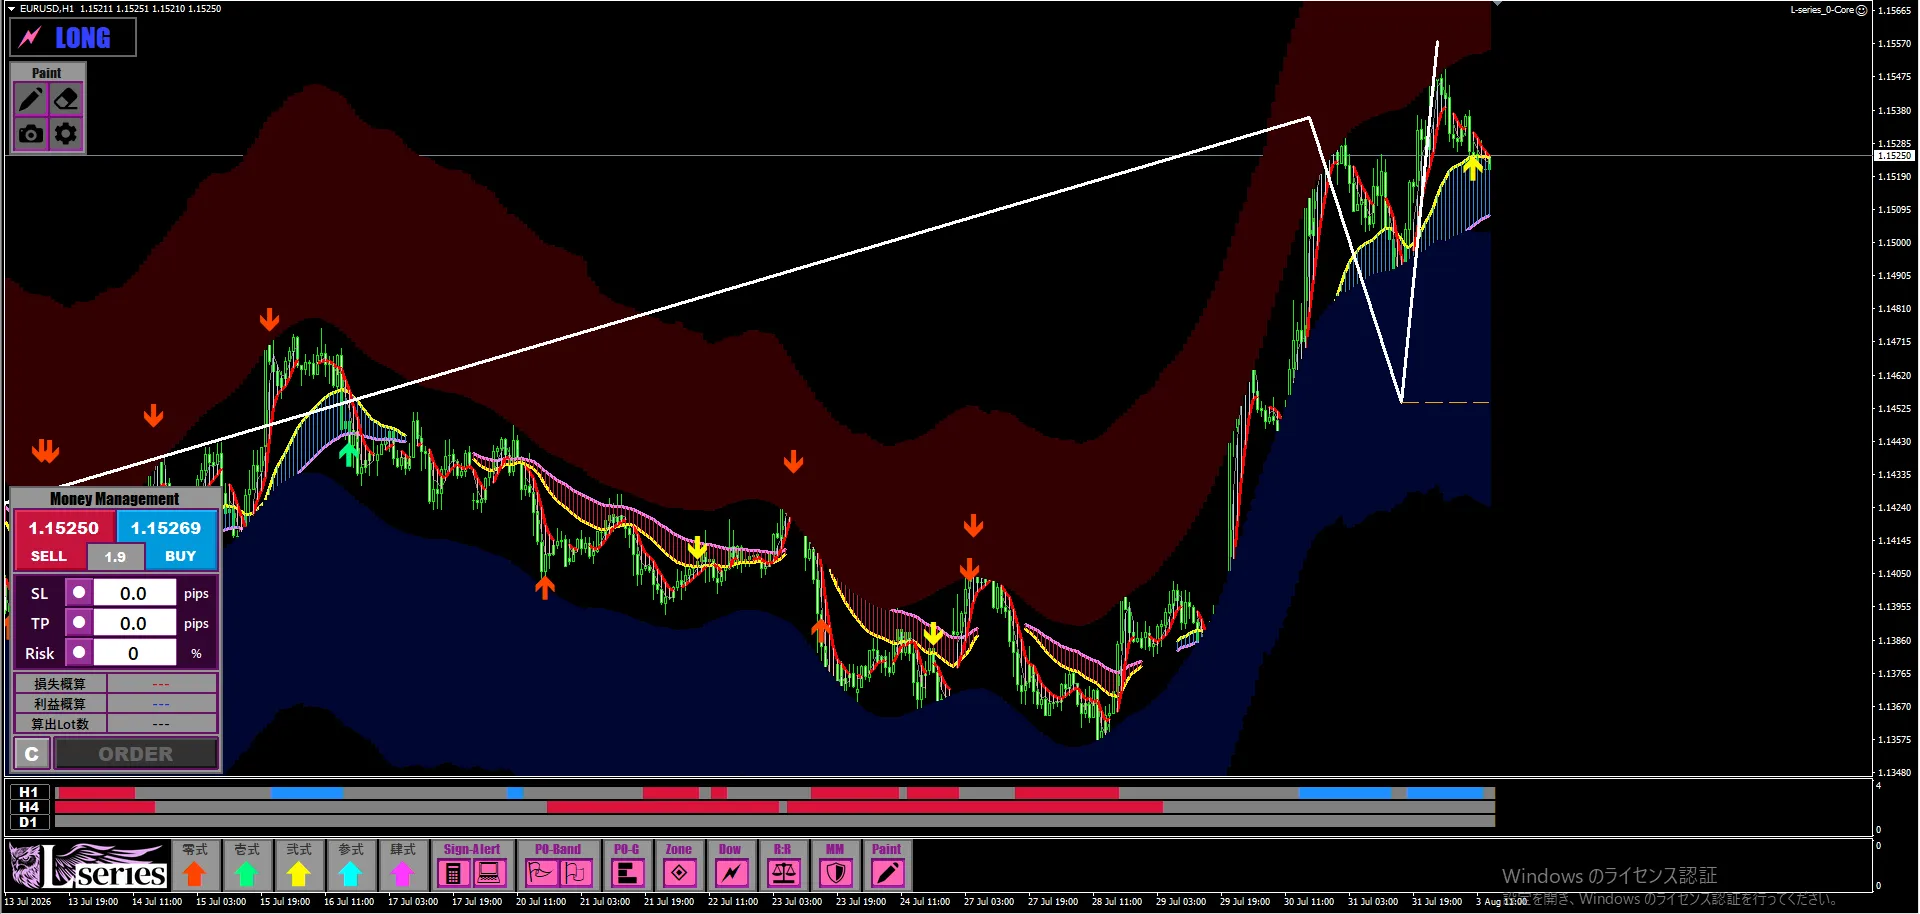
We will also attach trading images
Click here to TAP the PDF image of all July signals
【Creator Leo's personal assessment】
|Results are good, signals and discretion were supported by a favorable market environment
The win rate is not great, but it is a month where risk-reward covers it.
Last month had a win rate in the 70% range, so considering 50% of L signals, the win rate seems coherent.
Still, profit remains due to proper money management.
This month also saw a mild downtrend,
where “Zero” showed its true value.
From a trading basis, there were many zero-style signals, and I avoided other entries besides selling from above, achieving good results.
Given the market environment favored buying dollars and selling dollar indices,
I aggressively took EURUSD sell signals and avoided others, which increased win rate, but ultimately entering all signals yielded more profit,
so indeed L-signal is formidable...
that month.
〜〜〜〜〜〜〜〜〜〜〜〜〜〜〜〜〜〜〜〜〜〜
▼▼▼
What is an L-signal? A EURUSD-only tool with 5 signals
to target various market scenarios
Hello, this is Leo.
This time, based on my FX experience, I will introduce in detail the EURUSD-exclusive signal tool called “L-signal.”
When you hear signal tools,
“If a signal appears, simply trade as is.”
Some people may have that image.
However, markets have trends and ranges.
There are times of strong upward trends, at which prices peak or bottom and reverse dramatically.
It is not easy to respond to all market conditions with a single condition.
Therefore, L-signal employs five signals—Zero, Ichi, Ni, San, Shi—to target different market situations.
In the latter part of this article,
・What L-signal is
・Differences among the five signals
・Historical verification results
・What to be mindful of when actually using it
will be explained in order.
L-signal is an EURUSD-exclusive signal tool

L-signal is a MT4 signal tool that targets only EURUSD.
By focusing analysis on EURUSD rather than monitoring multiple currency pairs, it minimizes confusion about which currency to trade.
Concentrating on a single pair provides advantages such as:
・Less confusion about which currency to trade
・Ability to consistently observe similar price movements of the same currency
・Easier to verify signal-specific characteristics
・Easier to compare past trades with current market conditions
L-signal is not simply five signals just to increase the count.
Each signals handles different timeframes and market regimes, designed to find multiple opportunities within EURUSD.
Why are 5 kinds of signals necessary?
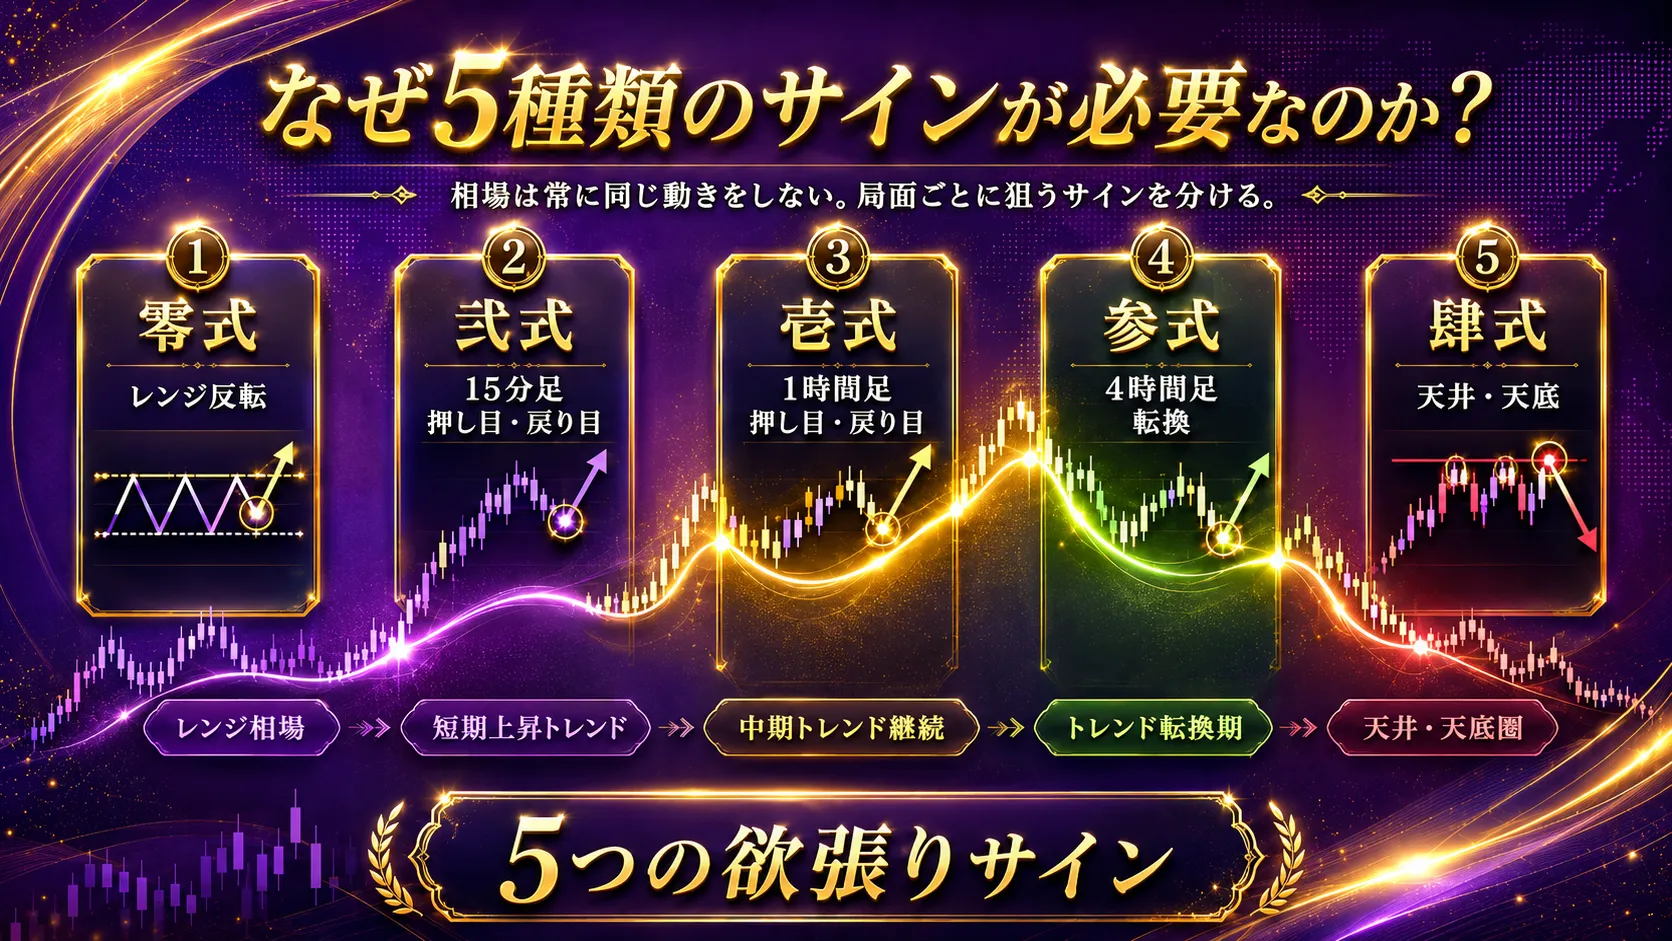
The market does not always move in the same way.
In ranging markets without a clear trend, signals that chase a trend can become less effective.
Conversely, in strong trending markets, continuing to target peaks and troughs can become counter-trend trading.
Therefore, in L-signal, instead of relying on a single signal for everything, signals are divided by the market phase.
By using five types of signals, you can target different scenarios such as:
・Reversals within a range
・Pullbacks and rallies on 15-minute charts
・Pullbacks and rallies on 1-hour charts
・Breaks on 4-hour charts
・Major highs and lows
Thus, L-signal is described as the “five greedy signals.”
⚫︎Zero|Targeting reversals in a range market
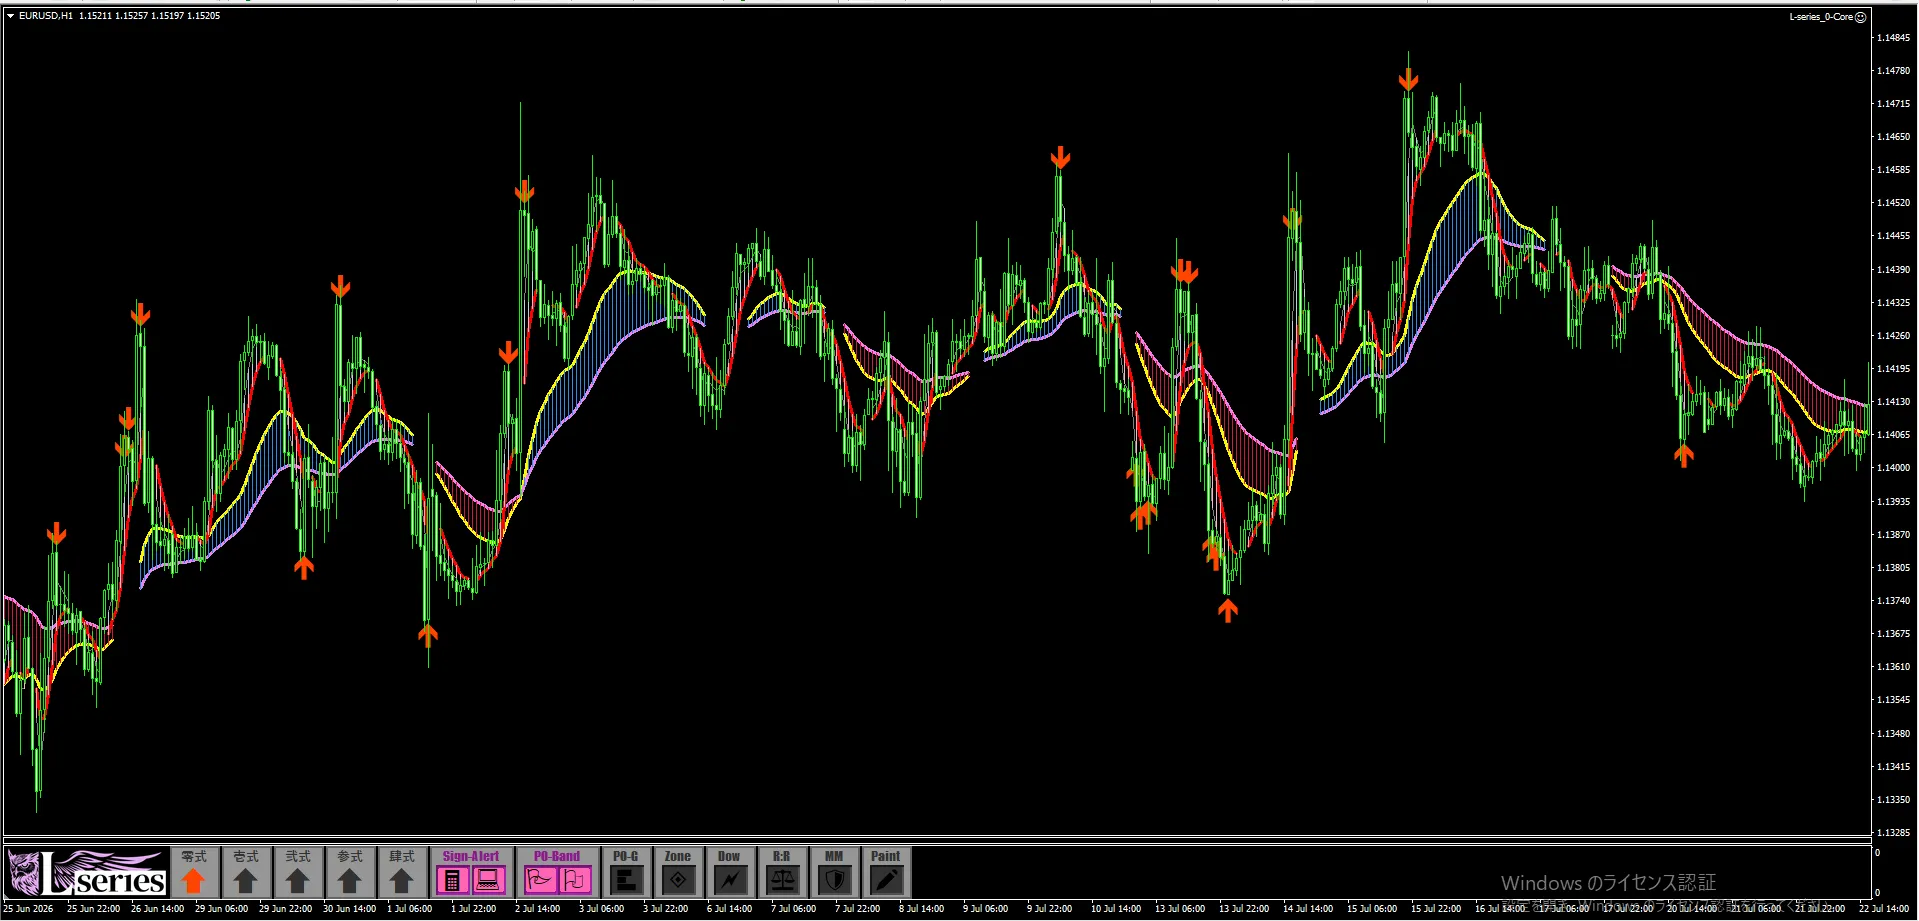
Zero is a signal strong in range markets.
The annual occurrence is often over 300 times, making it one of the more frequent signals within L-signal.
It tends to appear on 15-minute or 1-hour charts where prices form short-term highs or lows.
Characteristics of Zero include:
・Target reversals in range markets
・More than 300 signals per year
・Common on 15-minute and 1-hour chart highs and lows
・Many signals make it easier to identify trading candidates
・Using recent highs and lows helps construct risk-reward
These are the points.
However, in strong trending conditions, reversals intended for range markets may be less effective.
Therefore, it is important not only to look at signals but also to determine whether the current market is range-bound or trending.
⚫︎Ichi|Targeting pullbacks and rallies on the 1-hour timeframe
Ichi is a signal that targets pullbacks and rallies based on the 1-hour chart.
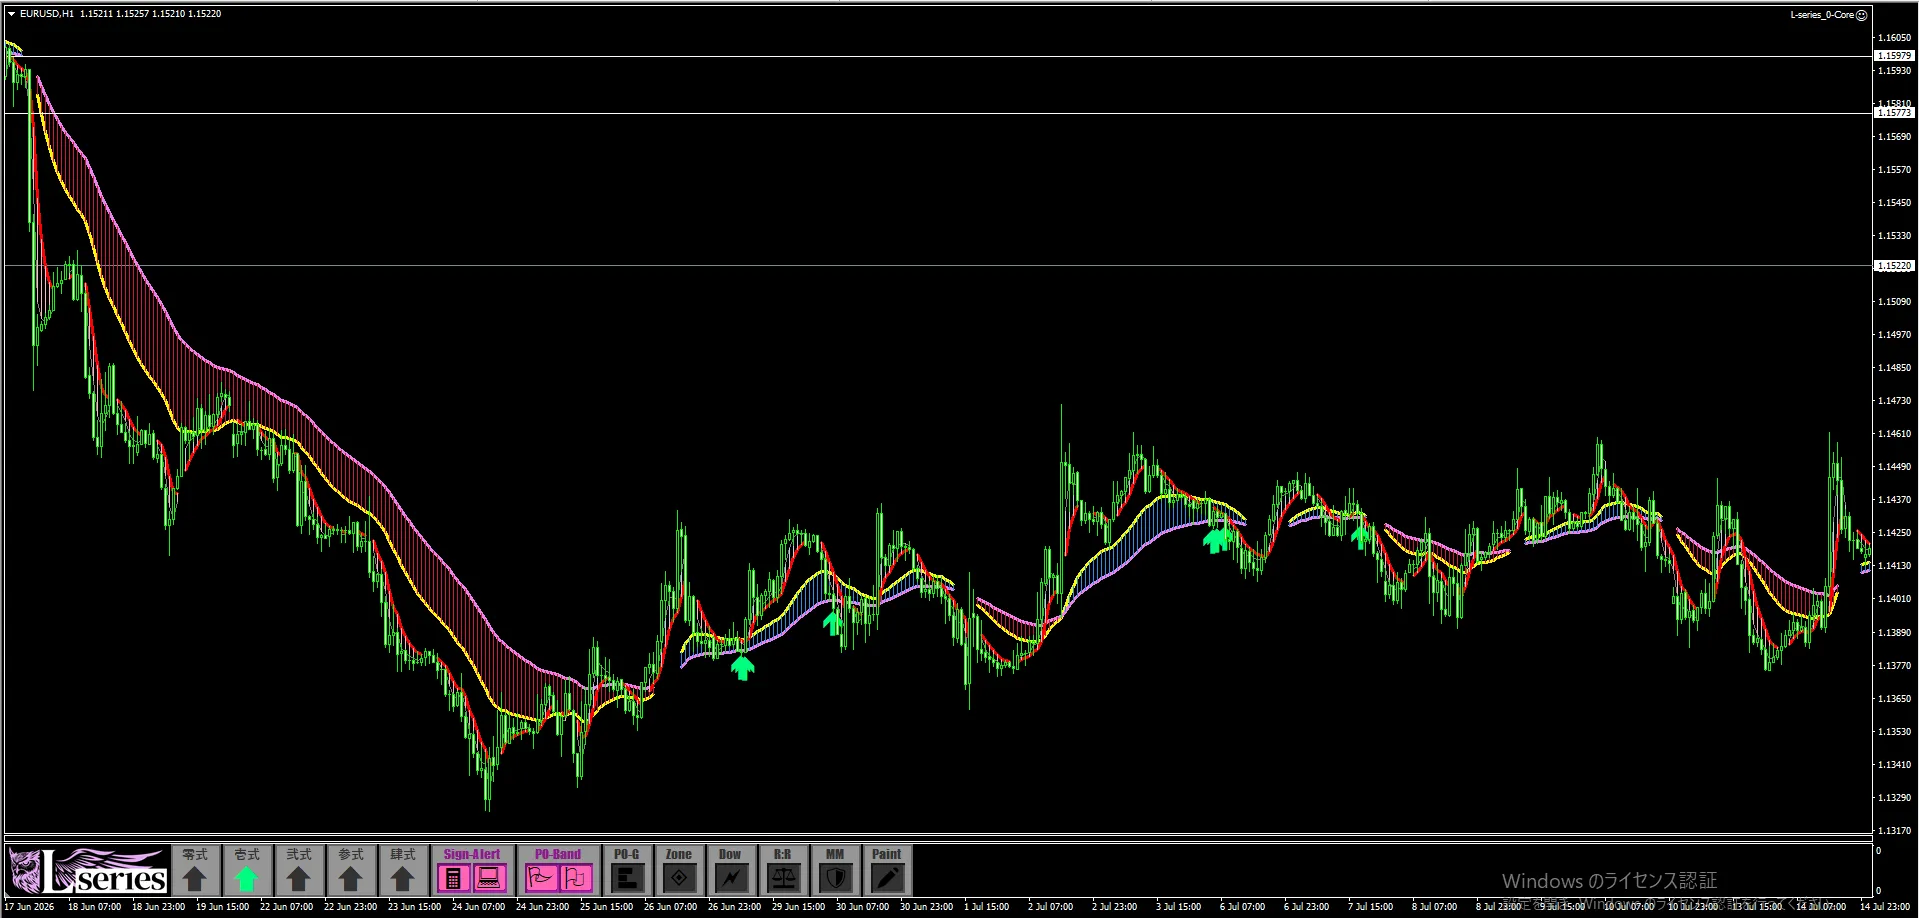
Annual signal occurrences are roughly around 100 times.
Rather than chasing short-term moves, it aims for moments when the price briefly retraces in line with the 1-hour trend.
Characteristics of Ichi include:
・Trade in line with the 1-hour trend
・Focus on pullbacks and rallies
・Around 100 signals per year
・Sometimes aims for larger price moves than Zero
・Risk is easier to set using recent highs and lows
These are the points.
It is particularly easy to use when the 1-hour timeframe has a clear direction.
⚫︎Ni|Targeting pullbacks and rallies on the 15-minute chart
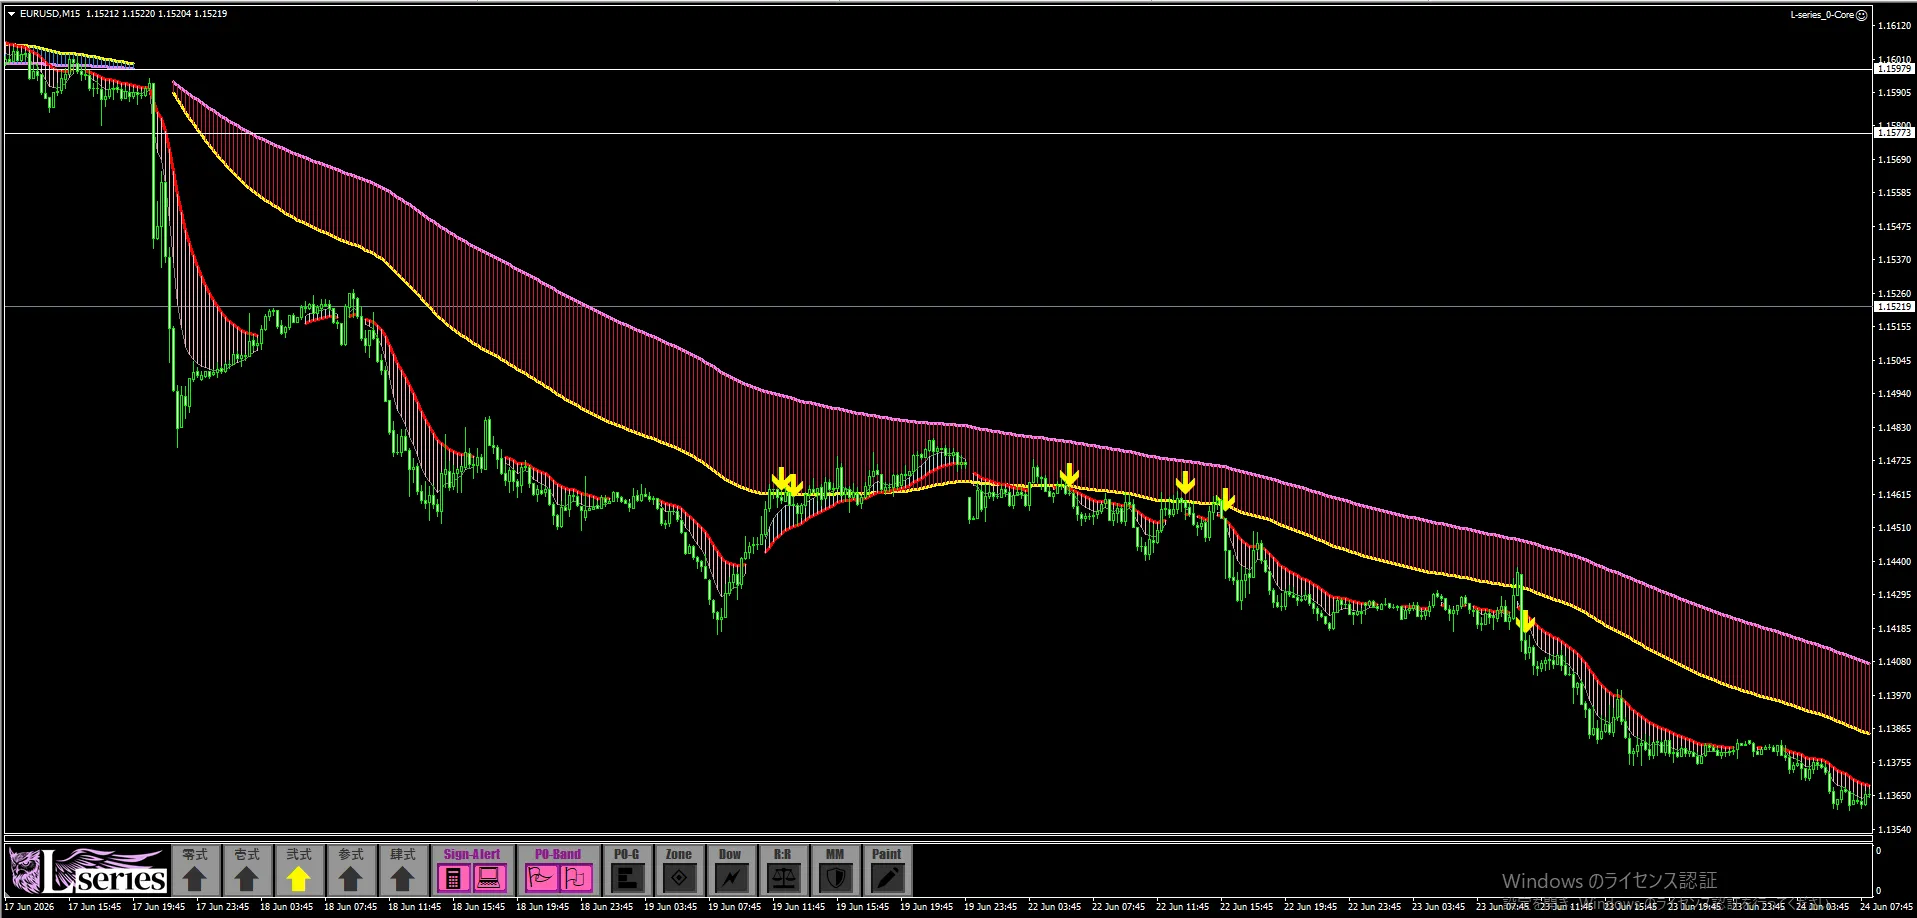
Ni targets pullbacks and rallies on the 15-minute chart.
Annual signal occurrences are roughly around 100 times.
The main difference from Ichi is the timeframe targeted.
While Ichi focuses on the 1-hour trend, Ni targets finer 15-minute price movements.
Ni features:
・Target pullbacks and rallies on the 15-minute chart
・Around 100 signals per year
・Can search for trading candidates on a shorter timeframe than Ichi
・Useful for short-term trend-following
・Risk-reward can be built using recent highs and lows
These are the points.
Because the lower timeframes carry more market noise,
it is important to confirm alignment with the higher timeframe direction when using Ni.
⚫︎San|Targeting four-hour timeframe turning points
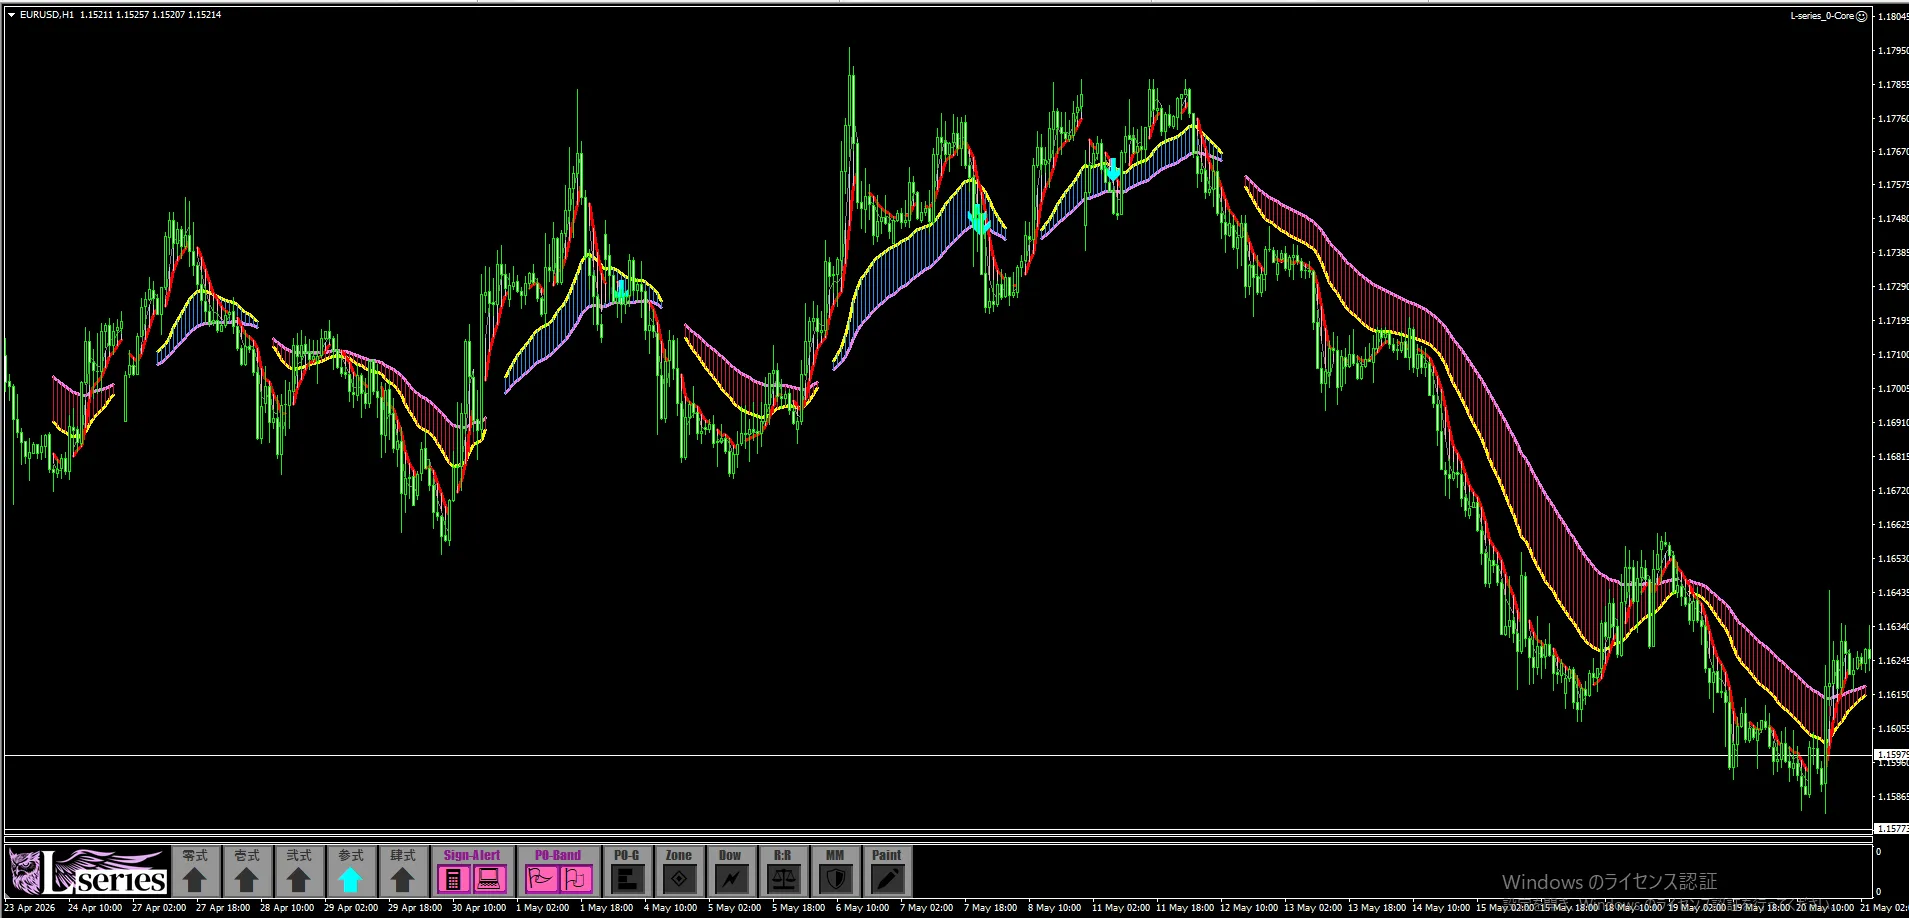
San is a signal aimed at four-hour turning points.
Annual signal occurrences are around 10 to 30 times, fewer than Zero/Ichi/Ni.
In return, targeting four-hour turning points can lead to larger price moves depending on market conditions.
San's features are:
・Target turning points on the four-hour chart
・Around 10 to 30 times per year
・Narrowing signals to aim for big moves
・There are cases where larger profit potential exists with wide stops
・Recent highs and lows used for take profit and stop criteria
These are the points.
Because occurrences are low, it is not a signal for daily trading.
You need to wait for the right conditions.
⚫︎Shi|Targeting major highs and lowsShi|Targeting major highs and lows
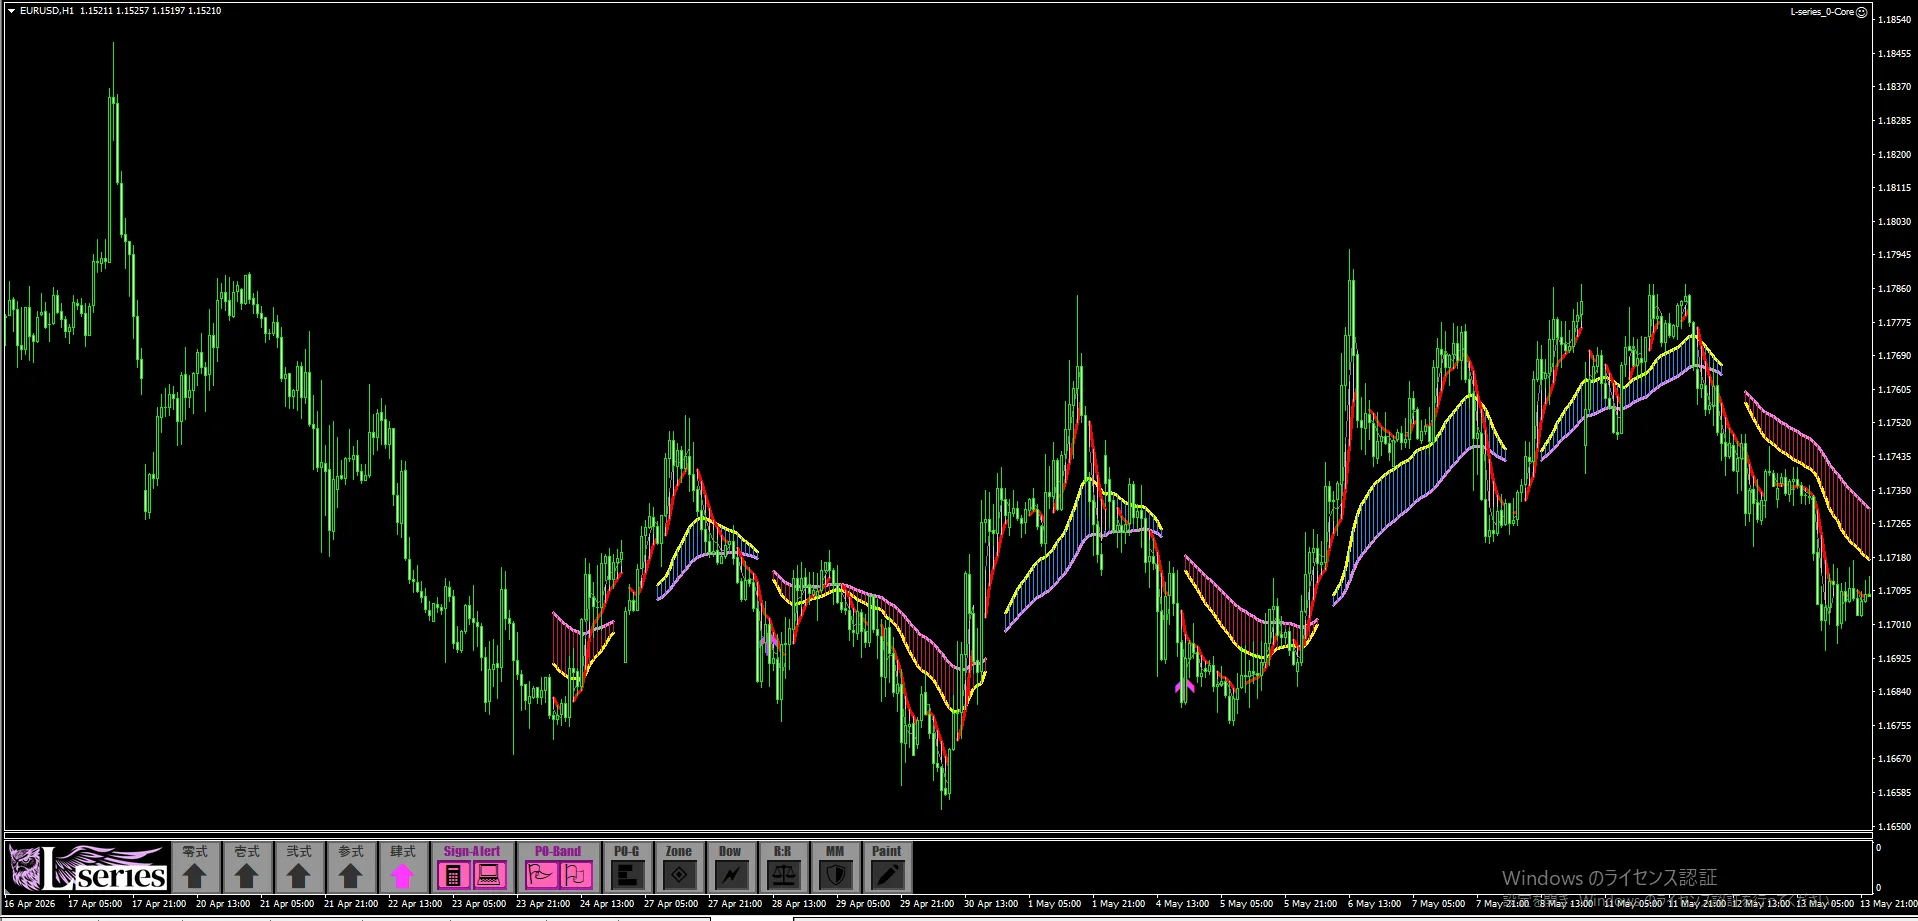
Shi targets market highs and lows that could become significant turning points.
Annual signal occurrences are about 5 to 20 times, among the lowest of the five signals.
Shi’s features are,
・Target big highs and lows
・Around 5 to 20 times per year
・Not a frequently appearing signal
・Can lead to large price moves after turning
・Use recent highs and lows to set loss and profit ranges
These are the points.
It is not possible to hit every top or bottom exactly.
Shi likewise does not guarantee a market turn simply because a signal appears; it is just a tool to identify turning candidates.
Common take profit and stop loss approach across all signals
In L-signal, take profit and stop loss are basically based on recent highs and lows.
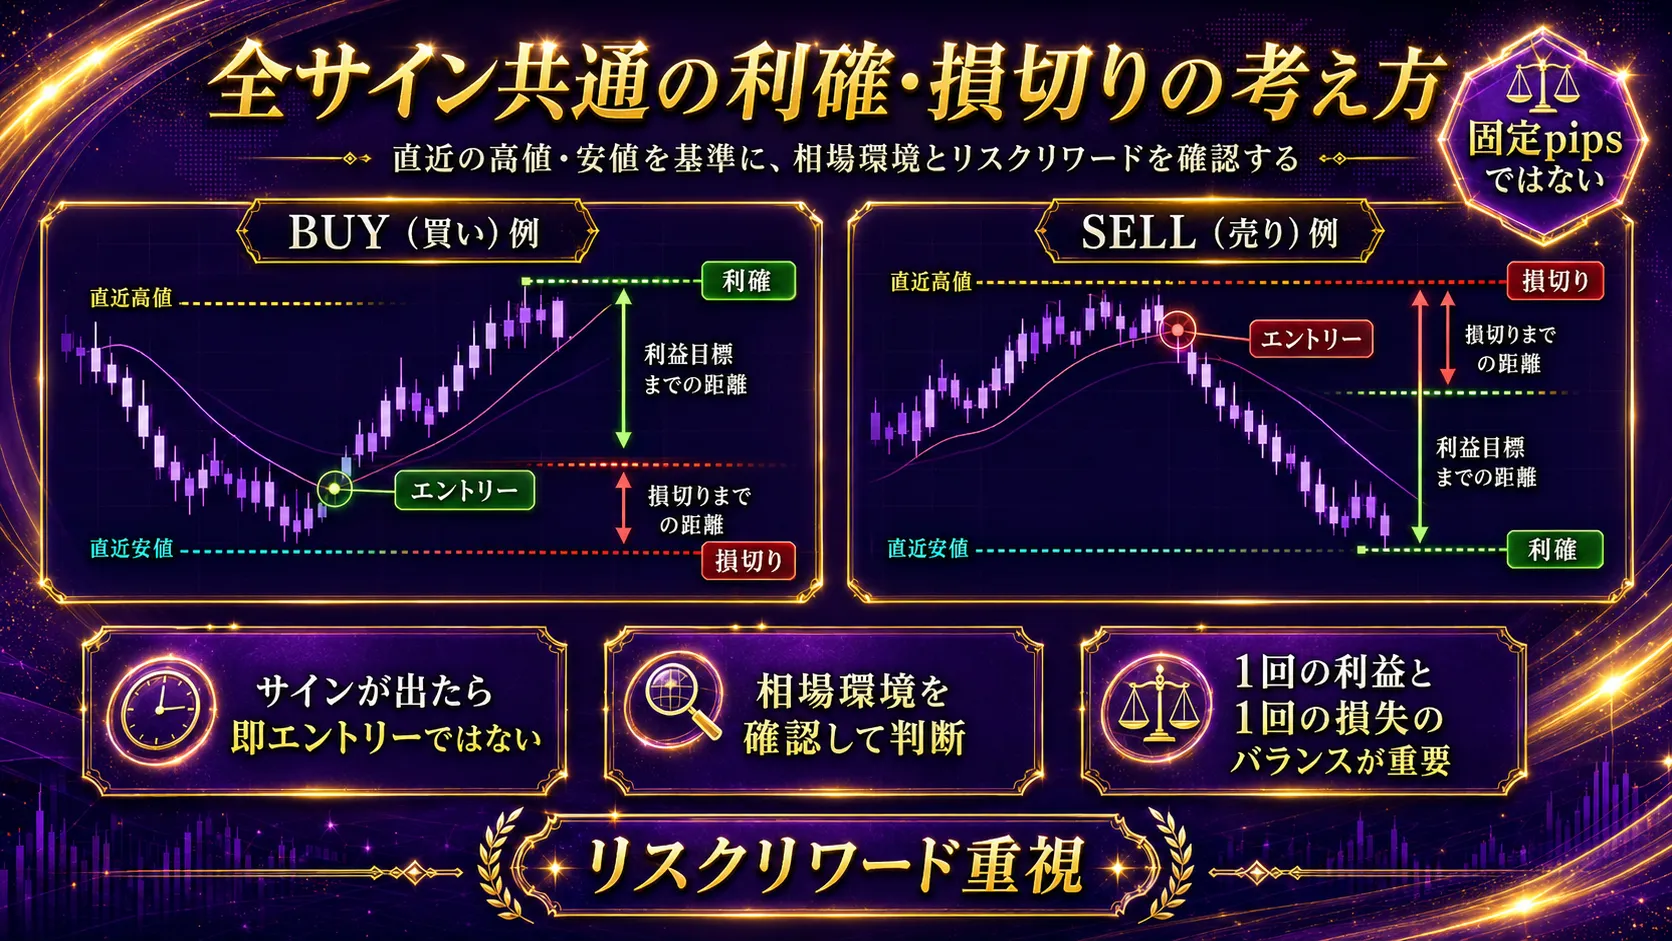
Rather than mechanically stopping out by a fixed pip amount, it uses consciously observed highs and lows on the chart as the basis.
Therefore, the stop loss width and profit target vary per trade.
The important thing is to
「do not trade just because a signal appears」
, but
「confirm the current market environment and the distance to stop loss and to take profit before trading」
.
You need to consider not only win rate but also the balance of profit per trade and loss per trade.
Three tools for market environment recognition to judge signals
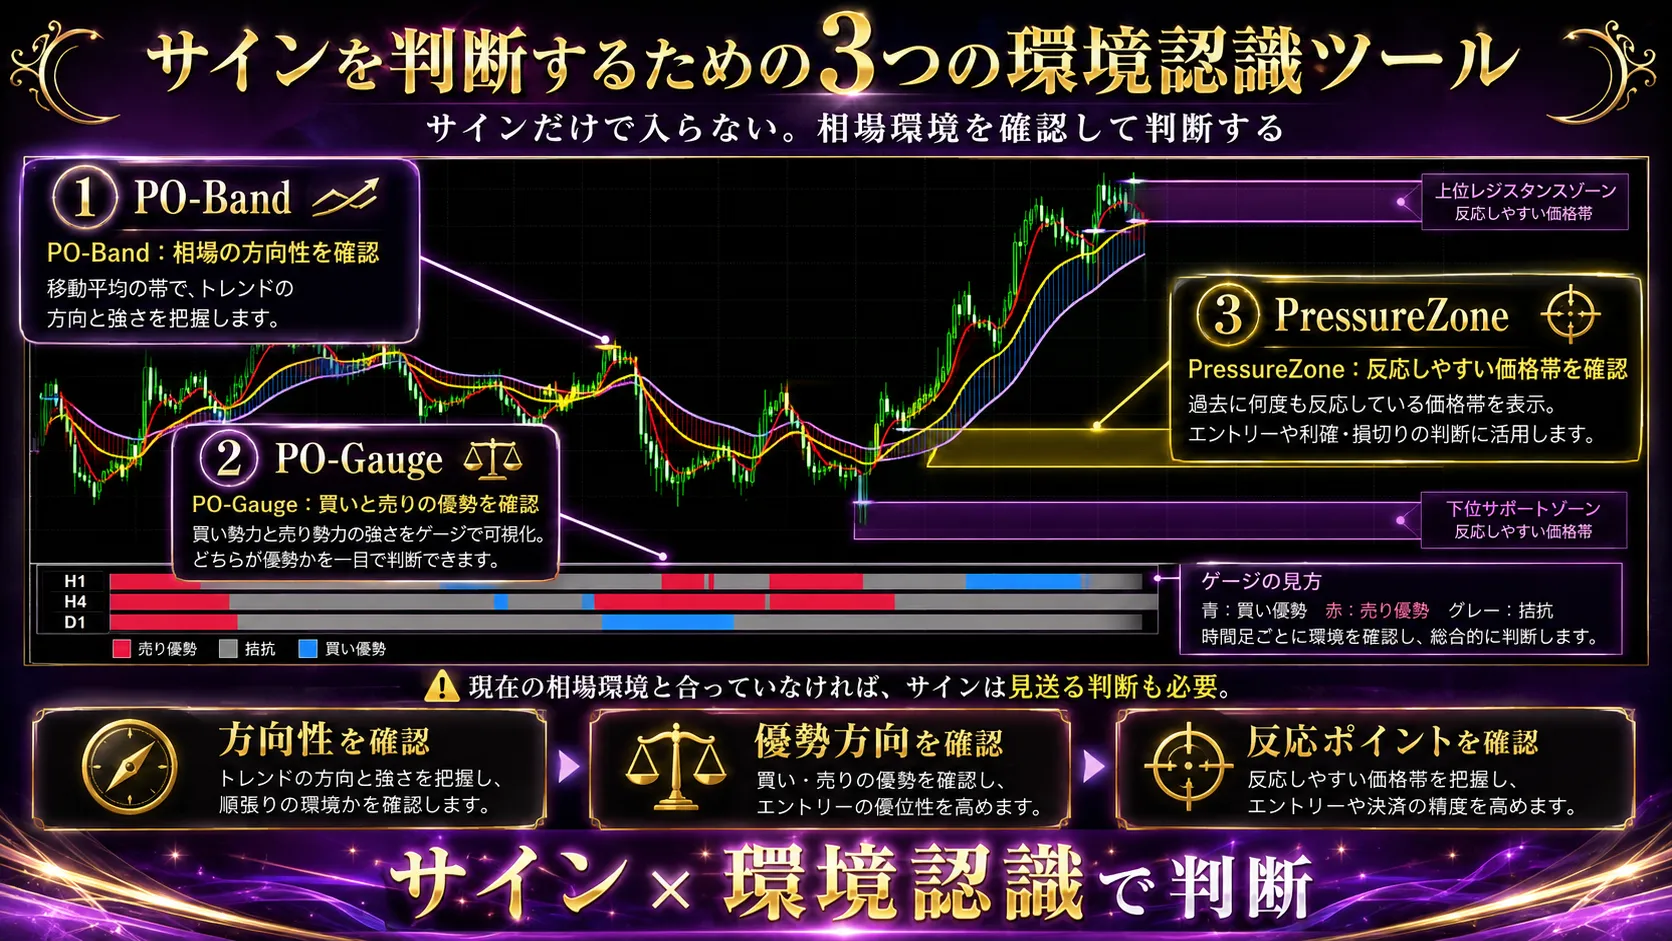
In addition to the five signals, L-signal includes three tools to confirm market environment.
・PO-Band
・PO-Gauge
・PressureZone
Three environment recognition tools are used to check:
・Whether the current market has direction
・Which is stronger, buyers or sellers
・Where price tends to react
These are used for that information.
L-signal is not a tool that fully automates decision making.
It combines signals with environment recognition to assist you in deciding trades yourself.
However, if a signal appears,
it is also acceptable to just assess using the most recent highs and lows and evaluate risk-reward
Notifications to smartphone and PC are supported
![]()
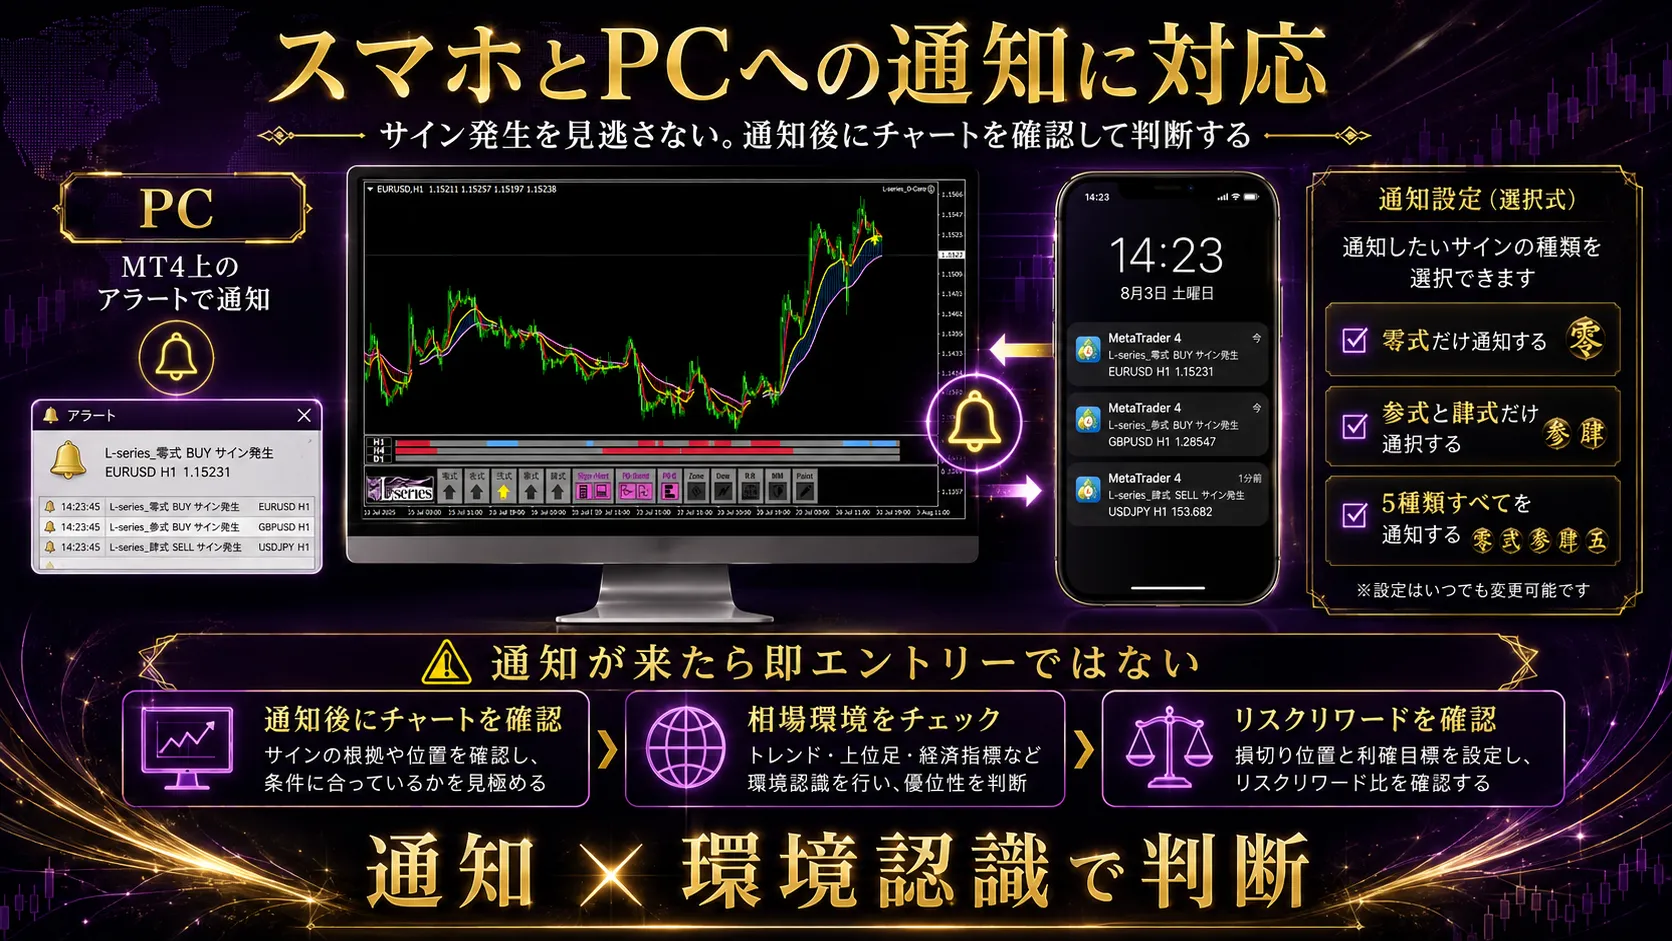
L-signal supports notifications when a signal occurs.
On mobile, you can use push notifications from the mobile MT4; on PC, you can use alerts on MT4 to recognize the signal.
You can choose which signals to be notified about,
・Notify only Zero
・Notify only San and Shi
・Notify all five signals
This setting helps those who cannot constantly monitor charts to confirm when trading candidates arise.
However, just because a notification arrives does not mean you must trade immediately.
After notification, check the chart, assess the market environment and risk-reward, and then decide.
Lightweight design to reduce MT4 load
Displaying multiple indicators and signal tools simultaneously can slow MT4.
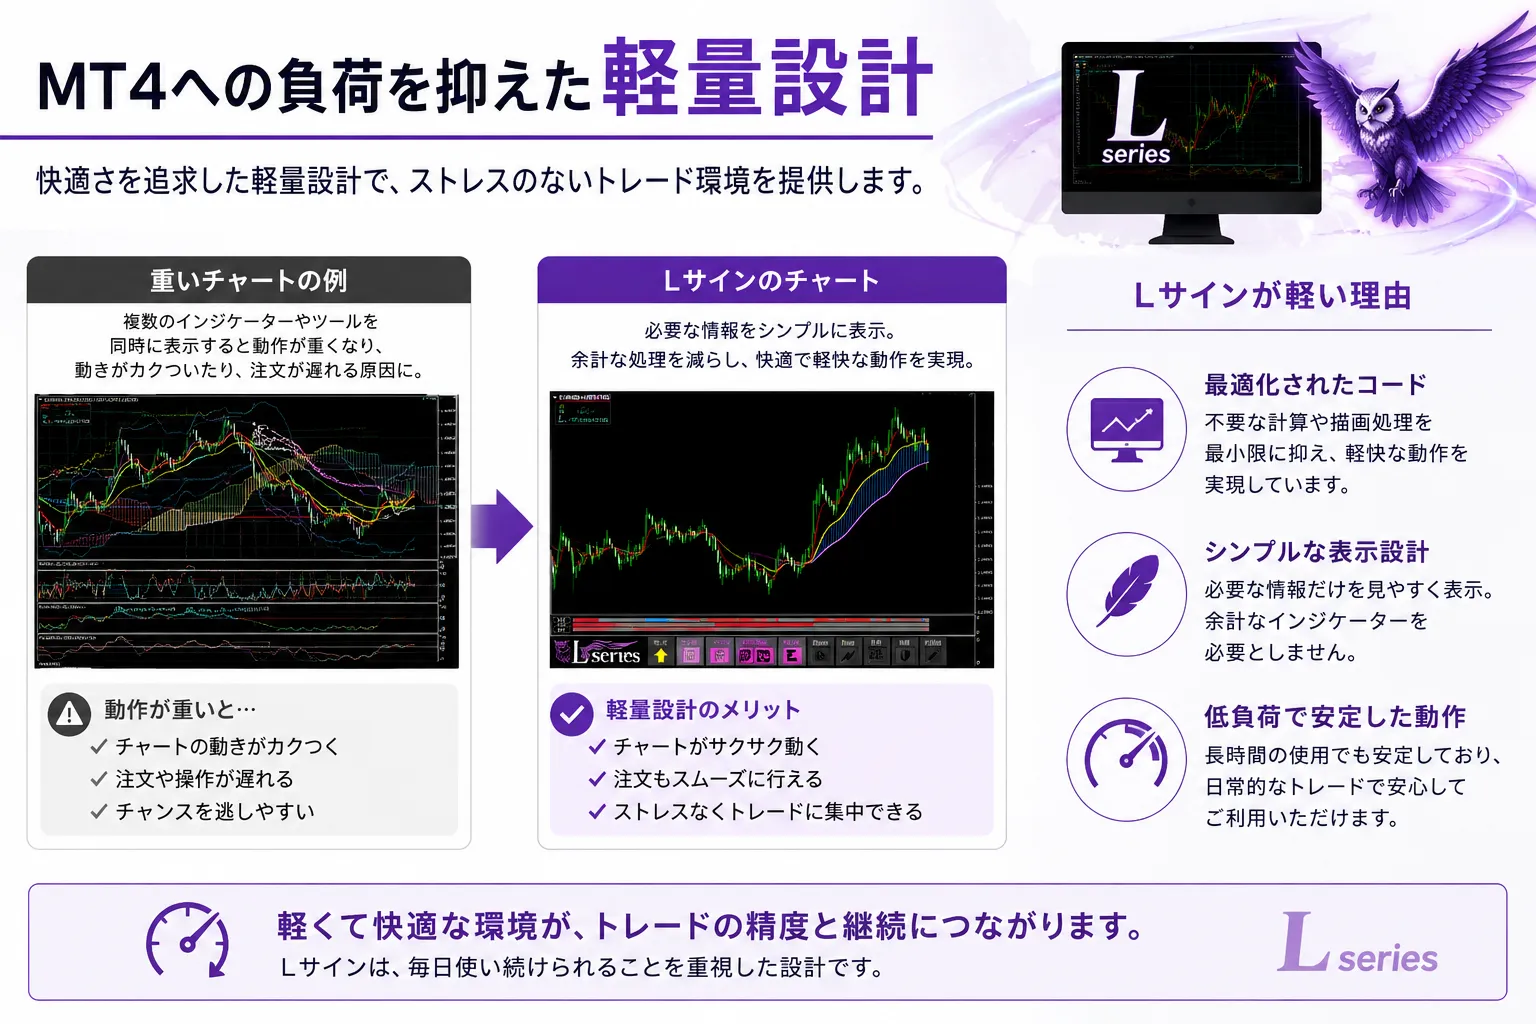
L-signal emphasizes lightweight operation so it can be used daily.
Beyond signal precision and features, being able to display on the chart and continue using it is an important factor.
Past verification results from 2018 to 2025
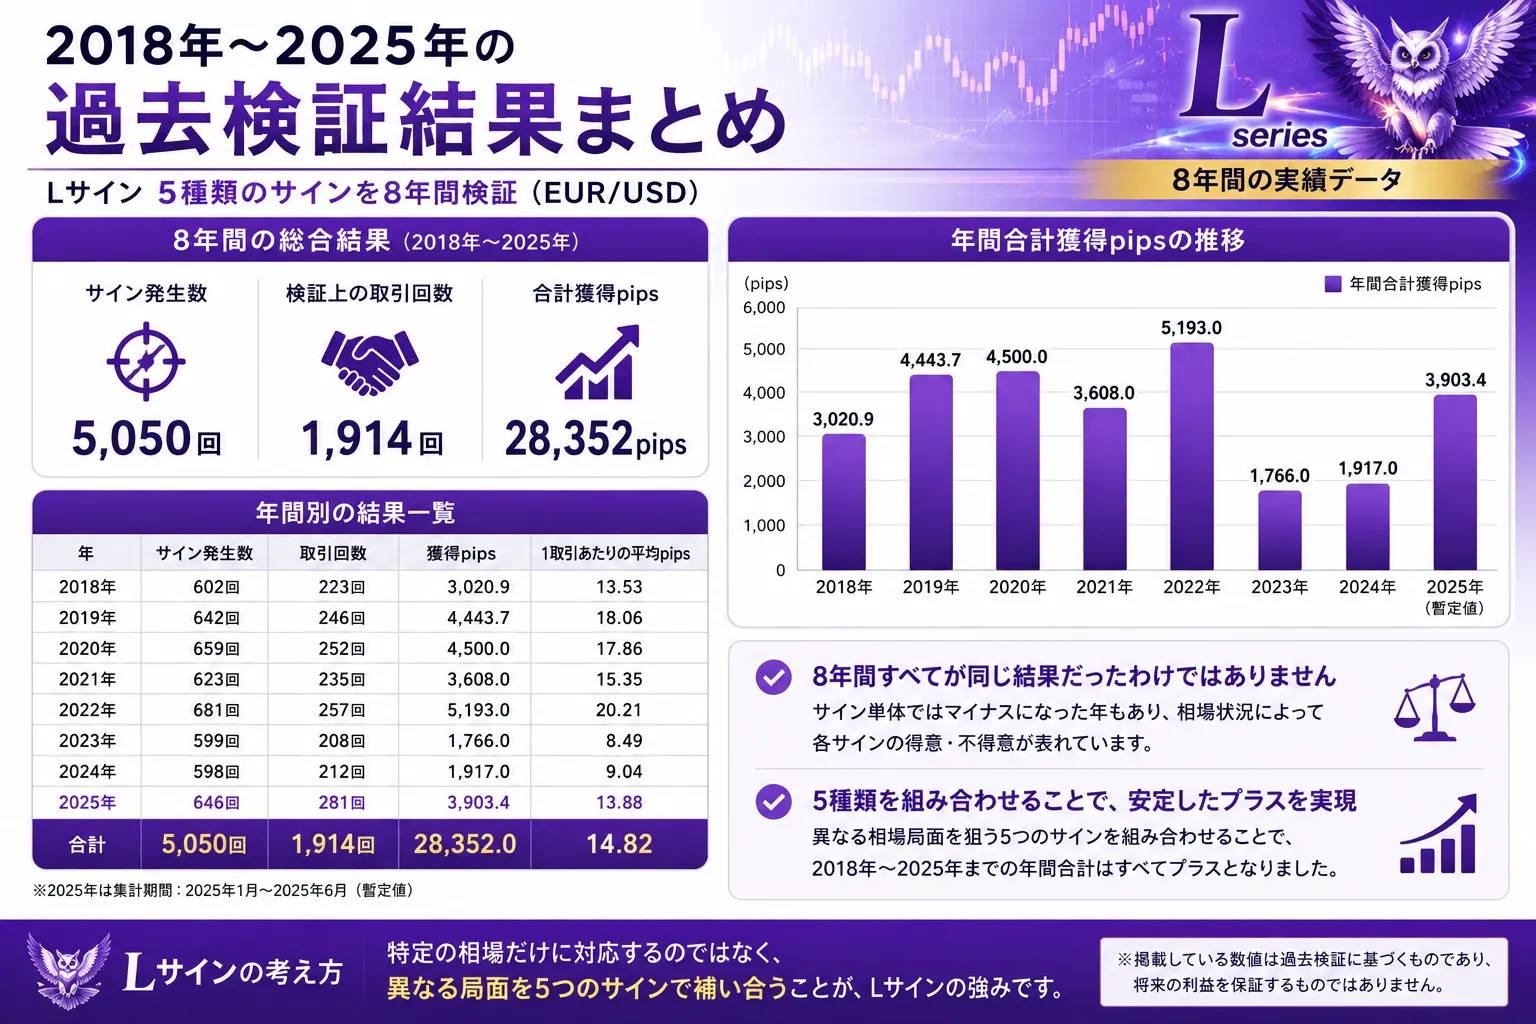
L-signal has been tested for eight years from 2018 to 2025 with five signal types.
【Image③:Summary of eight years of historical verification】
Eight-year total results are as follows.
・Total signals: 5,050 times
・Verified trades: 1,914 times
・Total gained pips: 28,352 pips
Annual total gained pips were as follows.
2018:3,020.9 pips
2019:4,443.7 pips
2020:4,500 pips
2021:3,608 pips
2022:5,193 pips
2023:1,766 pips
2024:1,917 pips
2025:3,903.4 pips
Eight years do not all yield the same result.
For some signals, a negative result occurred in certain years, showing strengths and weaknesses depending on market conditions.
On the other hand, the annual total for all five signals remained positive from 2018 to 2025.
This data confirms L-signal's approach of complementing different market regimes with five signals rather than focusing on a single regime.
Verification results when starting with 100,000 yen per year
Starting each year with 100,000 yen and evaluating on a trade-by-trade basis yielded the following results.
2018:100,000円 →502,780円
2019:100,000円 →955,473円
2020:100,000円 →3,507,264円
2021:100,000円 →688,000円
2022:100,000円 →427,300円
2023:100,000円 →370,960円
2024:100,000円 →1,732,825円
2025:100,000円 →502,780円
According to verification, in all eight years the initial 100,000 yen starting amount exceeded.
However, this is a simulation applying past market data under fixed rules.
In actual trading, results can vary due to spreads, fill prices, trading environments, and timing.
If starting with 100,000 yen and compounding for eight years
Starting with 100,000 yen in 2018 and compounding with a 1% risk per trade, the final amount became 34,275,453 yen. Reaching over 34 million from 100k is a very large figure.
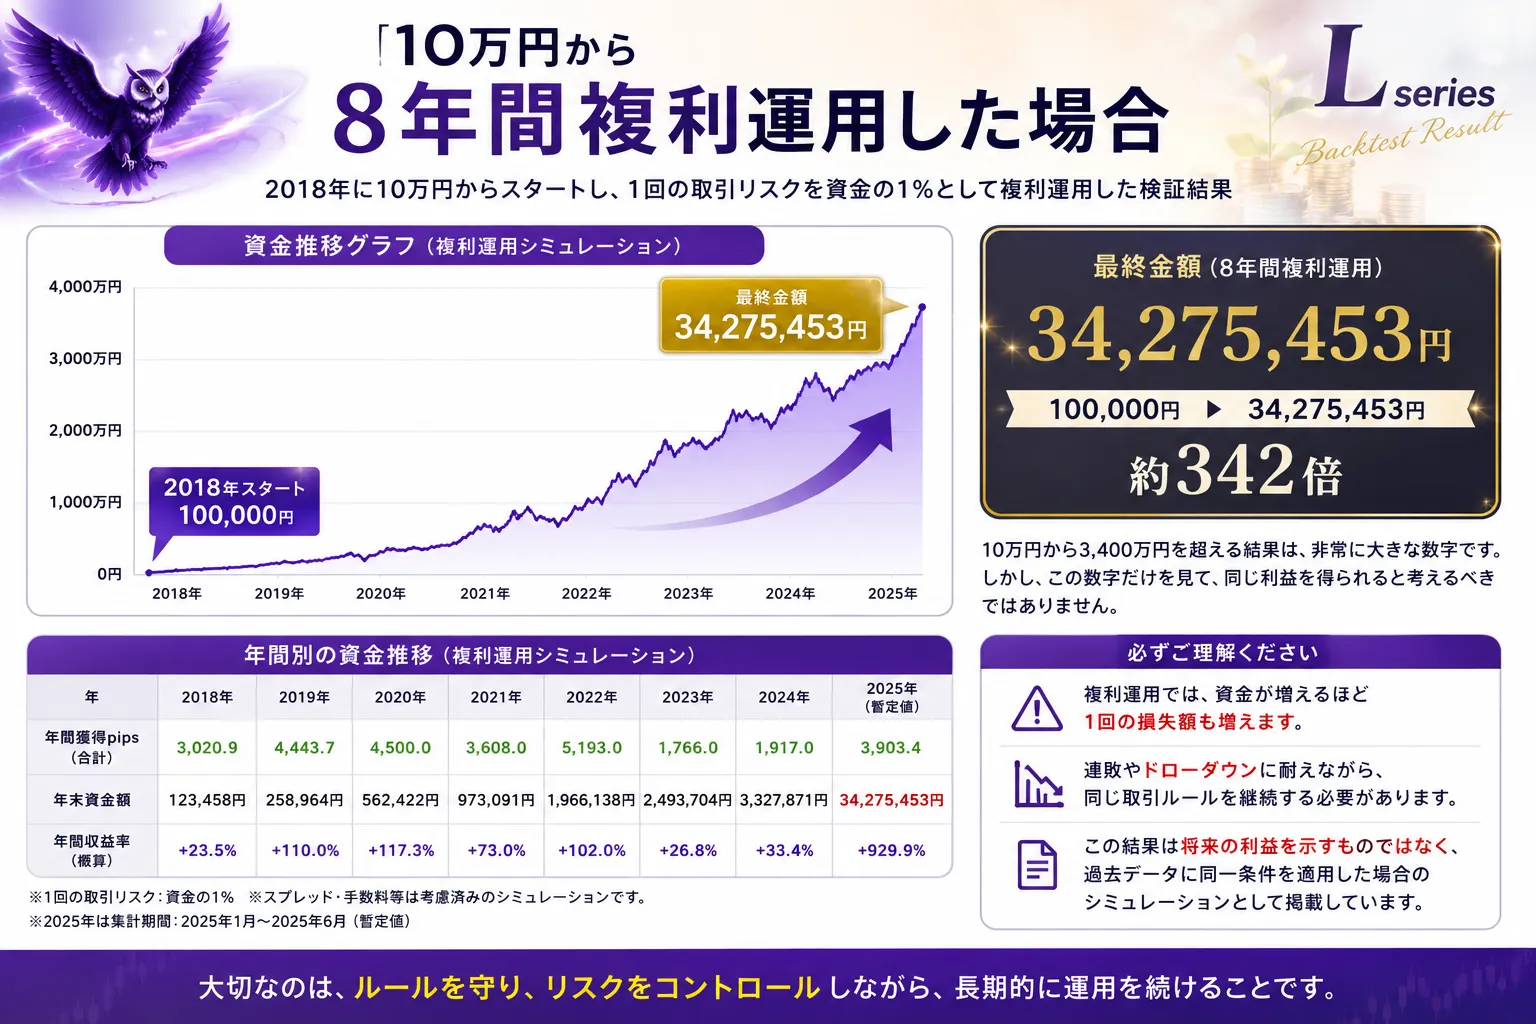
However, this number alone should not lead one to expect the same profit.
With compounding, the amount lost per trade increases as capital grows.
You must continue the same trading rules while enduring losing streaks and drawdowns.
This result is not a guarantee of future profits; it is a simulation applying the same conditions to past data.
L-signal is not an automated trading tool
L-signal is not an automated trading tool
L-signal is not an Expert Advisor that trades automatically.
It displays trading candidate signals on the chart, and the user decides to trade based on those signals.
Therefore,
・Current market environment
・Direction of higher timeframes
・Take profit and stop loss positions
・One-trade risk
・Presence or absence of major economic indicators
need to be checked.
It is also important not to trade every appearance of a signal; skip if conditions are unfavorable.
Details of L-signal here
Details of L-signal here
This article introduced the basic mechanism of L-signal, the five signal types, and past verification results.
On the sales page, you will find:
・Charts showing where each signal actually appeared
・Three environment recognition tools
・Notification features
・How to use
・Explainer videos you can receive after purchase
・Customer reviews
・Usage environment and frequently asked questions
For more details about L-signal, please visit the page below.
▶︎【Check the L-signal detail page】
※L-signal does not guarantee profit. The posted results are based on past data and simulations, and do not guarantee future profits. FX may incur losses exceeding the principal. Please make your final investment decisions at your own responsibility.