
What happened yesterday after the Japan-US intervention
Newest in 2026!!
You can watch the interview VTR with Gogojan President Hayakawa and me here
There are also free gifts.
Good morning everyone.
This weekend there is the US employment report, but I have a hunch I can trade and make money even without waiting for it.
USD/JPY MT4 daily chart (watch the number) · 1-hour chart · 5-minute chart · Nikkei
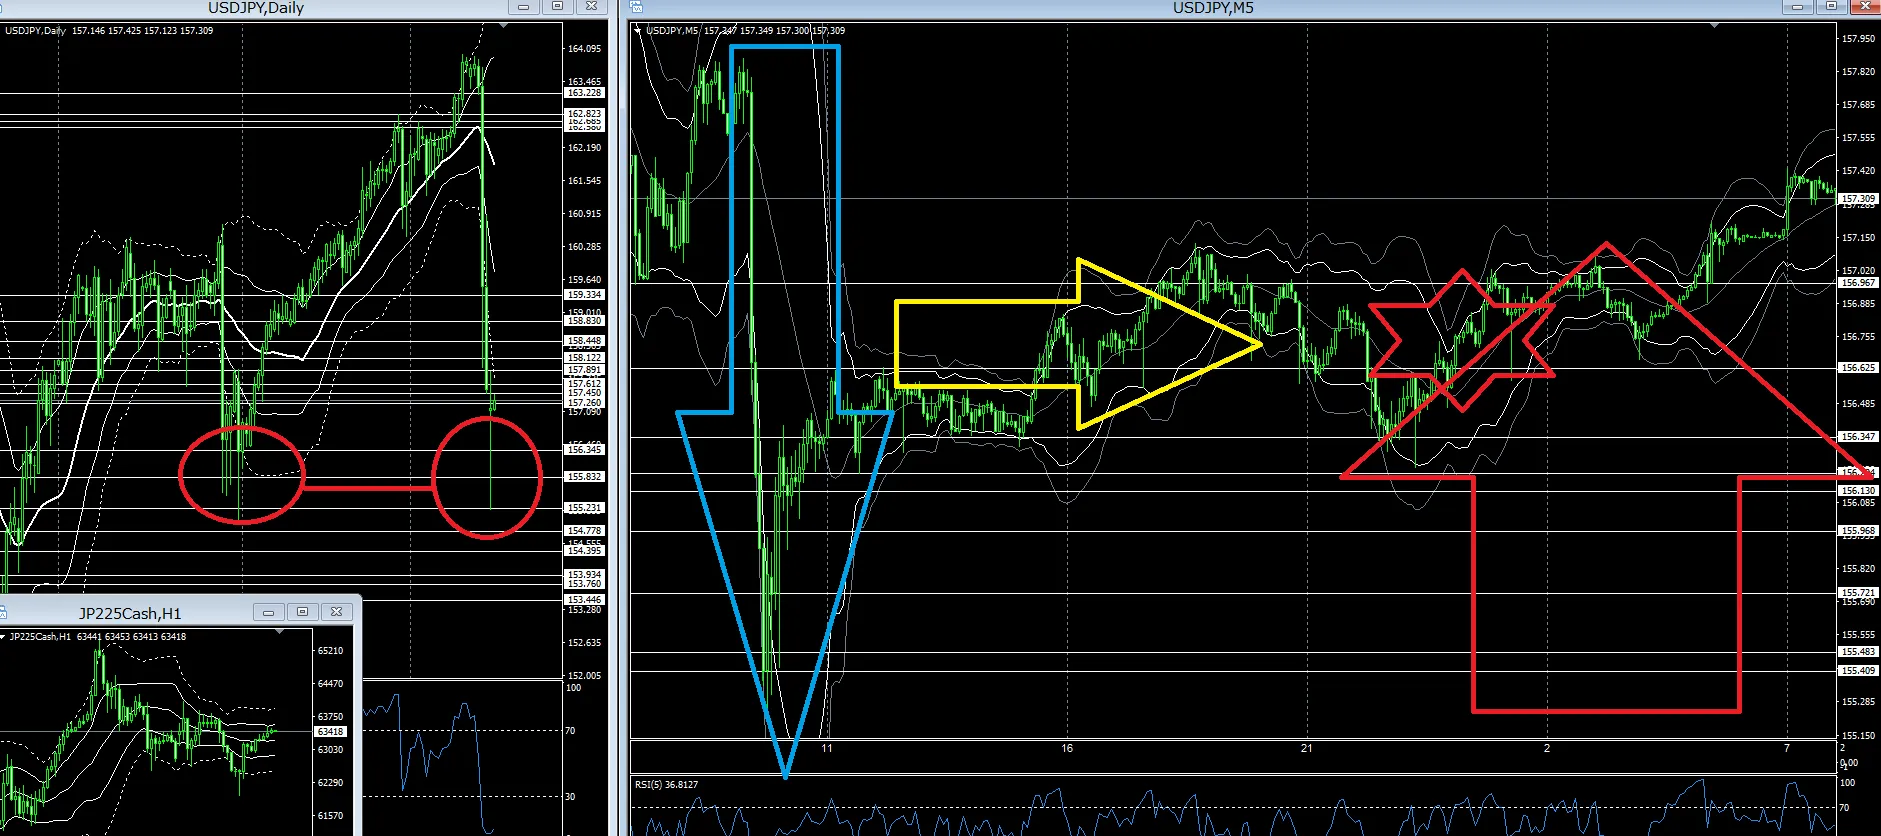
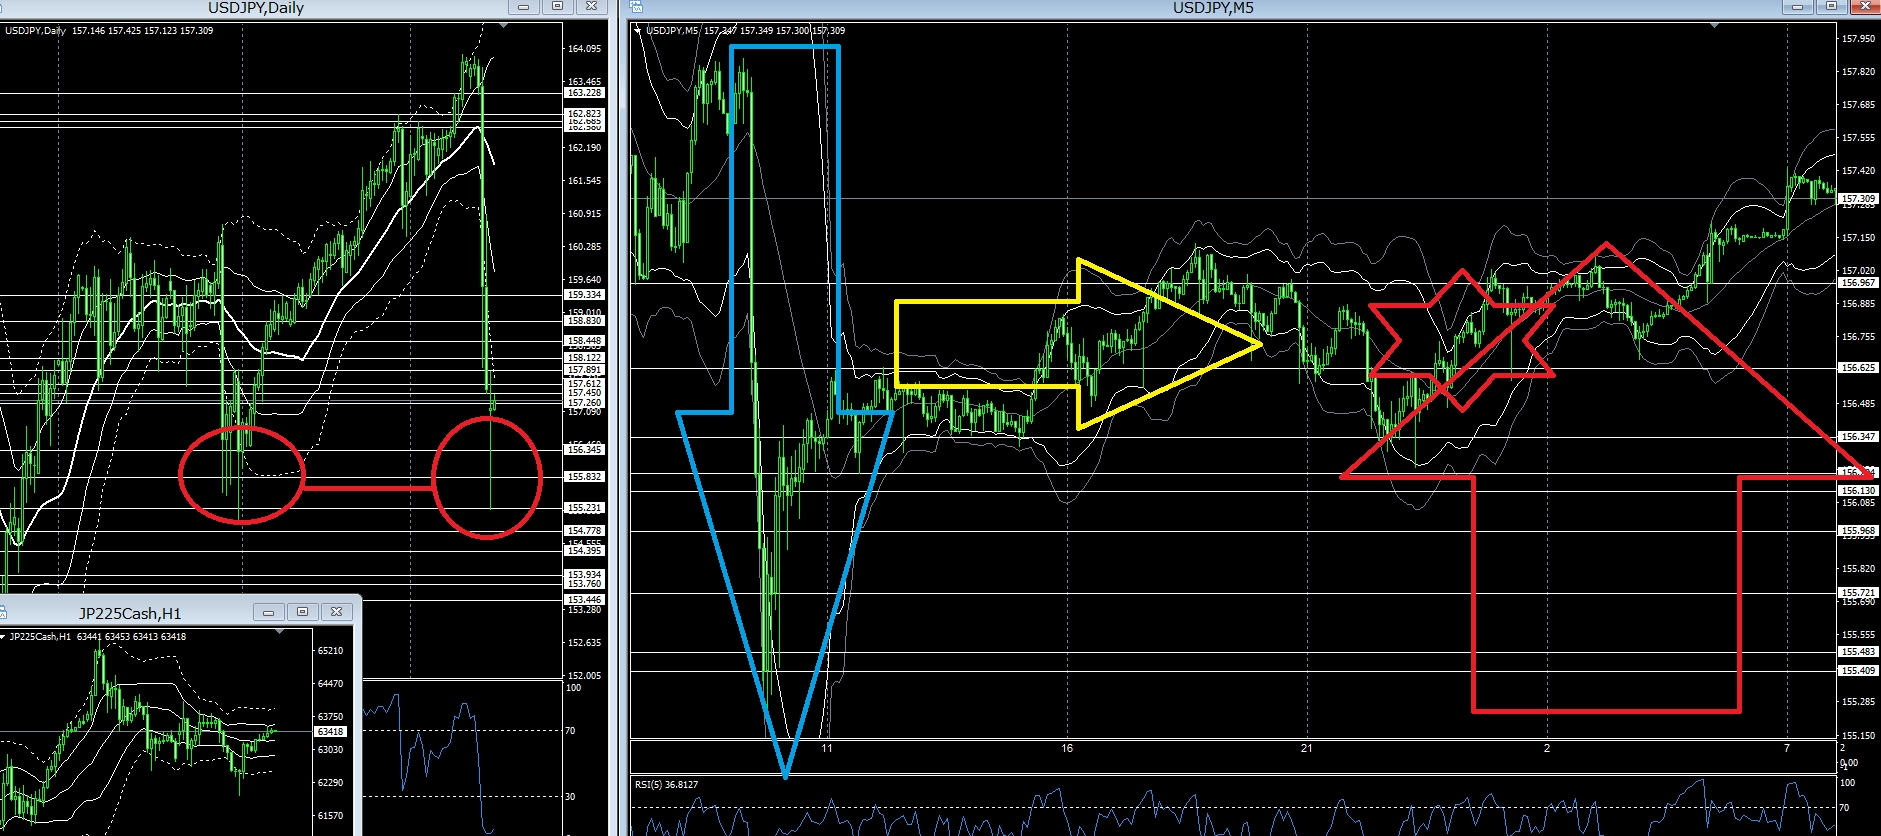
Yesterday's USD/JPY fell in the morning, then rebounded and rose.
The red circle on the daily chart was the point, but today there is a possibility of falling again to the lower wick, so don't chase the sharp drop and miss the inside move.
The white horizontal line on the chart is the billionaire Trader line from about three months ago.
Looking at the 5-minute billionaire Trader line, there are points that reliably rebound.
This indicates prices that were previously watched.
If it was a sell, you can attack with a buy; if it was a buy, you can attack with a sell—an impression like that.
In a broader sense, it falls in the morning in Tokyo and then ranges.
From the start of NY, signs of rising appeared and the chart rose about 70 pips over about 3.5 hours on the 5-minute chart.
As I wrote yesterday, if you take a 1-minute billionaire Trader chart and use the billionaire Trader line to flip from selling to buying (or vice versa) and take a long position, you could ride a relatively large volume.
This is retrospective talk, but it shows that past chart analysis enables real-time practice based on retrospective theory.
I’ve written about these discussions in Invest Navi a while back, so readers will understand.
In the end
Trend → Range → Trend
This flow remains the same whether there is volatility or not.
Movements with rest periods, then move again—it's like that.
Now today, it rebounded and rose about 2 yen from yesterday.
According to the billion-trader daily chart, there is a price range of about 2 yen above and below the current price.
Both upward and downward are deep.
There is a possibility of a range, and there might be a decline aiming for yesterday's low wick.
Billion Trader users should focus on the switching of the 1-minute chart and trade flexibly, taking positions with a reasonable price range and switching as needed.
Side note: yesterday's GMO Click Securities FX OP had a low-magnification, favorable setting at both ends of the price.
Conversely, the high-magnification setting to chase volatility was expensive, but after about 1.5 hours from the start the price was in the 200-yen range, so high-magnification trades were possible.
In such volatility, settings aren’t great, but moves happen, so even if a bit pricier, high-magnification trades can lead to a big payoff.
For those who used to sell my "Reverse Pattern" program, aren’t you earning quite a bit from this volatility?
Remember what you do daily
The important thing is to read repeatedly and take notes
Human memory cannot be trusted, so keep a record.
I'm in my 50s, so I forget things I just thought of...
Nowadays I quickly jot notes in my smartphone app, or I forget.
If you create a routine to review later and can access it quickly, it can be very helpful for trading.
Thank you for your continued support today.
For traders who most want to succeed in trading and earn a living from it, the following technique is recommended, and you can learn it on your own: this trading technique is↓