
NK225 Futures MTF Dow Theory: 4 Scenario Analysis Report 2026-08-04
NK225 Futures MTF Dow Theory Analysis Report
Date and Time: August 4, 2026, 06:02 JST / Night Session Close
Current Price: 63,470 JPY
Instrument: Intraday Session (August 4, Tuesday)
Conclusion
In summary, during August 3 intraday the price retraced to 64,180 and then fell, rallied at night to 62,110, and then sharply surged to 63,470 at close. The 4-hour chart shows a downtrend and a downward wave with a reversal price of 64,180; the 1-hour and 15-minute charts show a downward trend whose waves have started to turn up. From the bounce starting at 62,110, as the 4H reversal price approaches, the key question for Tuesday is whether the price can break above 63,960–64,180; this is viewed as the main branching point.
If the 15m close clears 63,960, it suggests a follow-on long; if a pullback occurs around 62,850–63,330 and then rebounds, that is a pullback buy. Resistance zones are 63,810–63,960 and 64,180–64,310; a stall there is a return sell in the larger trend. If 63,330 fails on a 15m close, the 15m up-move would fail and a decline would resume below 62,470 (1H reversal). Recovery above 64,180 on a close would end the 4H downtrend. Because the bounce is steep and the range is wide, entering solely on reaching a zone is not advised; wait for a decisive close and protect positions promptly.
4H Analysis
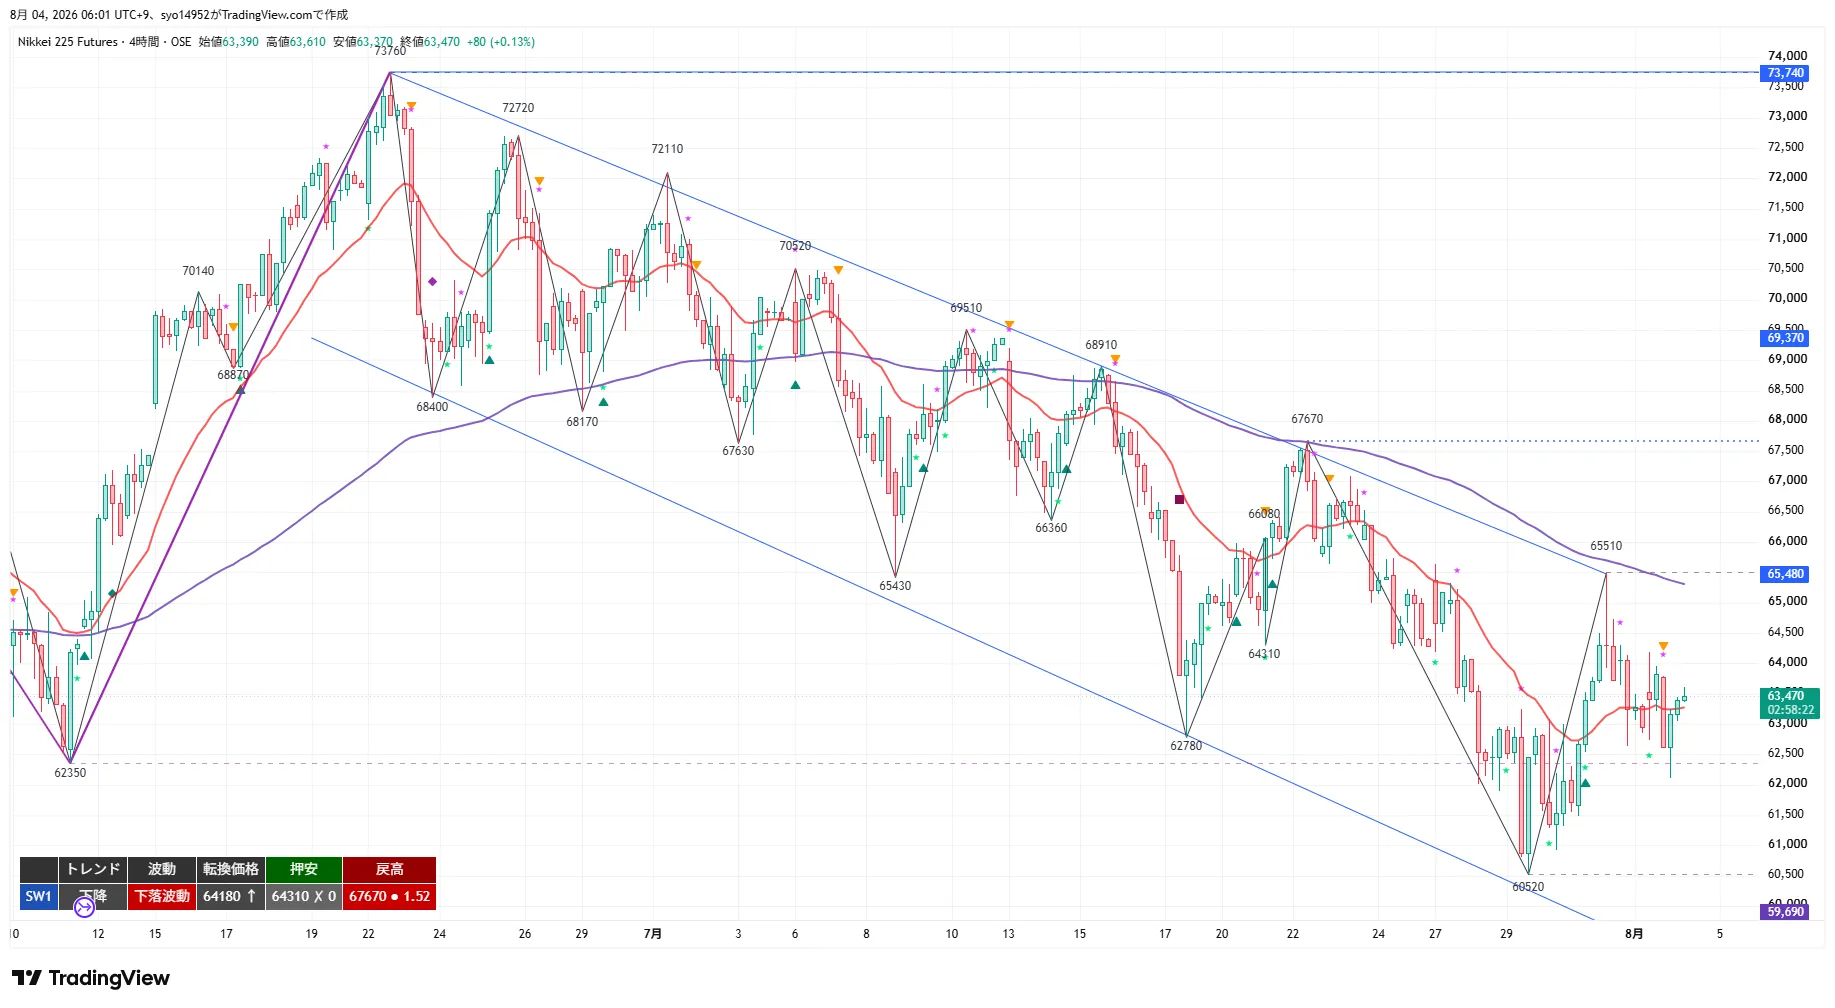
The 4H chart shows a continuing downtrend and a downward price wave. The pullback from 65,510 continues, and after dipping to 62,110, price rebounded to close at 63,470. The reversal price is 64,180 (same level as the 1H recovery high and the August 3 high). A close above this level would mark the end of the downwave. The 20EMA (around 63,300) is flat and price has moved back above it, but the 120EMA (around 65,480 on the daily equivalent) and the 200EMA are both above price, indicating strong upside resistance remains.
Key resistance levels: 63,960 (15m recover high), 64,180 (reversal price), 64,310 (previous pullback low that has become resistance), 64,730, 65,510. Support levels: 63,330 (15m reversal), 62,730, 62,470 (1H reversal), 62,110 (Night low), 60,920 (1H pullback low), 60,520 (structural low). As long as 62,110 holds, the near-term bounce can continue, but the 4H downtrend remains in effect until a close above 64,180.
1H Analysis
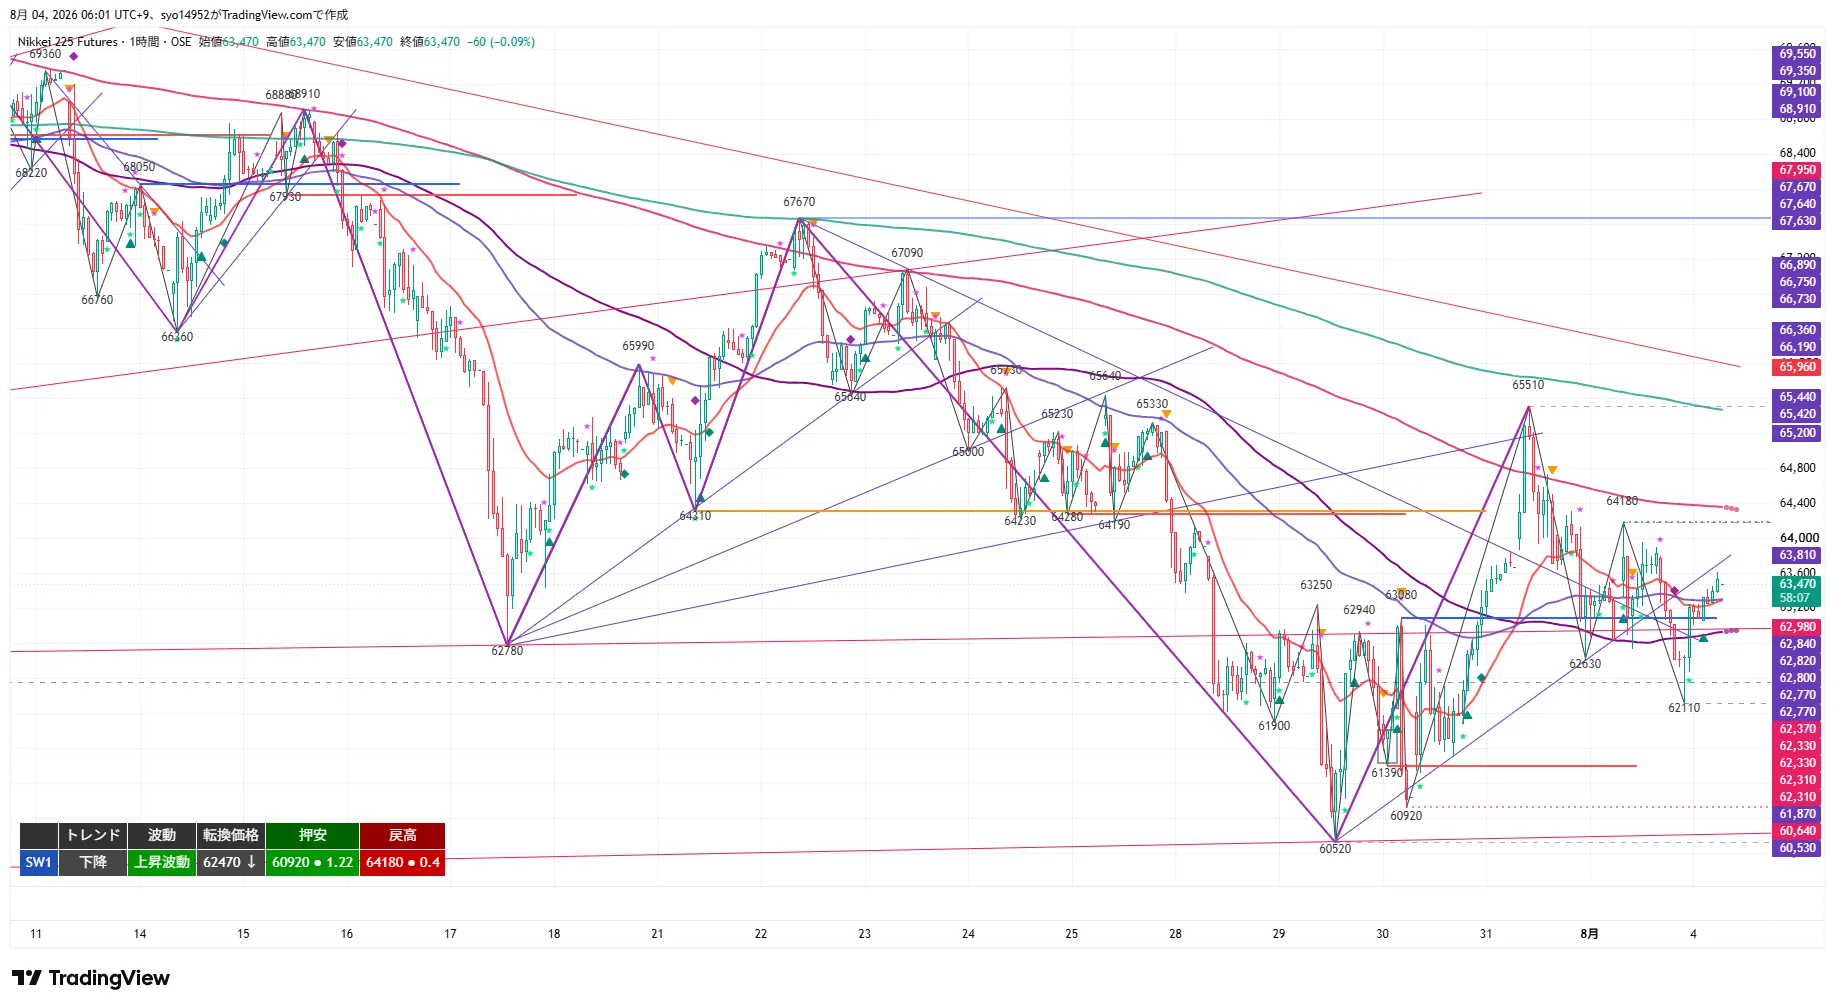
The 1H chart remains in a downtrend, but the wave has turned higher. After dropping from 64,180 to 62,110 and then rebounding to close at 63,470, the reversal price is 62,470. The 20EMA (around 63,200) is rising and price sits above it; the 80EMA (4H 20EMA equivalent) is near price, and the 480EMA (daily 20EMA equivalent) is well above, around 65,400.
As long as 62,470 holds as a 1H close, the upside wave remains intact, and a recovery toward 63,960 is likely. Conversely, a close below 62,470 would break the up-move and reinitiate a downtrend, with 62,110 and 60,920 providing incremental support. Upper targets are in the 63,810–63,960 and 64,180–64,310 zones for potential pullbacks.
15m Analysis
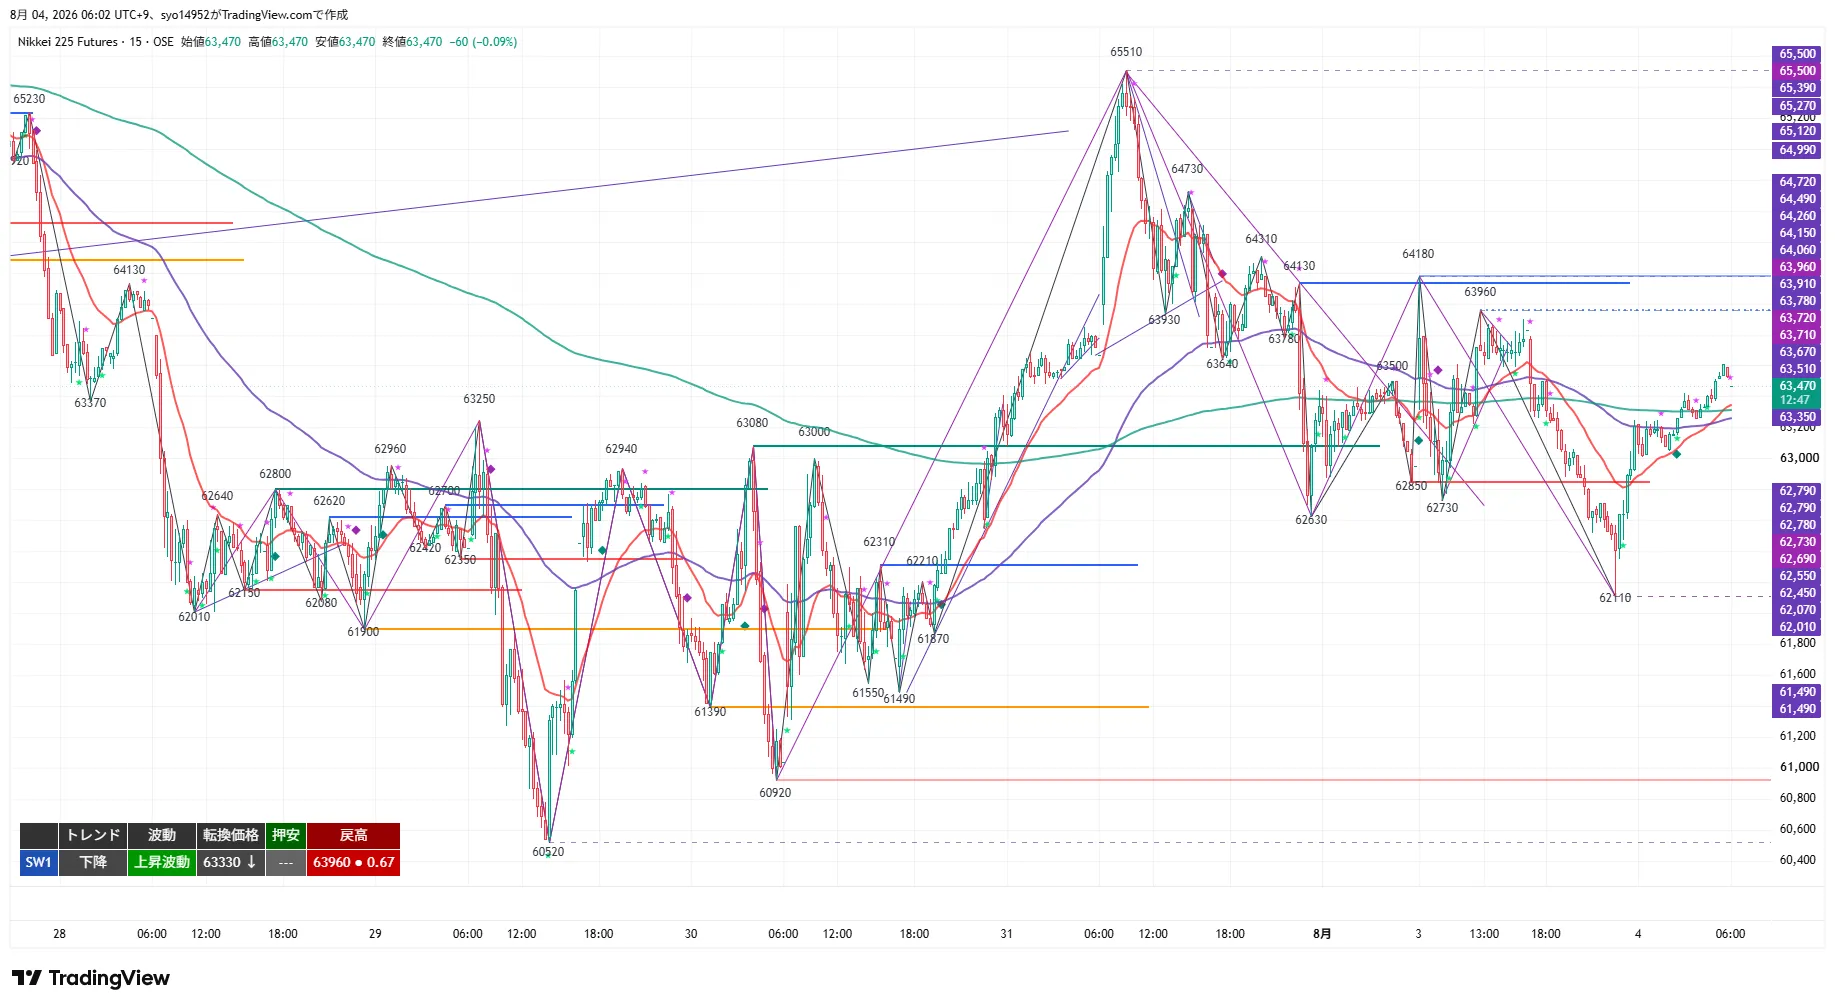
The 15m chart remains in a downtrend, with an upturn in the wave. The reversal price is 63,330; the pullback high is 63,960, and the pullback low is not yet formed due to the early stage of the upwave. From 64,180 to 62,850, then back to 63,960, and a sharp drop to 62,730 and 62,110 followed by a strong rebound to 63,470. The 20EMA (around 63,300) is positively sloped, and the price is above it; the 80EMA (1H 20EMA equivalent) and the 320EMA (4H 20EMA equivalent around 63,350) are also above the close, indicating renewed upward potential.
Near-term, 63,330 is the lifeline of the up-move; 63,960 is the breakout line of the recent high. A close above 63,960 confirms a higher high, signaling continuation; a pullback to 62,850–63,330 offers a pullback buying opportunity, with a break below 63,330 on a close suggesting the up-move is failing. Because the bounce angle is steep, both shallow pulls and deeper pulls down to 62,470 should be anticipated.
MTF State
- 4H: Down / downward wave. From 65,510, a continued decline to 62,110, then a rebound to close at 63,470. Reversal price is 64,180; a close above this would begin to terminate the down-move. 20EMA is flat with price above; 120EMA (daily 20EMA equivalent around 65,480) remains above.
- 1H: Down / up wave. From 64,180 to 62,110, then rebound to 63,470. Reversal price 62,470; pullback support 60,920; retrace high 64,180. 20EMA turning upward with price above.
- 15m: Down / up wave. Quick rebound from 62,110 to 63,470. Reversal 63,330; pullback low not yet formed; retrace high 63,960. 20EMA positive slope with price above; 320EMA above as well, and both above close.
- Consistency: All of 4H, 1H, and 15m remain in a downtrend, but waves differ: 4H is down, 1H and 15m are up. Treat rebounds within a downtrend as counter-moves and keep the three timeframes equally weighted. Downward branching points are 63,330 and 62,470; upward thresholds are 63,960 and 64,180.
Important Prices
- 67,670 JPY: 4H retracement high. The uppermost resistance.
- 65,510 JPY: July 31 high. ① T2.
- 65,480 JPY: 4H 120EMA (daily 20EMA equivalent). Upper resistance band.
- 64,730 JPY: Crucial level in a downtrend. ① T2 / ③ Complete withdrawal.
- 64,310 JPY: 4H previous pullback low (broken) = resistance turn. ① T1 / ② T2 / Return-to-sell Zone 2 upper limit.
- 64,180 JPY: 4H reversal price / 1H retrace high (August 3 high). Close above this ends the 4H down wave. ① Core, ② T1 / Return-to-sell Zone 2 lower limit.
- 63,960 JPY: 15m retrace high. ① Trigger / ② Core activation / Return-to-sell Zone 1 upper limit.
- 63,810 JPY: Upper price barrier. Lower limit of Return-to-sell Zone 1.
- 63,470 JPY: Current price / Night close.
- 63,330 JPY: 15m reversal price. Upper limit of Buy-on-dip Zone 1 / ① Complete withdrawal / ④ Trigger.
- 62,850 JPY: Nearby support around August 3 low. Lower limit of Buy-on-dip Zone 1.
- 62,730 JPY: Downtrend threshold. ③④ T1.
- 62,470 JPY: 1H reversal price. Upper limit of Buy-on-dip Zone 2 / ④ Core activation.
- 62,110 JPY: August 4 Night low. Lower limit of Buy-on-dip Zone 2 / ③④ T2.
- 60,920 JPY: 1H pullback low. ② Complete withdrawal / ③④ T2.
- 60,520 JPY: Most recent structural low.
Trading Ideas
① Break-following (Long)
- Trigger: Clear above 63,960 (15m retrace high) with a 15m close (upward high updated).
- Early-entry price: 63,960. After breakout, pull back toward breakout price vicinity or toward the upward-sloped 20MA with 1m/5m or other short-term candles for a lead time (back-entry; RR based on breakout price).
- Actual-entry price: 64,180 (4H reversal price / 1H retrace high) recovered on a 1H close = end of 4H down wave and core activation.
- Stop loss / invalidation: First leg fails below 63,660; core below 63,330. Complete withdrawal below 63,330.
- Target: 64,310 (partial profit + cost basis), 64,730 / 65,510.
- RR: T1 (64,310) = 1.2 / T2 (64,730) = 2.6. T1 is thin; emphasize back-entry and core position.
- MFE Protection: Exit at +200 with cost or small profit, secure at least +100 with +300 or trail. Given 4H downtrend, rebounds are unlikely to continue for long; protect early. If trigger is confirmed and T1 reached, skip further entries.
② Buy-on-dip (Long)
- Standard: Pull back to 62,850–63,330 (the August 3 low vicinity to 15m reversal price) and confirm rebound shape with 15m close. Deep pullbacks to 62,110–62,470 (Night low to 1H reversal price); in that case, set stop at 62,010.
- Early-entry price: 63,000. After confirming rebound with a 15m close, wait for 20MA to turn upward and price to recover above 20MA to enter early.
- Actual-entry price: 63,960 (15m retrace high) recovered on a 1H close = core activation.
- Stop loss / invalidation: Early leg below 62,700; core below 62,470. Complete withdrawal below 60,920 (switch to IV).
- Target: 64,180 (partial profit + cost basis), 64,310 / 64,730.
- RR: T1 (64,180) = 3.9 / T2 (64,310) = 4.4.
- MFE Protection: Exit at +200 with cost or small profit, secure at least +100 with +300 or trail. Target shallow pullbacks and deep pullbacks to 62,470 are both considered, as the rebound is sought within a downtrend.
③ Sell-on-rally (Short)
- Standard: Capped at 63,810–63,960 (upper resistance to 15m retrace high); confirm stall with 15m close. Zone 2 is 64,180–64,310 (for this case, stop at 64,610).
- Early-entry price: 63,900. After stall is confirmed with a 15m close, measure rebound high near or around downward-sloping 20MA with a spot for early entry (back-entry).
- Actual-entry price: 63,330 (15m reversal price) broken by a 1H close = the 15m up-move has failed and core activation.
- Stop loss / invalidation: Early leg recovers above 64,200; core recovers above 63,960. Complete withdrawal above 64,730. If price recovers above 64,180 on a 1H close, do not short.
- Target: 62,730 (partial profit + cost basis), 62,110 / 60,920.
- RR: T1 (62,730) = 3.9 / T2 (62,110) = 6.0.
- MFE Protection: Exit at +200 with cost or small profit, secure at least +100 with +300 or trail. The overall direction is down, but the 1H and 15m turned up right after, so manage as a mean-reversion play; beware traps and sudden reversals. If a trigger is confirmed and T1 already reached, skip additional entries.
④ Break-following (Short)
- Trigger: Break below 63,330 (15m reversal price) with a 15m close (the upward move from 62,110 collapses).
- Early-entry price: 63,330. After breakdown, measure rebound toward the break price vicinity or toward the upward-sloped 20MA with short candles (1m/5m) for a lead entry (back-entry; RR based on break price).
- Actual-entry price: 62,470 (1H reversal price) broken by a 1H close = 1H up-move also collapses and core activation. At this point the early leg has reached T1; take partial profit and move cost basis before adding more core pieces.
- Stop loss / invalidation: Early leg recovers above 63,680; core recovers above 63,330. Complete withdrawal above 63,960.
- Target: 62,730 (partial profit + cost basis), 62,110 / 60,920.
- RR: T1 (62,730) = 1.7 / T2 (62,110) = 3.5. T1 not thick, so back-entry should be thorough.
- MFE Protection: Exit at +200 with cost or small profit, secure at least +100 with +300 or trail. This is a downward reversal; beware false breaks and sharp reversals.
Current Actions
- Most important line 1: 63,960–64,180 JPY. 15m retrace high–4H reversal price / 1H retrace high. A close above 63,960 invites a follow-on long (entry at 63,960). A 1H close above 64,180 ends the 4H down wave. A stall in this band implies a larger-trend return sell (early reference 63,900).
- Most important line 2: 63,330–62,470 JPY. 15m reversal price – 1H reversal price. A rebound from 62,850–63,330 is a dip-buy (early entry at 63,000). If 63,330 is closed above on a 15m close, it triggers the setup in section ④; a break below 62,470 would break the 1H wave and reinitiate decline.
Entry prices, triggers, and stops are set based on the chart shape at the close (reversal prices, minor lows, and retrace highs for each timeframe). If the structure changes over time, unless higher-timeframe structure changes, adjust entry prices using the lower-timeframe wave reversal prices (e.g., when a short-term timeframe temporarily moves into an up-move before reversing) to better reflect actual conditions, and adopt the option that matches reality more closely.
※ This report is for information purposes and not investment advice; please make trading decisions at your own risk.