
August 4 (Tue): 【BB&HM】 Nikkei 225 VS GOLD
This time
it is generally said to be inversely correlated with stock prices
“GOLD”
in comparison.
【Overall Scenario Probability】
This week's overall market is…
“Up: 55% / Down: 45%”
※ With the sharp decline of the dollar/yen continuation, due to inverse correlation, the four major U.S. indices are rising, and the NY Dow・Russell2000 MACD Golden Cross appears to show slightly upward momentum, thus
※ Presented as a reference level.
【This Week's Market Focus Points】
is characterized by the continuation of the sharp decline in the USD/JPY and the predominance of gains in the four major U.S. indices, forming a scenario of inverse correlation functioning at this stage. The Nikkei 225 is sandwiched between important moving averages from above and below, and the next direction seems greatly determined by which side it breaks through. GOLD shows strong downward divergence, and a potential wide drop via a 1:1 N-wave is emerging. Each market is approaching a critical juncture, making this week's price action highly noteworthy. Details will be explained in the paid section.
➥The continuation is explained in detail in the members-only report.
If you have not registered yet, please click here ↓
【Integrated Version】
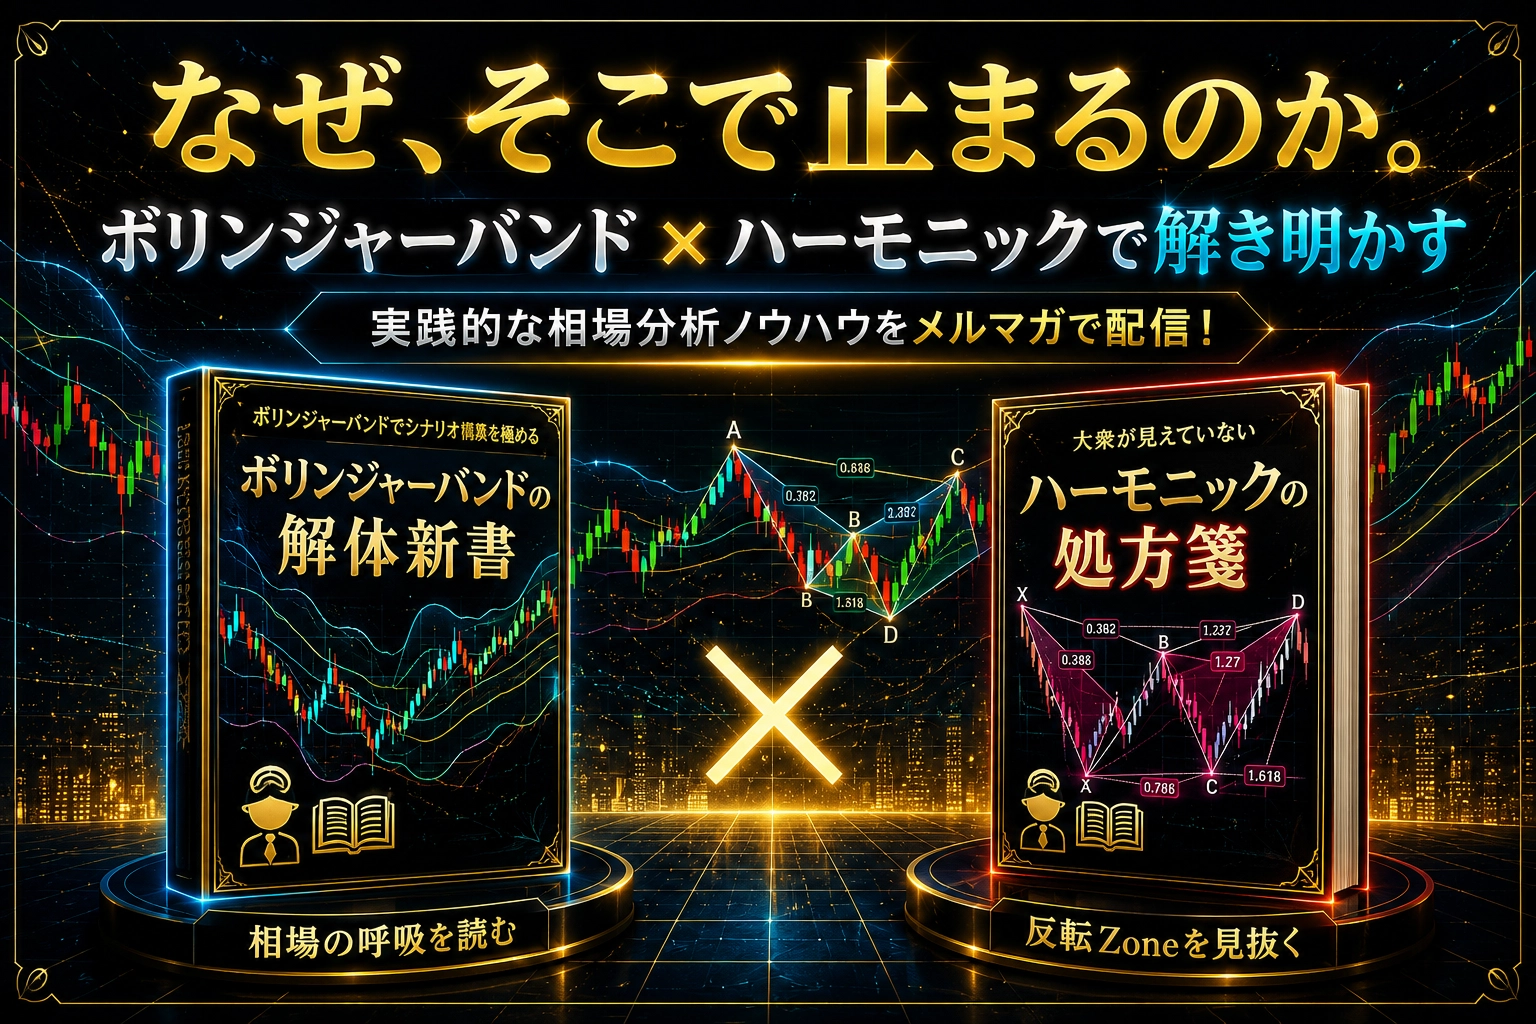
“Why does the market stop there?” Bollinger Bands ✕ Harmonics Fusion of statistics and geometry to accurately capture market turning points!
https://www.gogojungle.co.jp/finance/navi/series/1613?via=articles_detail_aside
(※ The following is for members only.)
--------------------------------
【Environmental Recognition】