

Forex intervention of 5 yen per day for USD/JPY. On that day, my EA did not make a single trade — I reviewed what the EA had been doing across 23 years of interventions.
On July 30, the USDJPY moved more than 5 yen in one day.
That day, did you hold any positions?
I am a part-time trader operating USDJPY with automated trading (EA).
In the morning, I checked rates on my phone and thought, "This is bad," and hurried to check my account.
To start with, my EA did not execute a single trade that day.
However, I’m not going to write that I “navigated it well.”
Upon investigation, half of it was by design, half by pure luck.
This time, after整理ing what happened at the end of July,
we will verify with actual numbers in a backtest of the past 23 years, “what was the EA doing on intervention days.”
We will verify with actual figures.
▼ The EA in question is here (Mikazuki USDJPY)
https://www.gogojungle.co.jp/systemtrade/fx/79530
https://www.gogojungle.co.jp/systemtrade/fx/79530
■ What happened on July 30
From July 28 to 29, following the FOMC, the policy rate was kept at 3.50–3.75%.
The press interpreted the meeting as dovish, and the dollar was sold.
And then July 30.
USDJPY fell from the upper 163s to 157.98 in one day, a drop of more than 5 yen.
According to reports, real-money intervention by Japanese authorities and a rate check by the New York Fed were conducted.
The timing was also unexpected.
July 30 was the first day of the Bank of Japan's monetary policy meeting.
Most market participants did not expect moves during the meeting,
and that is believed to have amplified the price moves.
On the same day, the U.S. Treasury Secretary stated that “the yen is significantly undervalued.”
And Korean authorities reportedly carried out won-buying intervention as well.
From the United States, comments that the yen is too weak appeared, and Korea moved on the same day.
This looked somewhat different from Japan fighting alone.
Going forward, there may be coordinated intervention by Japan, the United States, or Japan-US-Korea.
At least, I think we should keep that possibility in mind.
However, I don’t know “when” or “how much.”
Rather than guessing what’s unknown, I decided to look at past data.
■ What my EA was doing at the end of July
First, actual records.
I will present the forward-test numbers as published on GogoJungle verbatim.
Period: May 12, 2026 – July 28, 2026
Trades: 36
Win rate: 83.3% (30 wins, 6 losses)
Cumulative P/L: +109,017 yen
Average holding: 5.9 hours (median 3.7 hours)
And the last trade is this.
July 28 05:55 Buy 163.704 (stop loss 163.264)
July 28 11:18 Take profit 163.804 +4,700 yen
After this, from July 29 to 31, there were zero new entries.
There were zero positions carried over as well.
The low on July 30 was 157.98 yen.
The difference from the last buy at 163.704 yen is 5.72 yen.
Even from the stop-loss line of 163.264 yen, it is 5.28 yen lower.
If I had kept that position,
the stop-loss would have functioned only marginally well.
■ However, not that it “avoided” it
To be honest, the 3-day breakdown is different.
July 29 – FOMC day → stopped as designed
July 30 – intervention day → excluded by the filter
July 31 – BOJ meeting day → stopped as designed
My EA has dates for FOMC, US jobs data, and BOJ meetings built in from the start,
and around those dates it stops taking new entries.
The 29th and 31st are the results of this mechanism.
But the 30th is different.
The BOJ meeting “Day 1” is not included in the filter.
In other words, the EA was able to trade as usual. Yet it did not trade.
The reason is probably simpler.
A feature that would satisfy the AI entry condition did not appear on the chart. That’s all.
■ I lined up past “yen-buy interventions” all together
This is the main point from here.
My EA is validated on tick data from May 2003 to June 2026.
In other words, all past currency interventions are included.
The same direction as the current event, “yen-buying, dollar-selling intervention,”
i.e., interventions in which the market falls sharply, occurred eight times in the past.
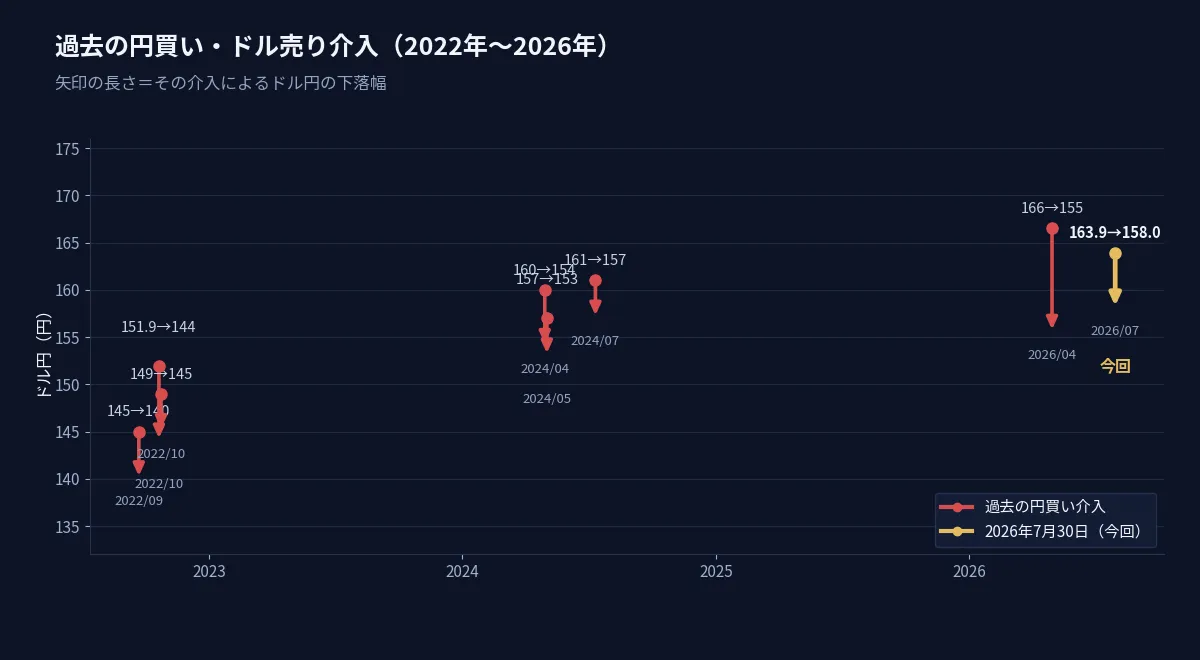
2022 Sep 22: 145s → temporarily 140s
2022 Oct 21: 151s → temporarily 144s
2022 Oct 24: 149s → temporarily 145s
2024 Apr 29: 160s → temporarily 154s
2024 May 2: 157s → temporarily 153s
2024 July 11: 161s → temporarily 157s
2024 July 12: (follow-up intervention)
2026 Apr 30: 160s → 155s mid
For these 8 days, I will present numbers in three viewpoints.
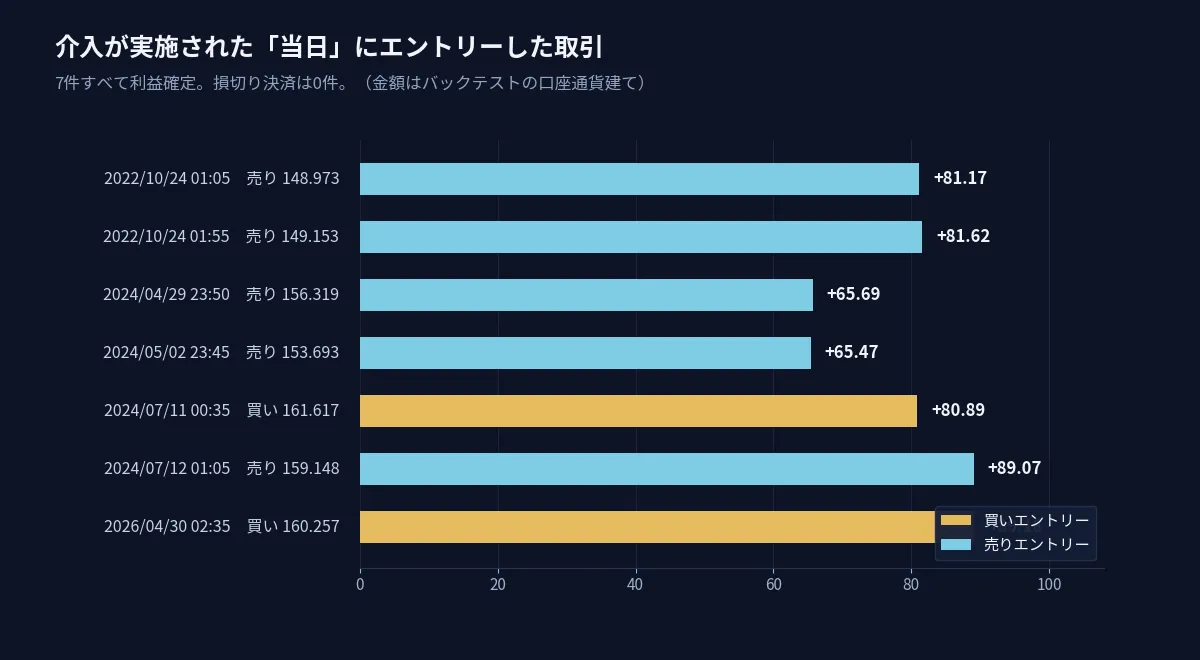
● View 1: Only the day the intervention was actually implemented
Extract only trades that entered on the intervention day.
Count: 7
Wins: 7 (all wins)
Profit: +553
Stop-loss closures: 0
Note: amounts are in the backtest account currency.
Surprisingly, the EA did not avoid intervention days.
It traded normally. And it never hit a stop loss.
Two impressive examples:
2024-07-11 00:35 Buy 161.617
08:26 Take profit 161.720 (+10 pips)
→ Afterwards, intervention occurred that day. From 161 to 157 range
2026-04-30 02:35 Buy 160.257
05:30 Take profit 160.357 (+10 pips)
→ Afterwards, fell from the upper 160s to the mid-155s
In both cases, bought on the intervention day and took 10 pips within a few hours, then declined.
And after falling, the market collapsed.
This was not because I “was reading” it.
The take-profit width was 10 pips and the average holding about 3 hours.
Since it was designed not to hold for long, I happened to step away before the storm.
That’s how I understand it.
● View 2: Expand to the day before and after intervention
Including the day before and after, this is what happened.
Trades: 12
Take profit: 11
Loss: 1 (time-out -3.12)
Total: +779
11 of 12 trades were take-profits. The sole loss was also small due to time-out.
● View 3: Expand to the day before and after intervention by month
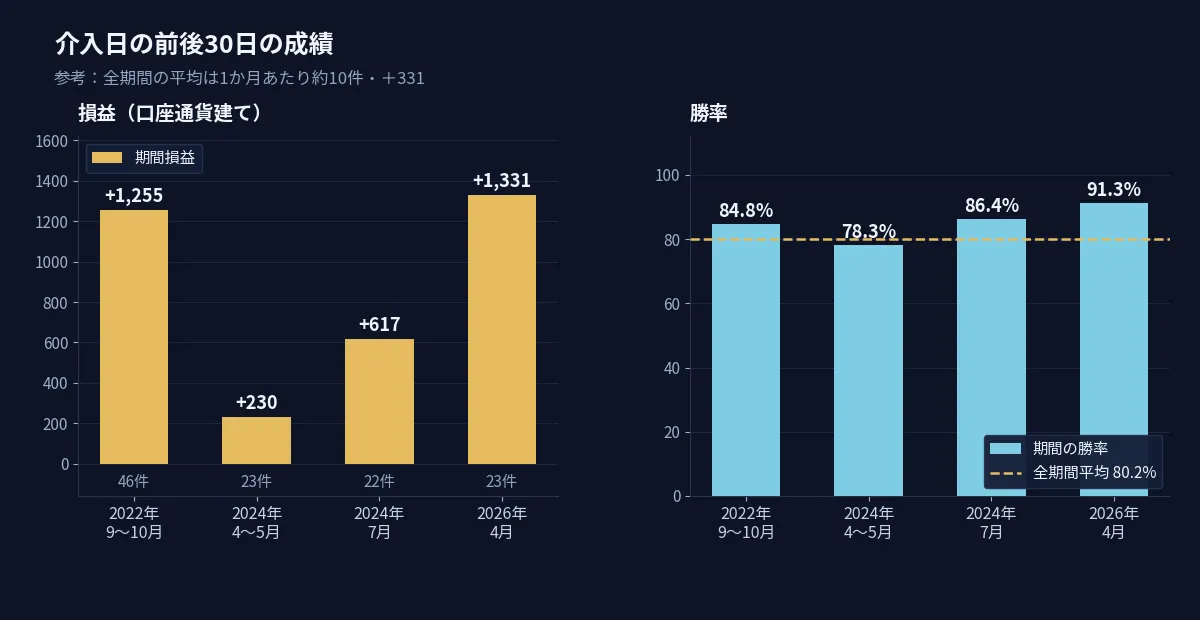
Look at 30 days before and after the intervention.
2022 Sep–Oct: 46 trades +1,255 win rate 84.8% max loss -1,235
2024 Apr–May: 23 trades +230 win rate 78.3% max loss -430
2024 July: 22 trades +617 win rate 86.4% max loss -616
2026 Apr: 23 trades +1,331 win rate 91.3% max loss -244
For reference, the overall average is about 10 trades per month, +331 per month.
Around intervention periods, there are more trades and the results aren’t worse than average.
However, when viewed on a monthly basis, there are months with losses.
May 2024 was a month with interventions, but it had a monthly loss of -454.
We cannot say “intervention periods are always favorable.”
■ Reference: I also looked at the opposite direction of intervention (yen-selling)
For completeness, I will also touch on the opposite-direction interventions.
This is where the market surges, yen selling and dollar buying interventions.
2003 May–2004 Mar: about 32.8 trillion yen large-scale intervention
67 trades, -628.52 (negative for the full term)
2010 Sep 15: no entry on the day
2011 Mar 18: no entry on the day (G7 coordinated intervention)
2011 Aug 4: prior-day selling triggered stop-loss -579.83
2011 Oct 31: on the day, 2 trades, both take-profits +452.80
My EA is biased toward buying.
In the most recent forward test, 30 of 36 trades were buys.
Because it’s a strategy that buys dips, it doesn’t pair well with sharp upward intervention.
What happened this time is yen-buy intervention, i.e., a sharp decline direction.
In the future, if there is coordinated intervention, the direction is likely to be yen-strengthening.
From past data, that direction still seems relatively favorable.
However—
■ I will not cherry-pick favorable numbers
That said, I don’t put much trust in these results.
There are three reasons.
First. The sample size is too small.
In 23 years, yen-buy interventions occurred on 8 days, and there were only 7 on-day entries.
Even though 7 are all wins, it isn’t a number that supports any statistical claims.
Second. There are actual losing moments.
May 2024 was a monthly loss, and the opposite-direction interventions were a loss overall.
Saying “an EA is strong in interventions” is not accurate.
Third, and this is the biggest point,
backtest spreads cannot fully reproduce real intervention spreads.
In real interventions, spreads widen sharply, there can be order-rejections, and slippage can exceed expectations.
Just because backtests didn’t hit a stop loss doesn’t mean the actual market would behave the same.
■ So, what can be concluded?
■ So, what can be concluded?
From these data, I did not learn that interventions strengthen the EA. Instead, two more modest lessons:
One: the meaning of not holding positions for long.
A design that takes profit at 10 pips and holds on average 3 hours is dull and unexciting.
People often ask if you can make bigger gains.
But having a shorter exposure time itself acts as a form of protection during storms.
Another: predictable events can be avoided with pre-set rules.
FOMC, US jobs data, BOJ meeting.
Prices cannot be predicted, but dates can be predetermined.
That is something you can set as a pre-arranged rule.
By the way, the upcoming schedule is as follows.
August 7 (Fri) US employment data
September 4 (Fri) US employment data
September 16 (Wed) FOMC
September 18 (Fri) BOJ Monetary Policy Meeting
I don’t know how the market will move next week.
But I already know what’s coming next week.
Predicting and preparing are not the same thing.
What I can do is prepare for the latter.