

[Technical Report] Complete Causal Design of "Subtraction" to Prevent Backtest Drift — Reconstructing from a phantom curve to a live-fire specification, eliminating the illusionary curve and transforming from 2.06x raw to a live ammunition specification:
Even though the backtest shows a rising curve, the live account (forward test) collapses the EA. The primary reason many system traders face this phenomenon is that the curve has been artificially created by over-optimization (curve fitting).
This paper takes the opposite approach. It adds no pretension of raw skill, only the discipline to the market environment and a compound growth tolerance that can withstand real-money operation, turning all ten years into positive. This is the complete record of a reconstruction by pure causality aimed at technical EA operators.
The validation conditions are kept constant across all cases: the same data, the same period (2016–2025), the same account, and the same vertical/horizontal scale. There are no curves drawn from imagination. Only the genuine ledger that actually ran on one-minute charts of specific cross pairs (after cleansing, 5,996,481 bars) is used.
1. Bud — The naive “pre-funding drift”
The prototype (bud) of this strategy is astonishingly simple. In the time window heading toward the Tokyo fixing (9:55 AM), buy the target currency at server times 01:00 and 02:00, and close at 04:00.
That’s all. There are no excessive technical indicators, filters, or compounding. It is a hypothesis that lightly captures the “pre-drift” created by real demand flows toward the fixing with two legs. The following results come from firing this every trading day as is.
Total trades: 4,716 attempts
Win rate: 58.2%
Raw edge: 2.06x
PF: 1.49
Max DD: −5.23%
Annual performance: 9 wins, 1 loss (Only in 2016 there was a negative -313 pips)
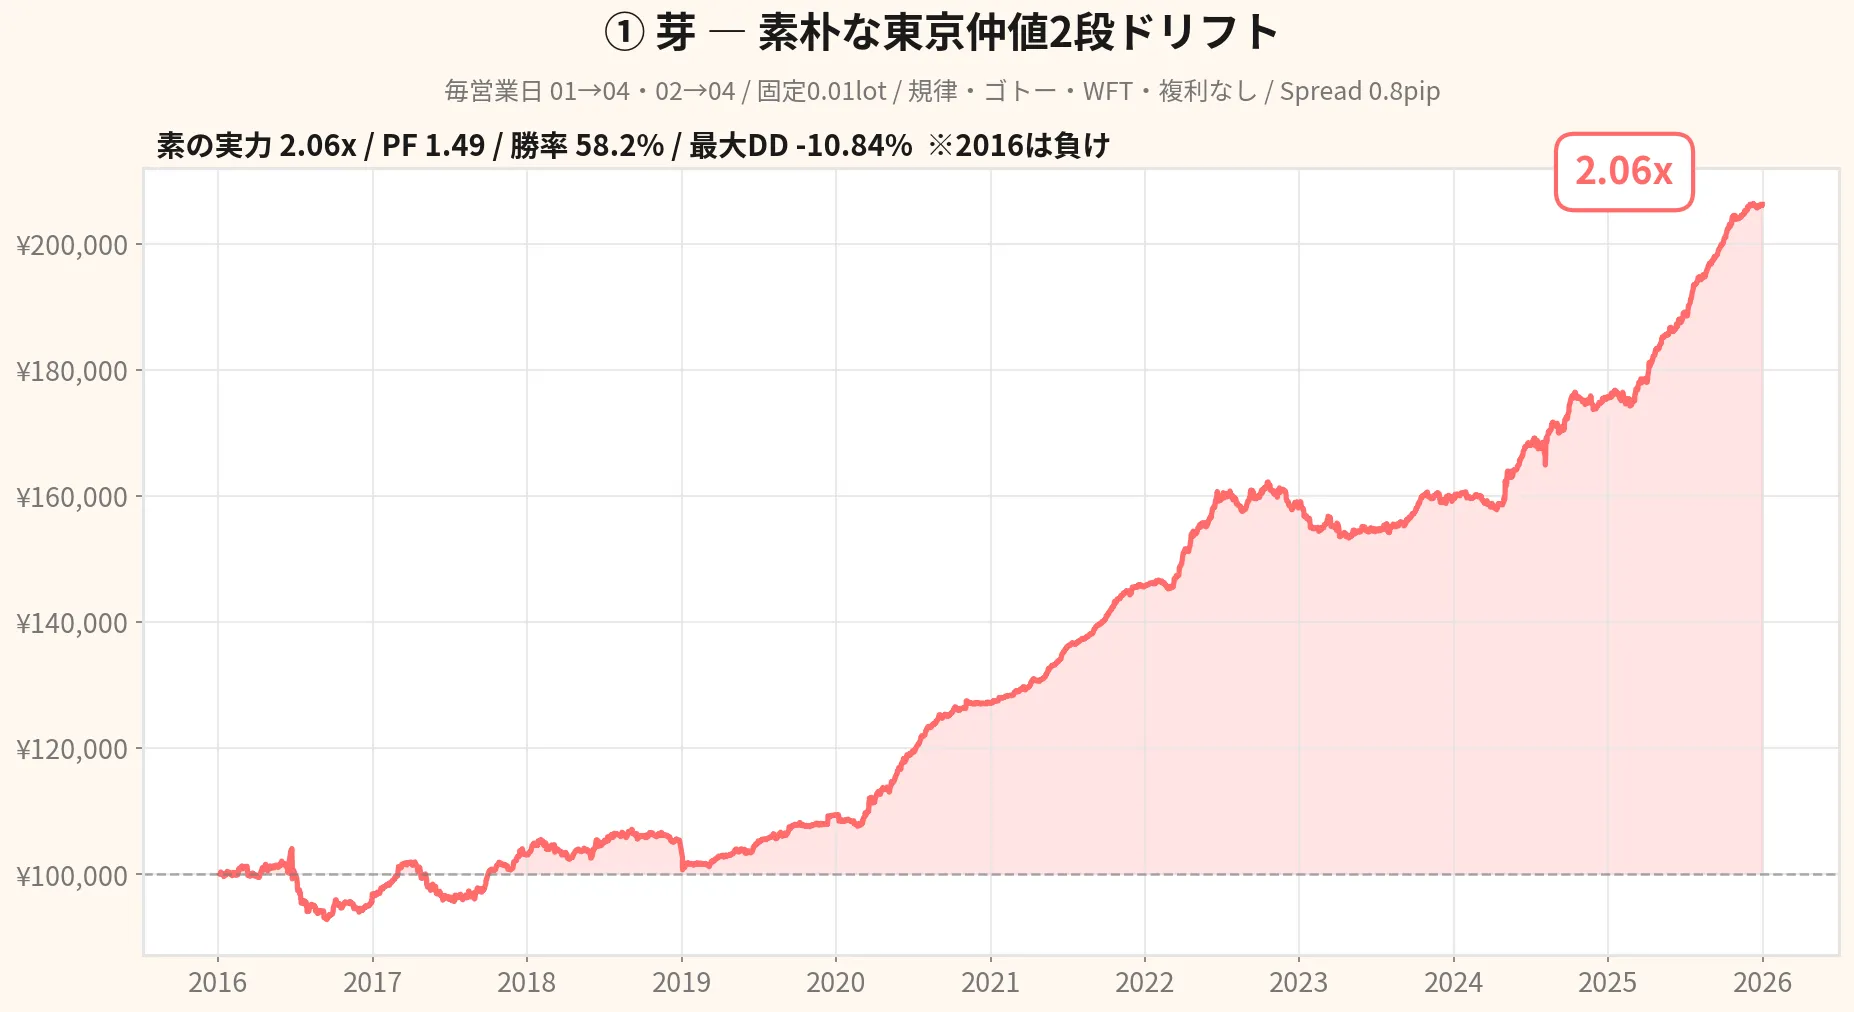
[▲ Figure ①: Upward-sloping but locally deep drawdown in the naive backtest curve ▲]
The positive expectation remains beyond friction (spread), but the bud curve is completely unprotected against market noise.
Here, many EA developers would be tempted to draw the bud as downward-sloping and claim, “So reconstruction saved it.” But actual measurements do not allow that. The naive pre-fix drift already has roughly double the “real edge” as-is, without any embellishment. Since we cannot lie, we present it as is.
The problem is that it grows blindly. It trades every day without considering good or bad terrain, and if the market bites in 2016, it fails. If this curve were run as an EA without adjustments, it would not withstand drawdown and would begin to crumble on a real account.
2. Diagnosis — Examine the bud with three axes
Before reconstruction, diagnose the bud along three axes. The rule of process design is to decide before acting.
Axis 1: Survival and friction (practicability)
Both legs close within the day’s 01→04 and 02→04, and are not carried over to the next day. Therefore there is no weekend window risk for hunting, nor the risk of capital depleting due to a midnight crash. Even after subtracting a 0.8-pip round-trip spread, a PF of 1.49 remains, meaning it survives beyond the friction. This axis passes.
Axis 2: Logical honesty (causality)
This is the heart of the case. The bud itself trades every day with no optimization, and no hindsight. However, when adding a discipline to “only select favorable markets” during reconstruction, choosing the method wrongly can trap you in an unrealistically clean upward curve. If you look across the entire period and select the best-performing regime, it’s easy to produce an unreal curve like 9.33x — and it will fail immediately in forward testing.
If the post-selection raw multiplier jumps higher than the pre-selection, you should be suspicious. The reconstruction here completes regime selection only within the IS (past three years) and uses moving averages that only consider the previous day’s close (no future reference). It is a fully causal design that selects only based on information available at trade time.
Axis 3: Real-market adaptation (robustness and risk)
The bud’s weakness is clear. Trading daily without considering the market environment (blind), losing in 2016, and not accounting for real-account constraints such as capital and maintenance margin with fixed lot sizes. To adapt to real markets, you need an environment filter (discipline) and sizing that embeds risk (compound growth + drawdown floor).
Diagnosis is complete. Do not shave off the bud’s edge. What should be added are the “quality” (discipline to select good terrain) and “compound-growth tolerance” (sizing that does not crumble in real accounts).
3. Reconstruction — Use discipline to raise “quality” and staged compounding to build “compound-growth tolerance”
(1) Discipline — Filter the noise, never cut the edge
Sell only on days when the previous close is above the long-term MA and the previous day did not have a sharp drop. Which long-term MA and which crash threshold to use is causally chosen for each reporting year using IS3-year performance (WFT). The results are aligned with the buds using the same fixed 0.01 lot and same scale.
Raw multiplier: 2.06x → 2.01x (nearly flat)
PF: 1.49 → 1.76
Total trades: 4,716 → 3,216 (about 1,500 trades pruned; total pips ~10,623 → 10,051, nearly unchanged)
Annual performance: 9 wins, 1 loss → 10 wins, 0 losses (2016 turned profitable)
This is proof of the reconstruction’s honesty. The fact that the raw multiplier barely moves itself is evidence that the curve is not artificially inflated by curve fitting. Discipline sacrificed about 1,500 trades, but nearly all the profits remain. What was cut was not edge but noise that moved the win rate. The curve did not rise dramatically; rather, the quality improved and stopped sinking.