

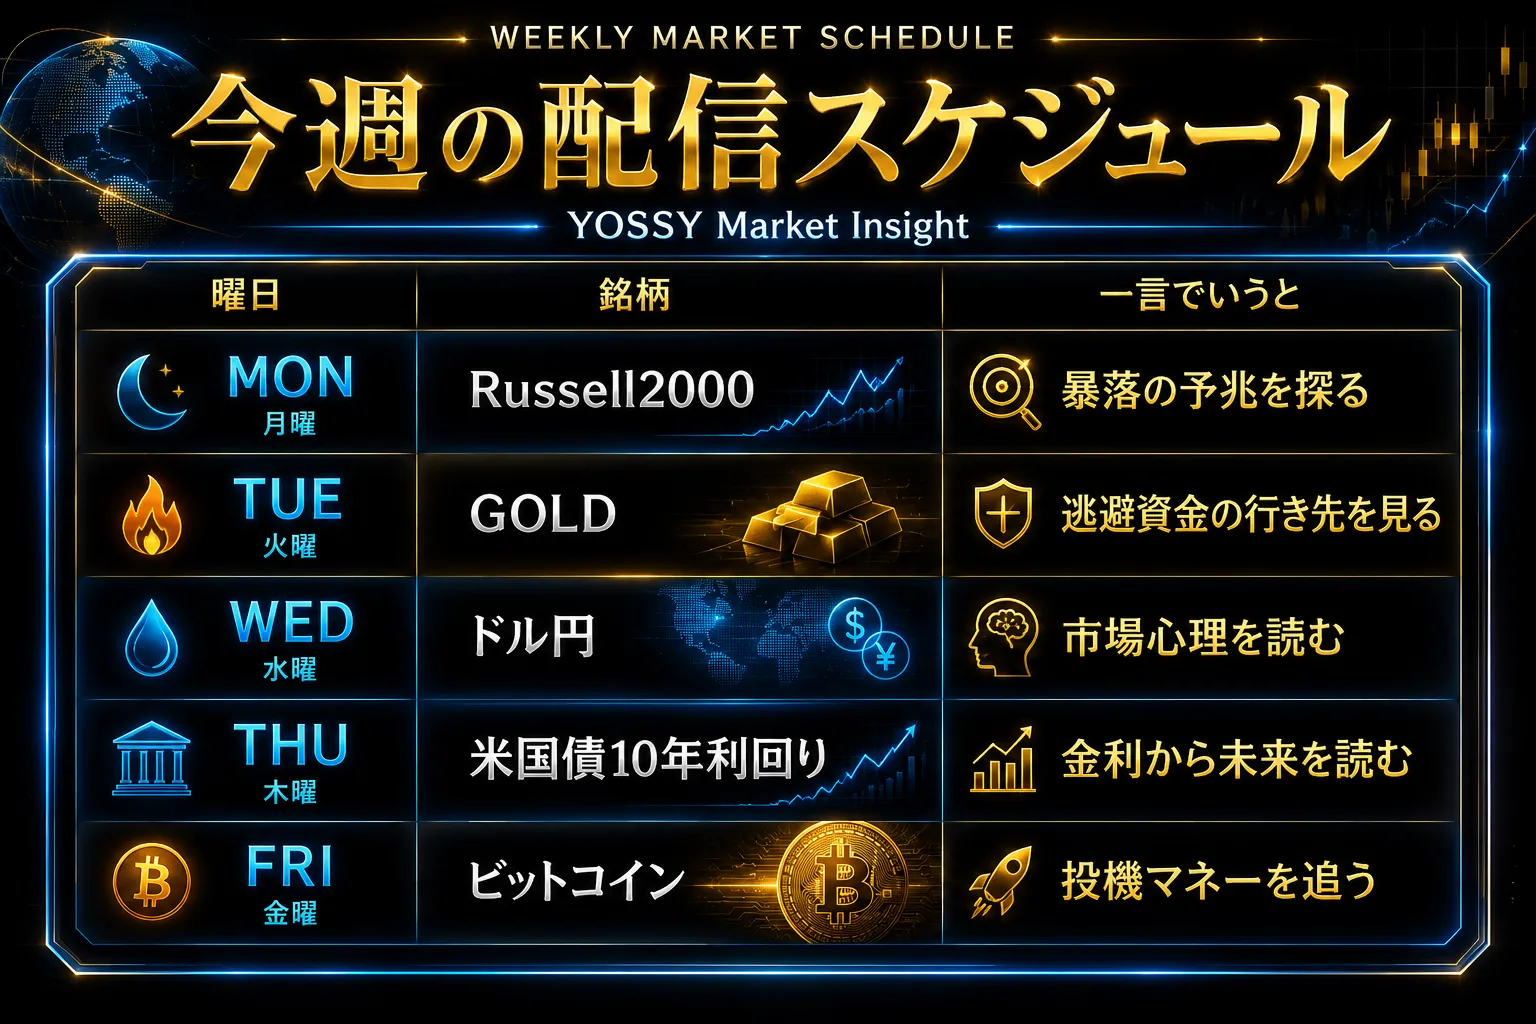
August 3 (Mon): 【BB&HM】 Nikkei 225 vs Russell 2000
This time
we will compare with the “Canary in the coal mine” that leads the downtrend
“Russell2000”
to the comparison.
【Overall Scenario Probability】
This week's overall market is…
“Up: 45% / Down: 55%”
※ While the four major U.S. indices are around their moving averages and in a state where either direction is possible, the focus is on the battle at the rising weekly moving averages of the Nikkei 225 and Russell 2000. If it breaks downward, there is a risk of a significant decline.
※ Presented as a reference level.
【This Week's Market Focus】
This week's market is, the S&P 500’s harmonics have been【completed】, while the various markets are at a state of “either direction possible” around the moving averages, and we are approaching an important phase to determine the next direction.
Nikkei 225・Russell 2000 together with the weekly upward-moving MA is approaching a major turning point, and if broken below from here, there is potential for a large downside move.
Additionally, the correlation between the dollar/yen and US 10-year Treasury yields has changed, making judgments more difficult in this situation. You cannot take your eyes off the price movements this week.
Details will be explained in the paid section.
➥The continuation is explained in detail in the member-only report.
If you are not yet registered, please click here ↓
【Integrated Version】
“Why does the market stop there? Bollinger Bands × Harmonics: A fusion of statistics and geometry to capture precise reversal points in the market!”
https://www.gogojungle.co.jp/finance/navi/series/1613?via=articles_detail_aside
(Note: The following is for members only。)
--------------------------------
【Environmental Perception】