Utilization of the "Visualization Indicator" (Part 262)
「Visualized Indicator」 utilization(that262)
1.「28 currency pair list indicator」をさらに進化発展させインジケータ
「8CP Visualized Indicator」でCADJPYを描く
「8CP Visualized Indicator」にはOceania版、London版、NewYork版、AnyCP版があります。今回は、NewYork版を使いました。
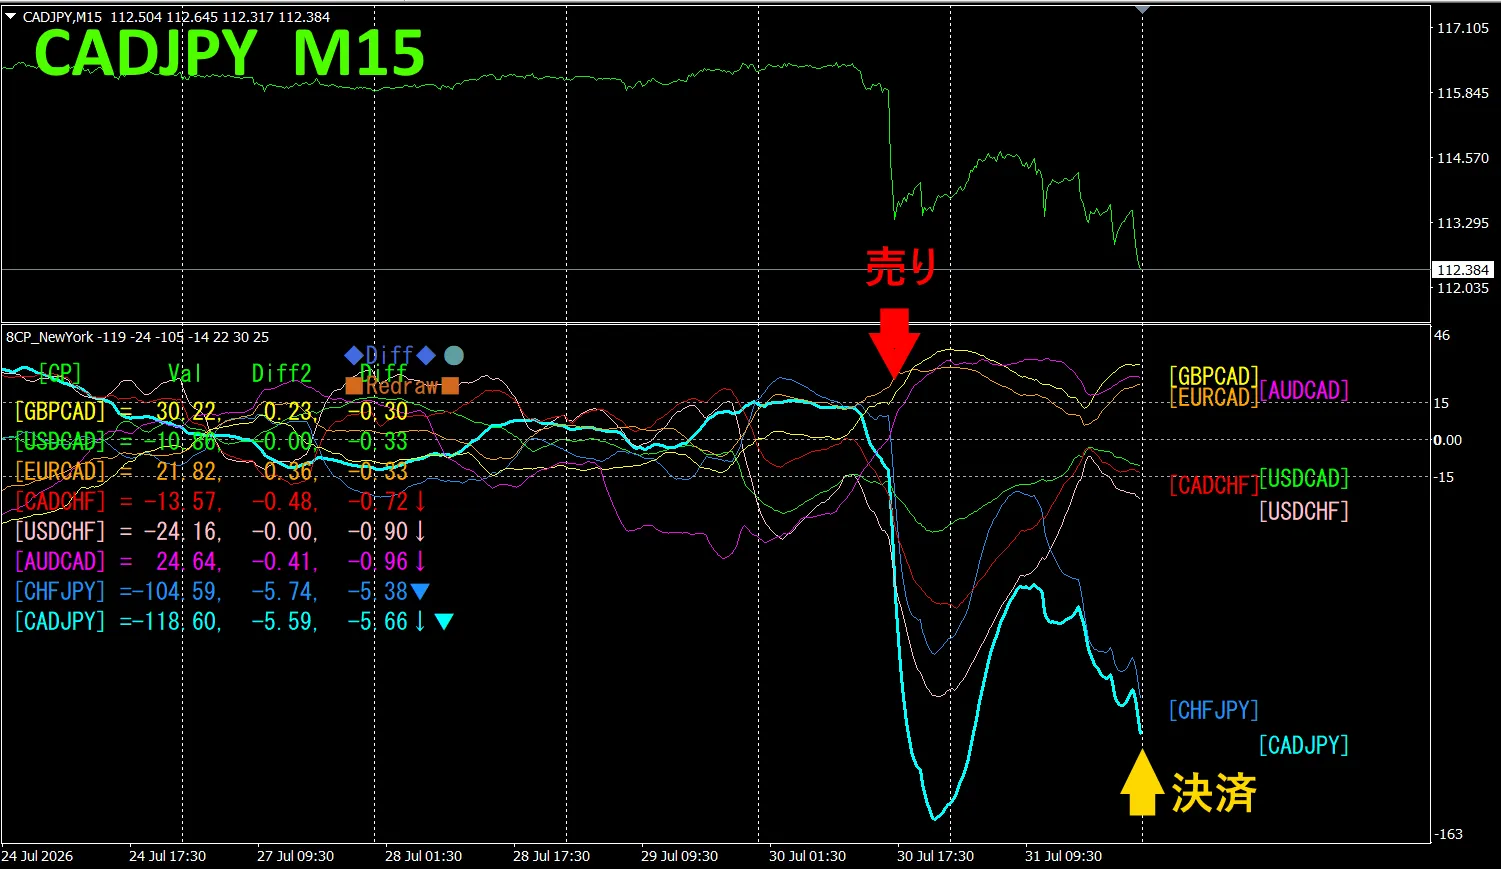
Upper half shows, CADJPYの15分足 chartです。Lower half shows,「8CP Visualized Indicatorによるものです、水色粗線のグラフがCADJPYに相当します
On Thursdayのグラフが他のグラフ群から下に勢いよく抜けてきたので、sellしました。週末に決済して約240pipsの利益が得られました。
Currency Strength/Weakness Chart
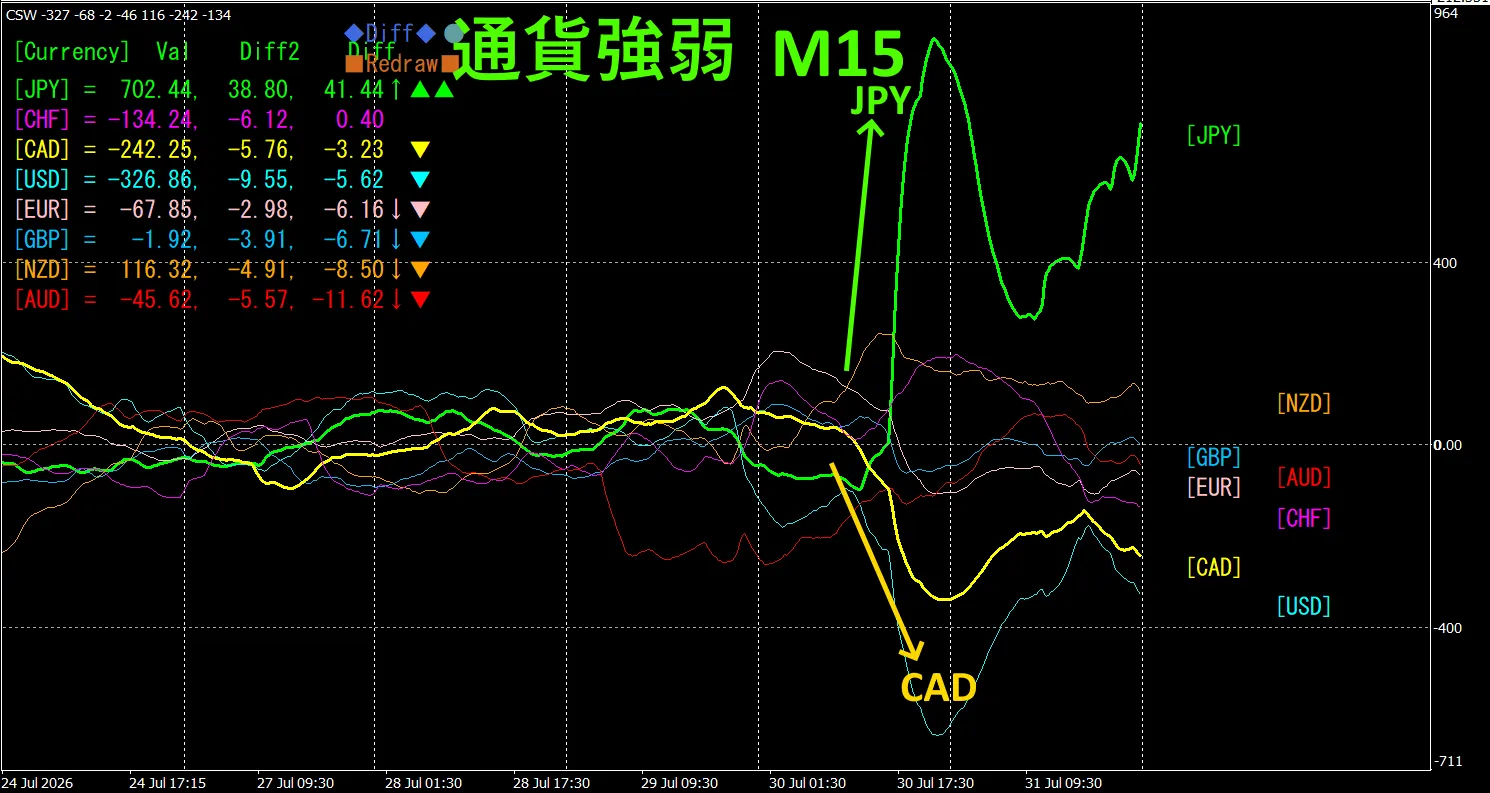
Looking at the 15-minute currency strength chart,, JPY and CAD are inversely correlated. Trade only in the areas where JPY and CAD spread apart. Since JPY > CAD, you should sell CADJPY at the diffusion point. Because they are inversely correlated, target only that point.
In FX, choose currency pairs that are currently showing the strongest growth and inverse correlation; results will follow.
“Aim for currency strength/weakness inverse correlation!” is a fundamental rule in FX.
With “TrendLine-EX”, you can automate entries and exits with diagonal trendline breaks. Since you can leave it as is, trading becomes easy and comfortable. “TrendLine-EX” is a semi-automatic EA that can do automatic selling on breaking below trendline and automatic settlement on breaking above it.
2. Best SelectTry the indicator
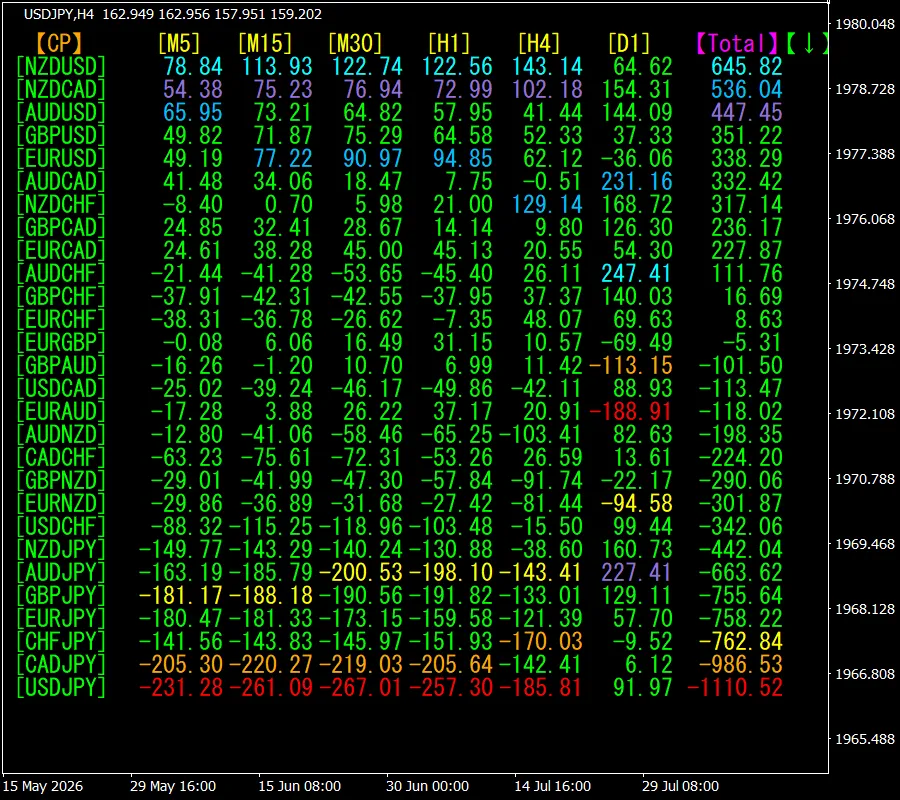
The chart below is from 2026/7/30 23:35(JST) のスクリーンショットです。
[Total] shows values in ascending order. The bottom USDJPY is, [Daily] is excluded from all other timeframes, all shown in red color. The Total value is -1110.52, indicating a large negative figure. This suggests a significant downtrend in USDJPY.
Now, to view.
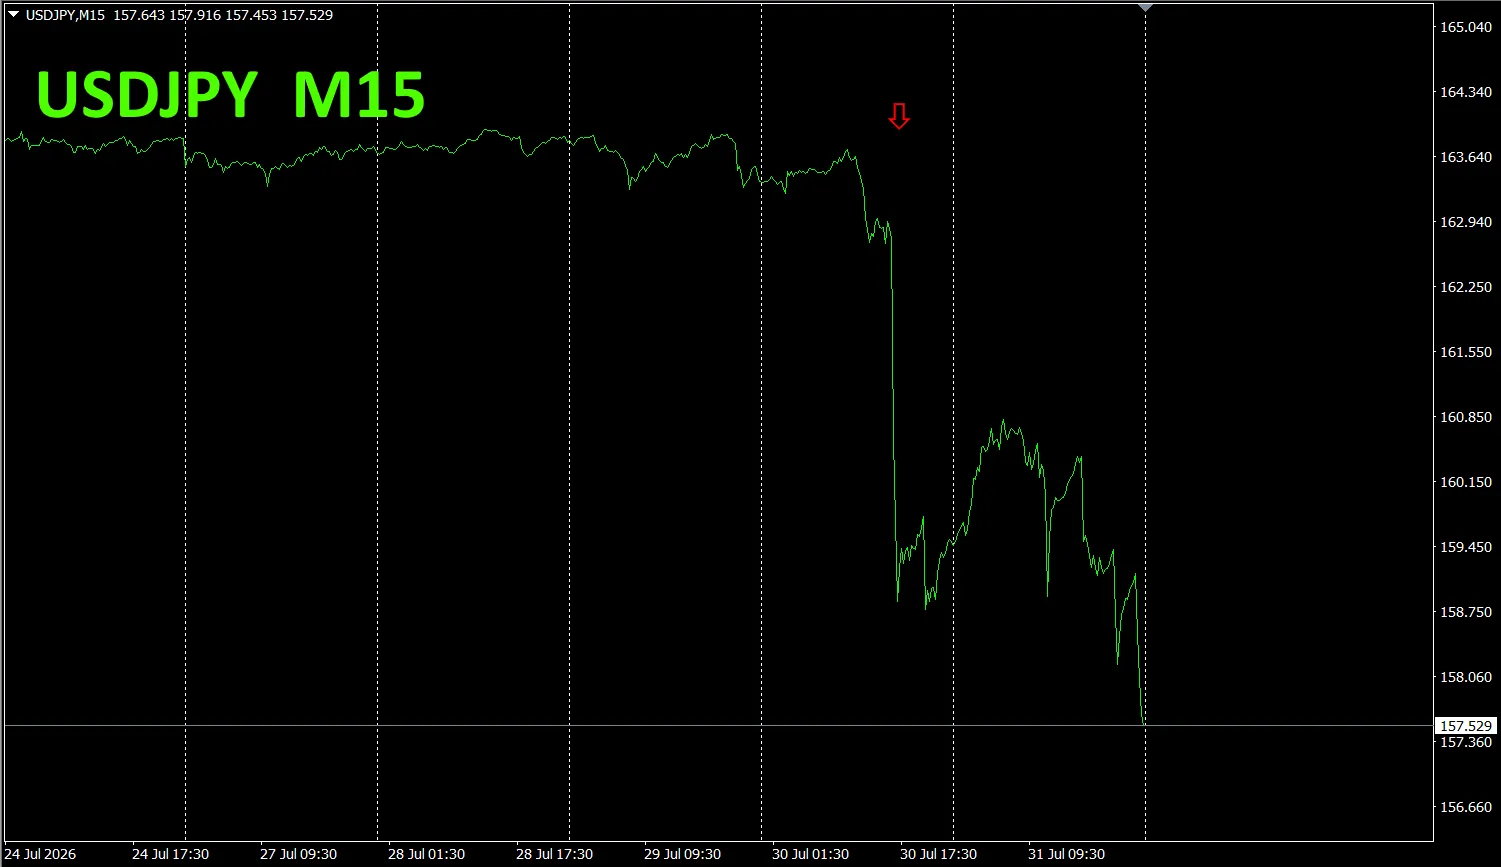
The red arrows mark the screenshot capture points. This captures the plummet. This drop is likely due to forex intervention.
“28 indicator” Also, the “28 deviation comparison indicator shows the currency pair with the largest deviation among the 28. It’s an excellent indicator to determine at a glance which currency pair to trade among all pairs.
“28 Best Select indicator”

https://www.gogojungle.co.jp/tools/indicators/35128
3. 2021年5月から追っているの動きはどうなった?
From May 2021,
To view the overall trend, 3 weeks is drawn.
Previously, I wrote as follows.
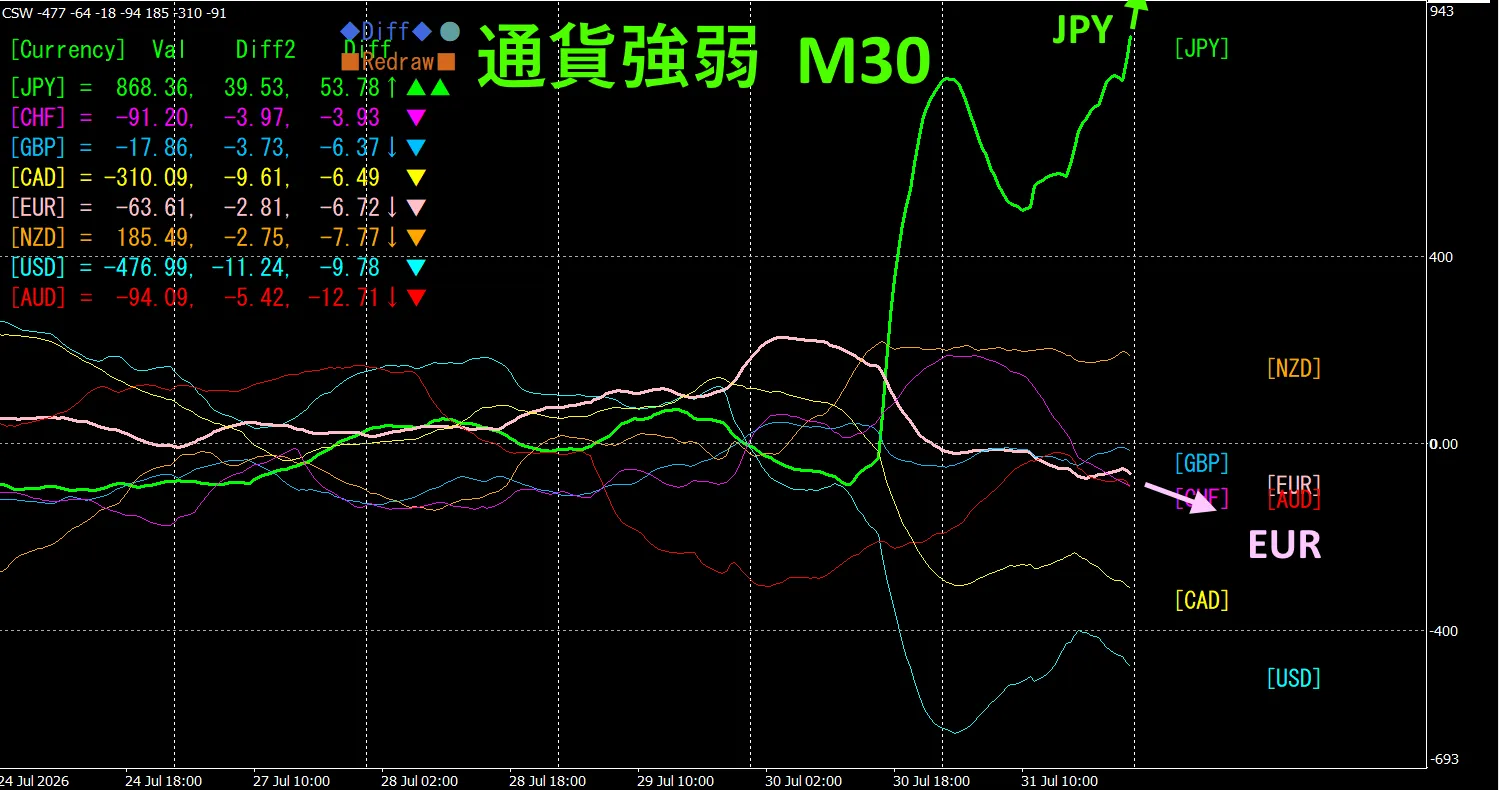
Pink indicates EUR, green indicates JPY. EUR vector tends to move slightly downward, JPY tends to move slightly upward. Therefore is expected to move slightly downward.
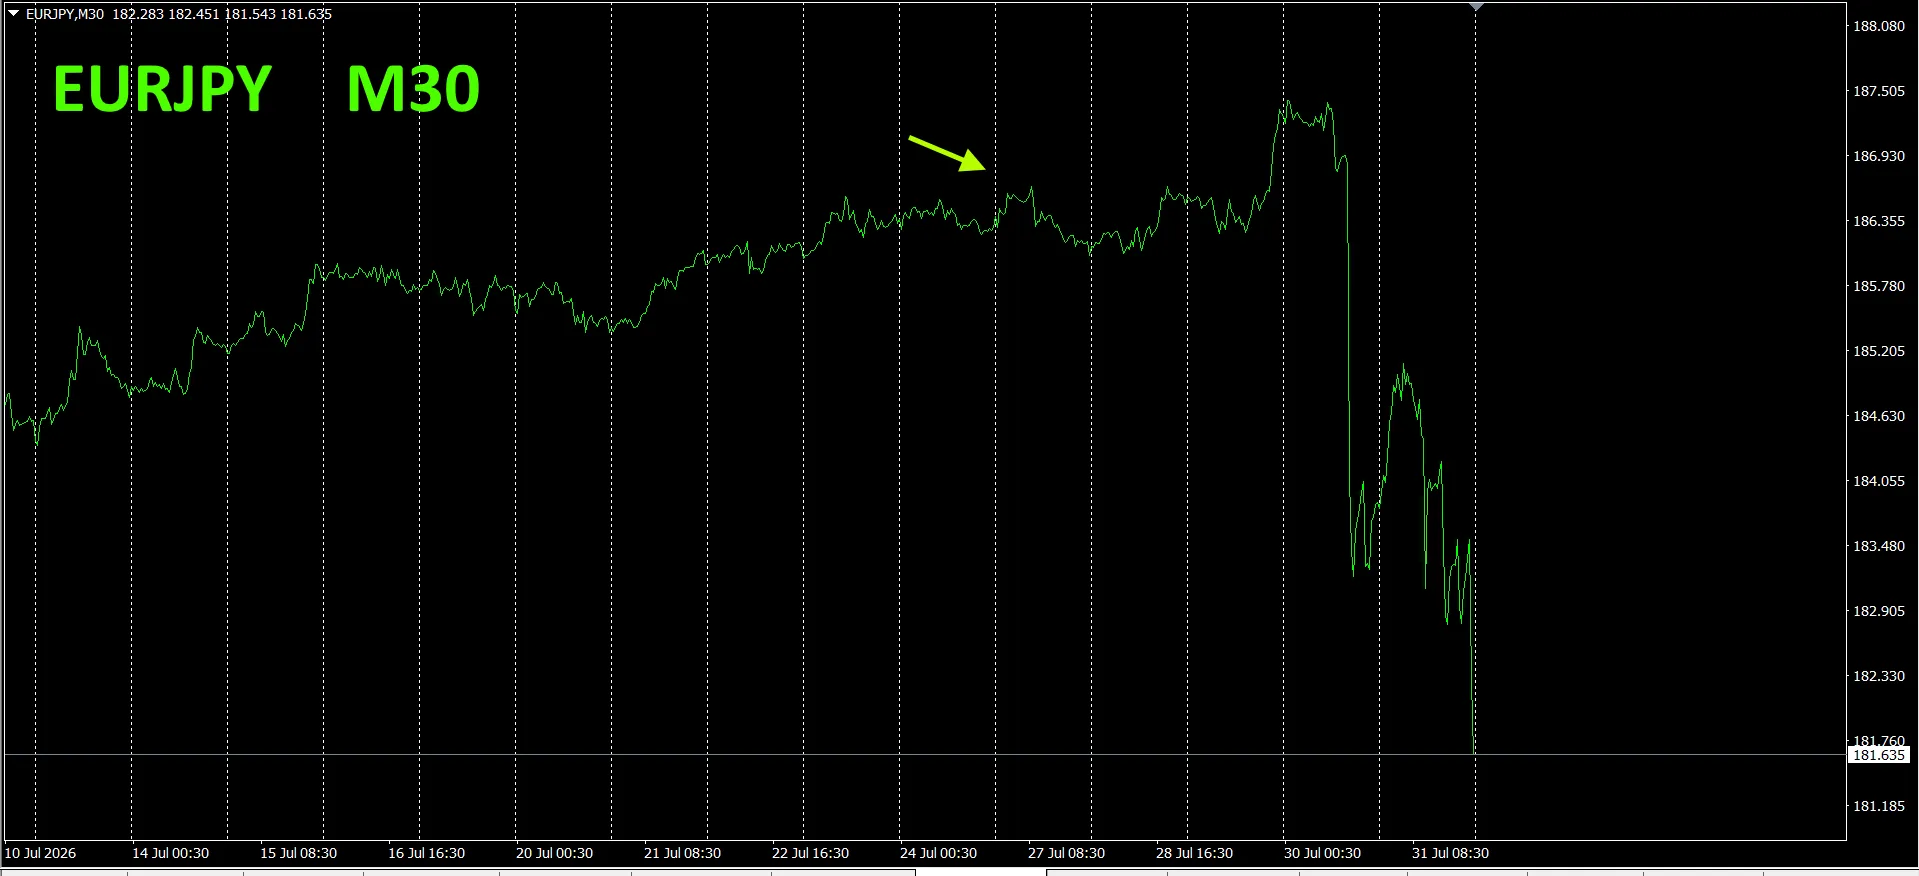
On Monday, there was a slight decline on Tuesday, but then it rose again and due to FX intervention, dropped sharply.
30-minute currency strength chart. The pink EUR, green JPY.
EUR vector is downward; JPY is sharply upward. Due to intervention, it will eventually revert, but for a while it looks like it will trend downward.
4. Tried new indicator Dual_MACD_Trend_Indicator
New indicator “Dual_MACD_Trend_Indicator” see below.
MT4 version:https://www.gogojungle.co.jp/tools/indicators/62199
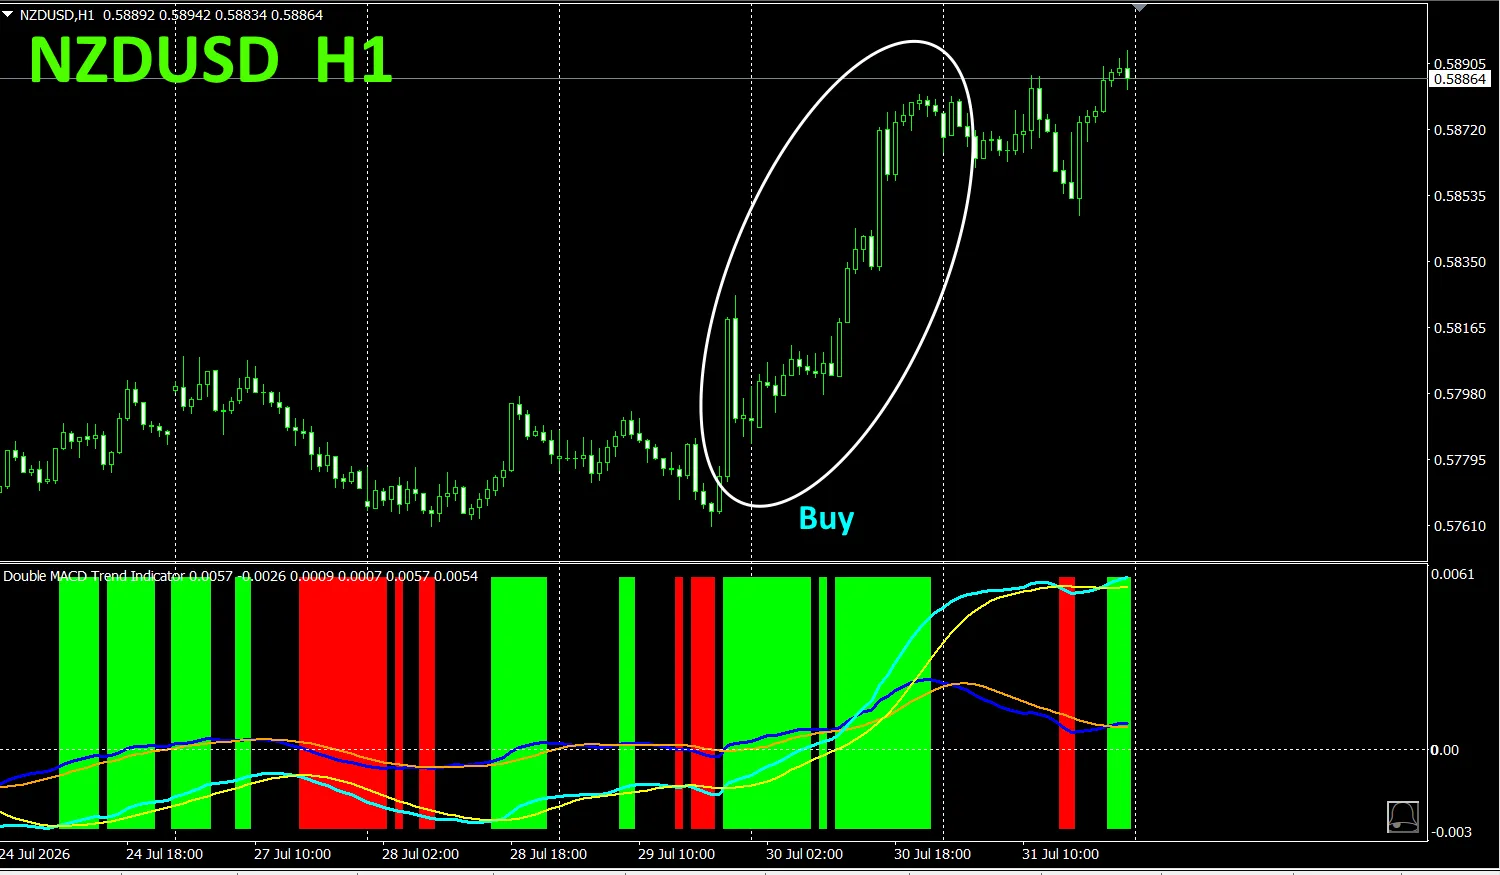
This indicator clearly shows trend direction with color. Color bars: Lime = buy, Red = sell; simple for beginners to use. If bar color is green, it indicates an uptrend; if red, a downtrend; if no color, no trend. With color visualization, you can grasp trend status at a glance
This indicator was applied to NZDUSD on a 1-hour chart. The buy/sell zones are clearly separated, making trading easy at a glance.
In the upper chart, buy when the green zone is highlighted with a white ellipse.
“Dual_MACD_Trend_Indicator” uses buy in green zones, sell in red zones, and not trading otherwise
.
5.“Trend_Color_MA_MTF”. From the sales page
“Trend_Color_MA_Dual_MTF”. This tool is not just a moving average line. It visualizes the trend direction in color, and notifies you with sound and alert when opportunities arise, acting as your personal assistant.
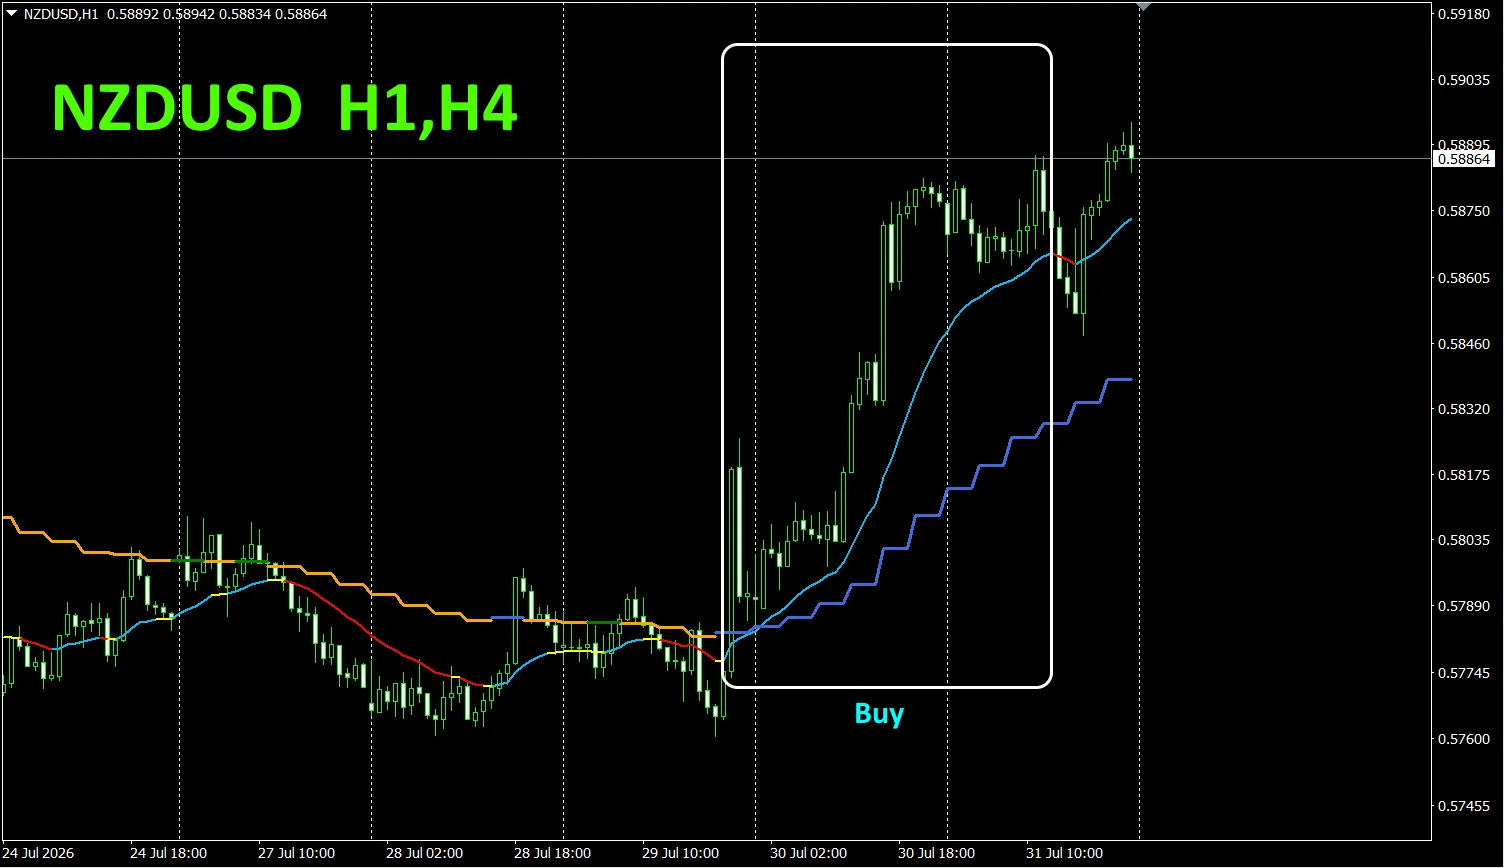
As an example, NZDUSD on a 1-hour chart shows, with 4-hour moving averages displayed simultaneously.
The 4-hour moving average is jagged like steps. The 1-hour moving average also, both are shown in blue tones during uptrends and in red tones during downtrends, allowing color-based quick assessment of current vs higher-timeframe trend direction.
When higher timeframe color matches the current timeframe, trade accordingly: red for sell, blue for buy.
In selling, the 1-hour MA turns red while descending, and the 4-hour MA turns orange while continuing to descend, at which point you sell.
In the upper chart, focus on the area enclosed by the white box for buying trades.
For more details, please see the following link.
https://www.gogojungle.co.jp/tools/indicators/75985
「8CFD Visualization Indicator Any Version」

https://www.gogojungle.co.jp/tools/indicators/32288
「
https://www.gogojungle.co.jp/tools/indicators/50115
「TrendLine-EX」
https://www.gogojungle.co.jp/tools/indicators/42257
「8 Currency Strength Visualization Indicator」, please refer to the following pages.

MT4 version https://www.gogojungle.co.jp/tools/indicators/39150
MT5 version https://www.gogojungle.co.jp/tools/indicators/39159
【】