

2026/8/1 Dollar-Yen, Gold, SP500, and Nikkei 225 Environment

For verification purposes, we provide a weekly video of the USD/JPY price movement.
USD/JPY
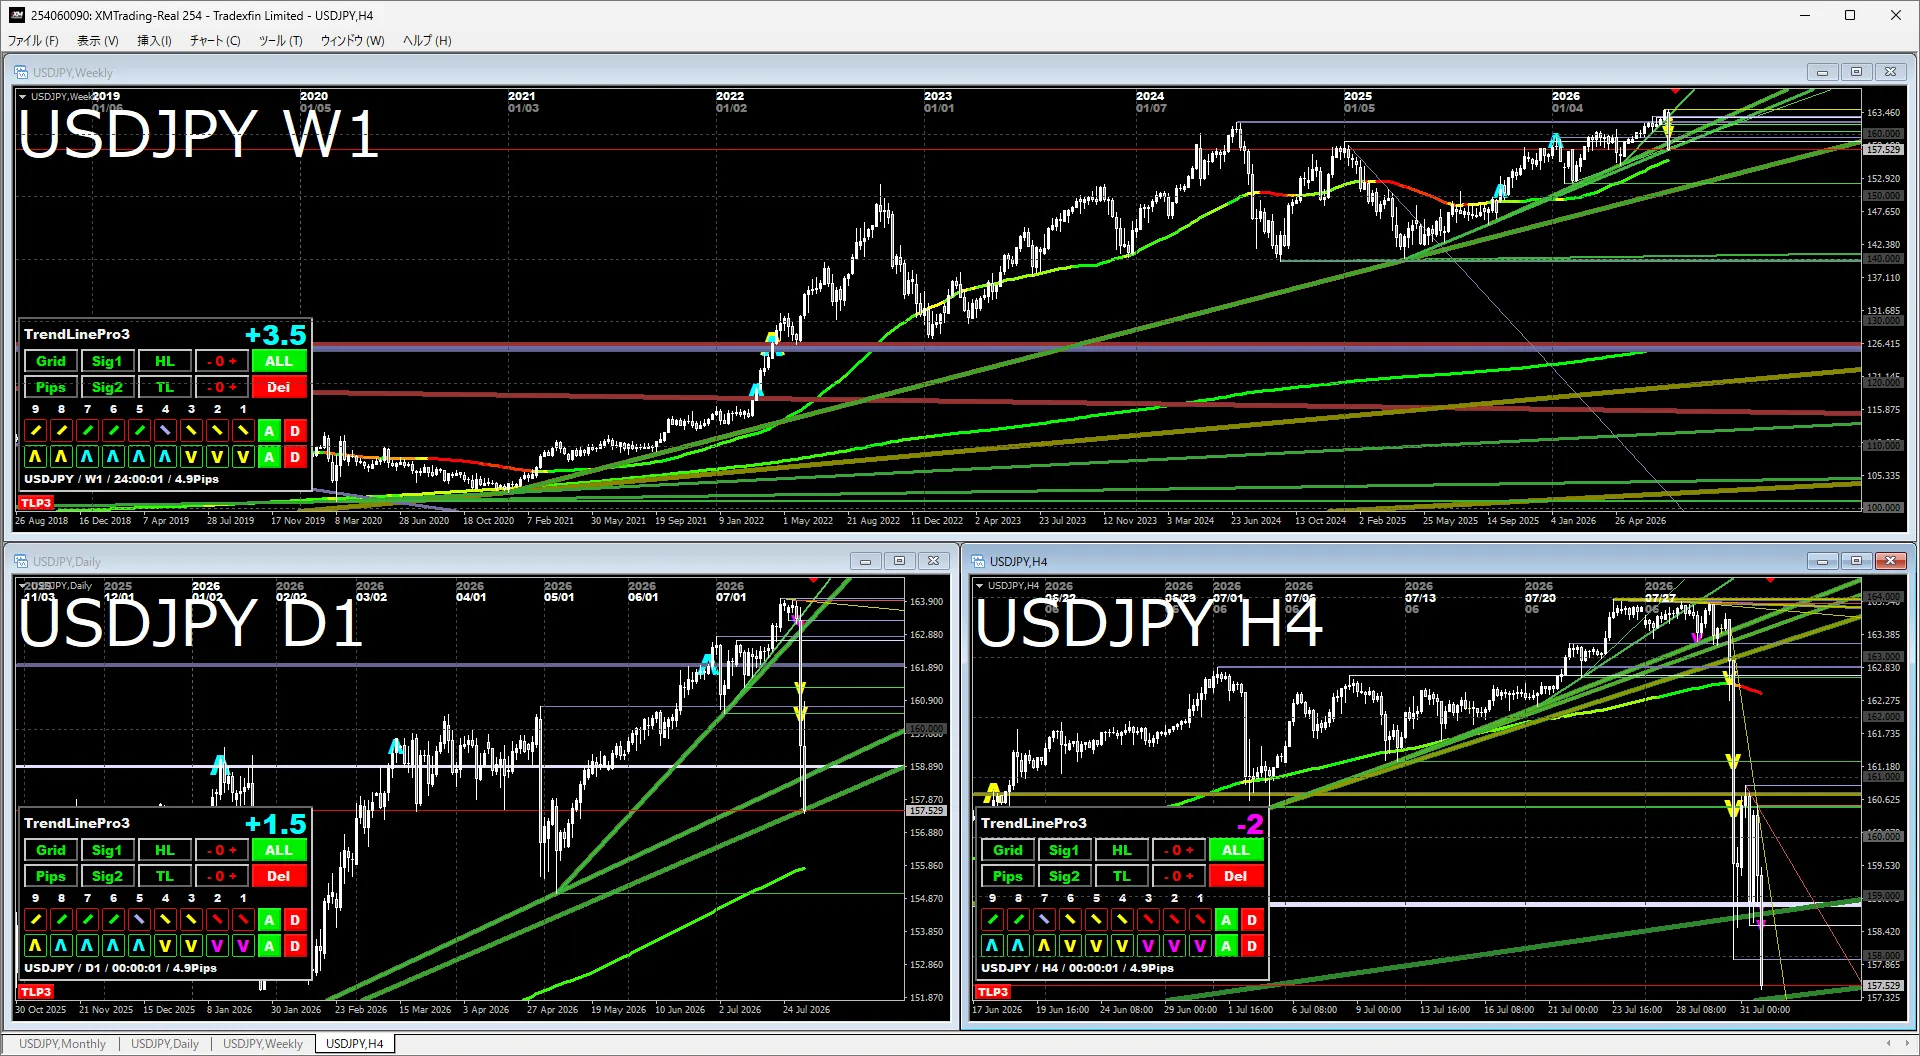
WeeklyThe trend continues higher, clearly making new highs. The key point to watch is whether the trendline is broken downward. If it breaks, a sideways to mid-term consolidation is likely.
Daily & 4-hourAfter a high, intervention caused a sharp drop, with the trendline stopping it for now. This intervention suggests that it may be wise to not take a long position too hastily. For a mid-term downtrend, a further drop or a period of price/time adjustment is needed. Currently, a sideways development seems likely.
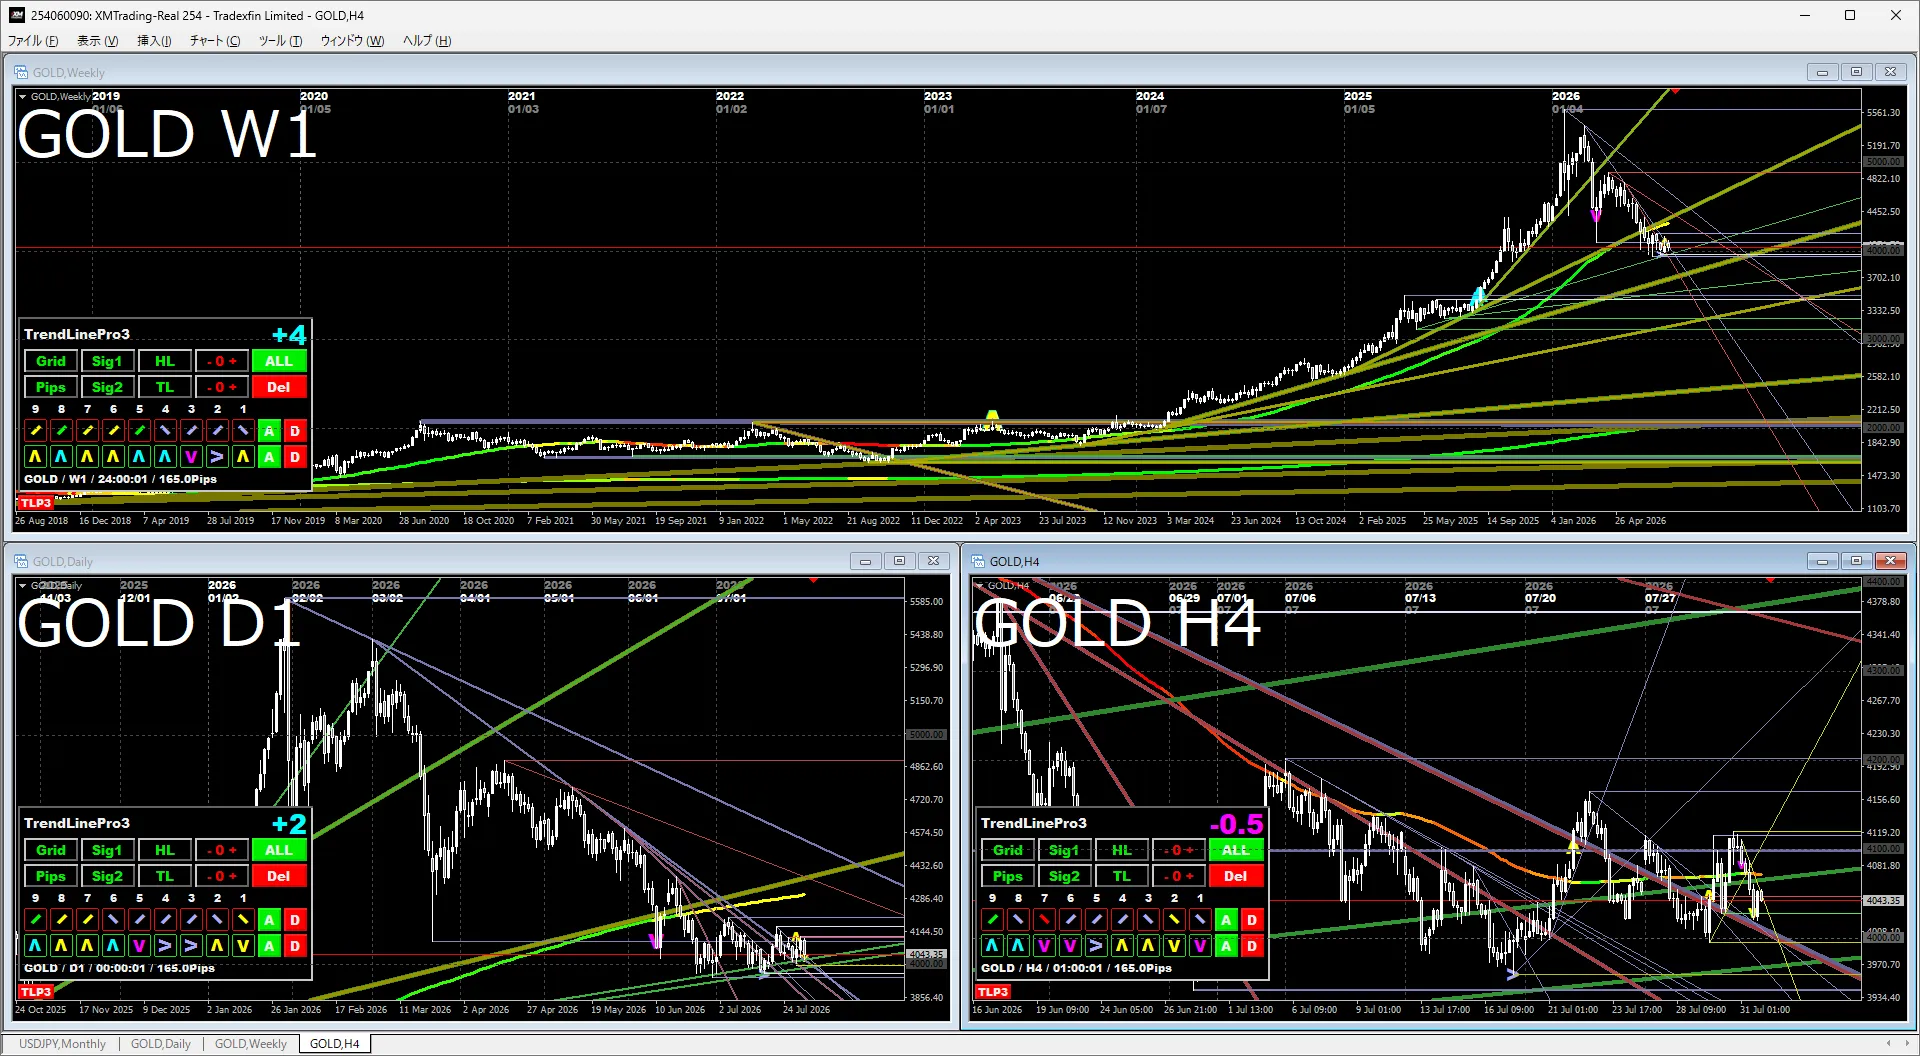
Since currency value declines are being anticipated, gold is expected to rise in the long term. However, the market may have lost some heat and entered a long-term consolidation. The score indicates a slight uptick.
Daily & 4-hourA breakout above around 4170 or a breakdown below around 3950 is being watched. If it breaks below, near 3500 becomes a noticeable target. The price may complete a time-based adjustment next week or the week after, making the direction of movement clearer.
S&P 500
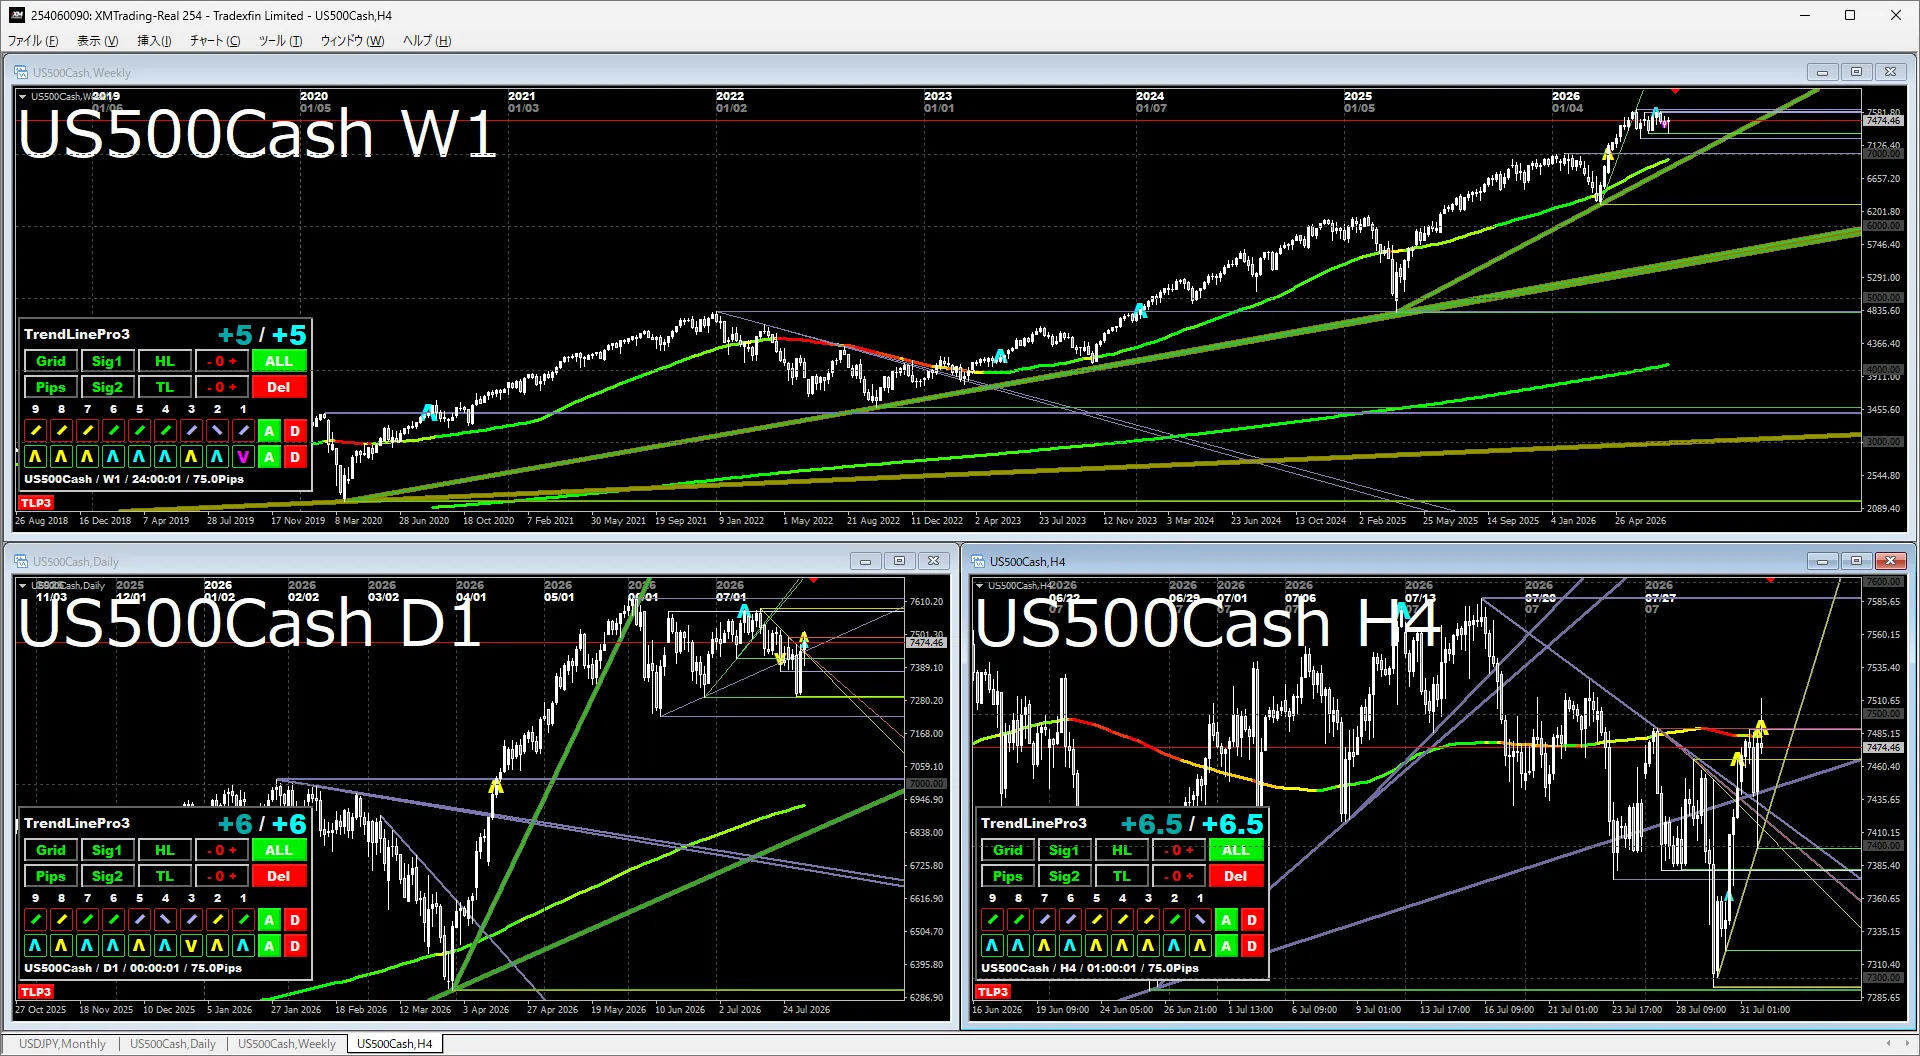
Daily & 4-hourThis week could have seen a move lower, but it did not break the recent low and held. It is likely to test higher levels again. Once new highs begin, around 8,500 becomes a focal point.
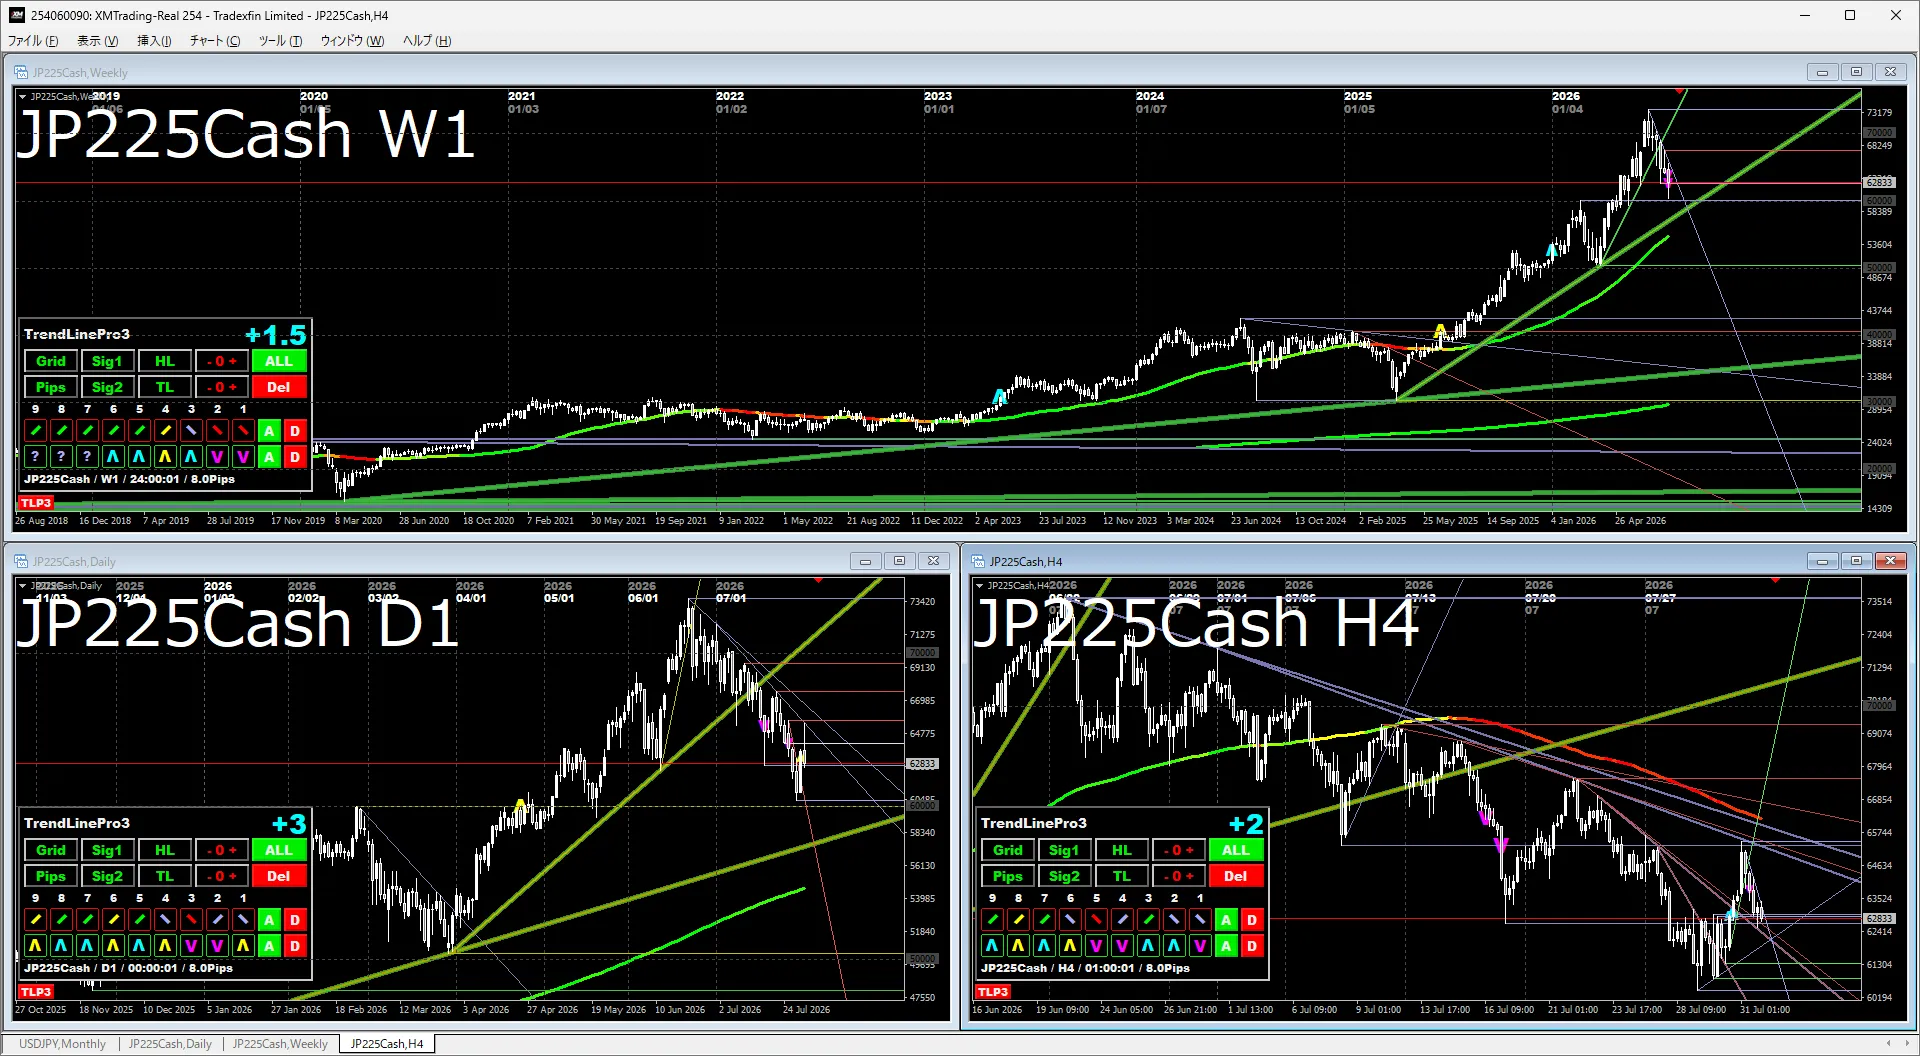
Daily & 4-hourA rebound from support around 60,000 has been confirmed, and the market has begun to stabilize a bit. The key will be whether it breaks above around 65,000 or falls below 60,000. Next week, it may hold flat, but if a breakout occurs, the downside breakout may be more likely than an upside breakout in the near term.
The attached image indicates that the indicators used are the following:
If you’re interested, please take a look.