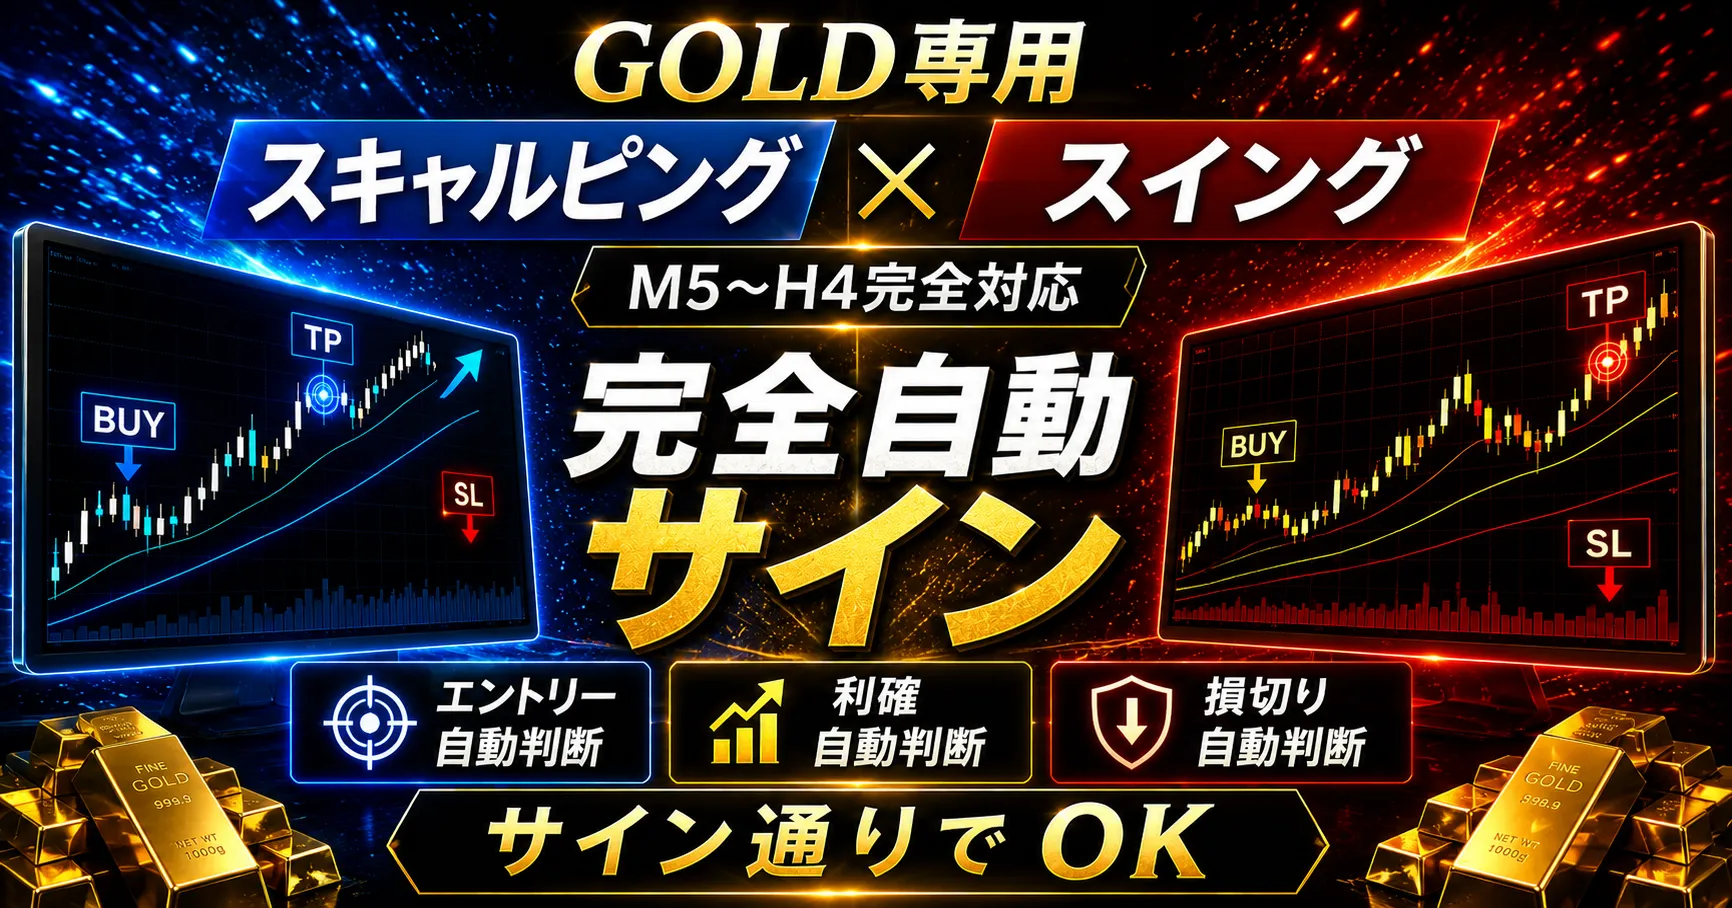

FX beginners are better off not making their own judgments
What beginners who start FX generally do is fairly predictable.
Study how to read charts. Draw lines. Display indicators.
Then, make your own decision and enter.
I believe this is the most roundabout way.
It’s scarier to think you understand something than to think you don’t understand it
The first barrier beginners face isn’t “I don’t understand the chart.”
It’s “I studied a little and feel like I understand.”
This looks like it will go up. This looks like it will go down.
You think so and enter. And you lose.
Why?
Because the rationale is vague. If you enter because “it seems like it will rise,” you can’t do anything when it seems to fall. There’s no criterion to cut or to let it run.
Either pray, or panic and cut.
That’s how I was at first. I emptied my account twice.
The more decisions you make, the more you wobble
Discretionary trading is a sequence of judgments.
・Is this a market where entering is OK now
・Buy or sell
・Where to enter
・Where to cut
・Where to take profit
You decide all of these every time.
Moreover, the market is moving. While you’re thinking, the price changes. You get anxious. When you’re anxious, your judgments become sloppy.
The more decisions you make, the more room for error appears.
And beginners, in particular, don’t have enough decision-making material. If you judge with nothing to base it on, you end up deciding by mood for that day.
That’s why I moved in the opposite direction.
Reduce the number of decisions.
That’s why I built something that doesn’t require judgments
What I use is a method based on moving averages.
What I’m doing is simple: I decide a pattern like “I will enter when this shape appears,” and I only enter when that pattern appears.
The issue is that judging that pattern by eye every time is tedious.
You miss things. You miscount. You might dilute the conditions with a “today I want to enter” mindset.
So I encoded it into a tool.
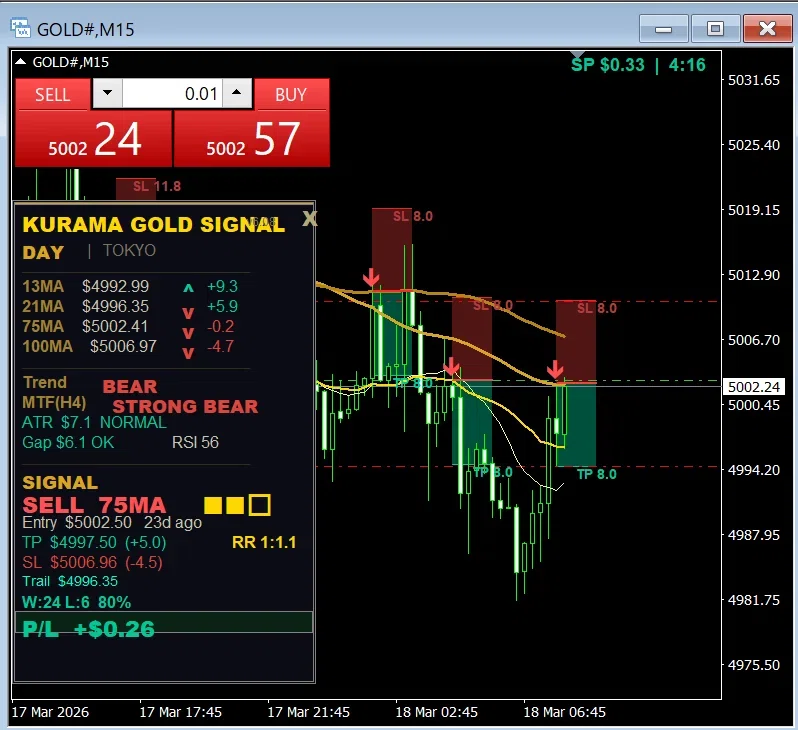
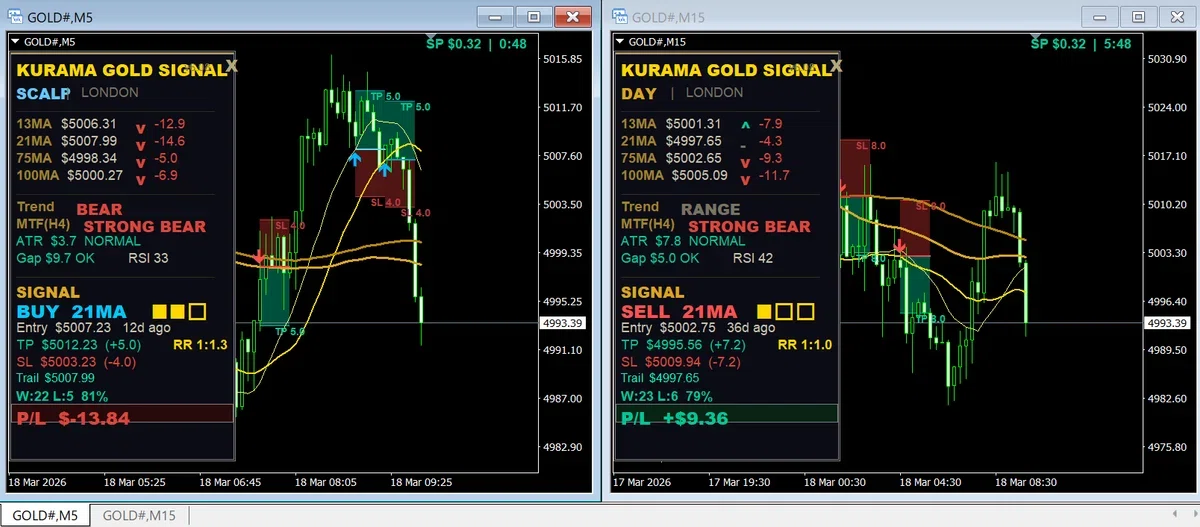
What is displayed on the chart are these three things.
・Entry point (arrow)
・Take profit target (TP)
・Stop loss line (SL)
All shown as lines and numbers on the chart.
No need to decide. Enter when the arrow appears, end when you hit the line. That’s all.
Behind the scenes, we evaluate the market environment with multiple filters: time of day, price action roughness, the arrangement and angle of moving averages, the direction of higher timeframes. If the conditions aren’t met, we don’t issue a signal.
And we assign a quality rank to the signals that do appear.
There are scenes with strong conditions and scenes with moderate conditions. I don’t treat them all the same. I’ll write about this later.
Voices from people who are using it
I’ll share a few messages that reached the community.
All are personal impressions and do not guarantee the same results. I’ll say that in advance.
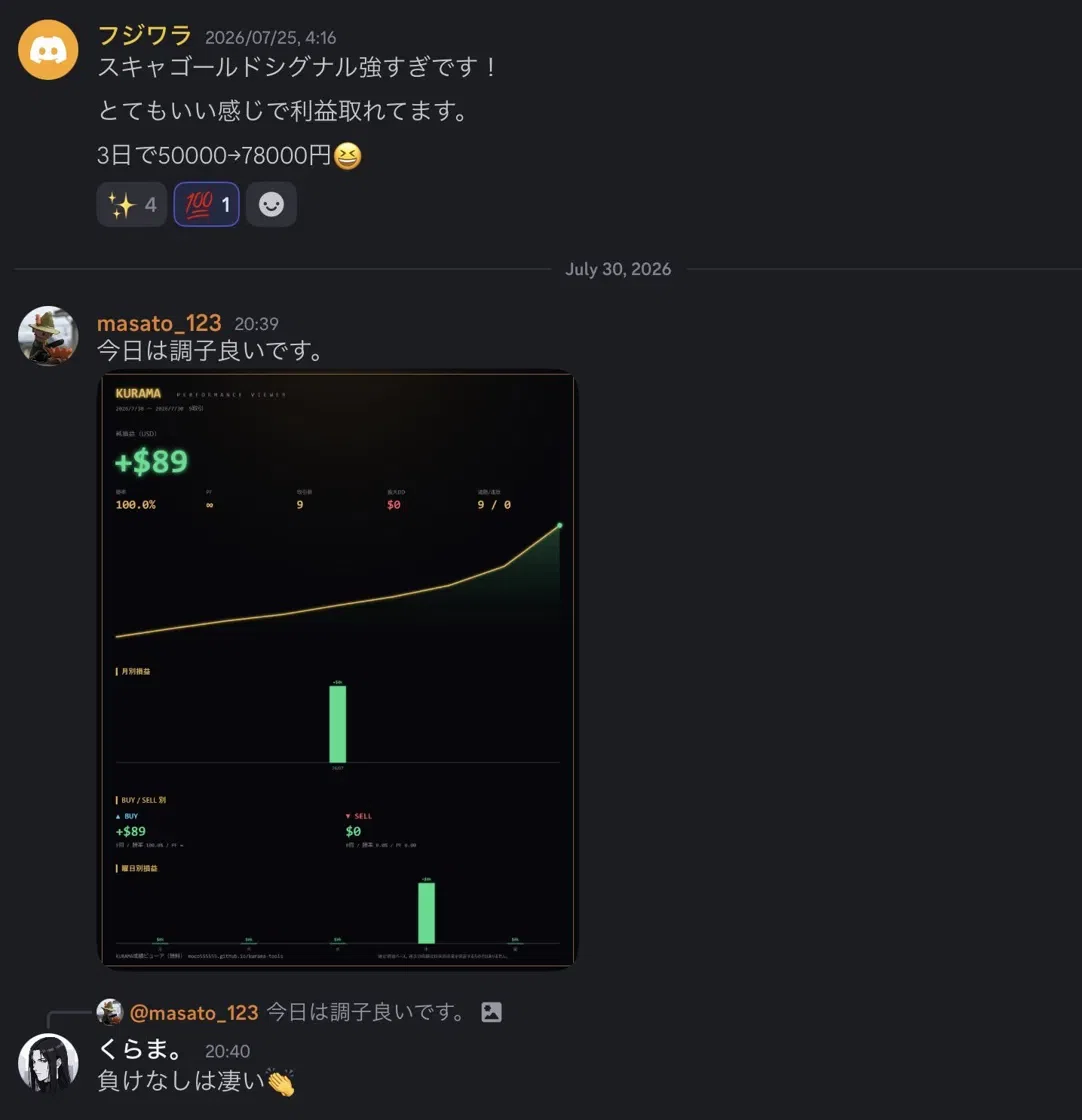
“Scargo Gold Signal is too strong. It’s yielding profits very nicely. 50,000→78,000 yen in 3 days.”
Another person reported this:
Entered 9 times in one day, 9 wins, 0 losses. Net profit positive.
A screenshot of performance was posted with the line, “I’m feeling good today.”
Of course, not every day is like this. There are losing days.
But it’s a fact that there are people who are actually getting results by simply following the arrows.
Being honest about it
This is a hard thing to say, but I’ll write it anyway.
The entry price displayed by this tool is the value on the moving average line, not the market price at that moment.
In other words, it assumes “a clean touch on the moving average.” The win rate and profit shown on the panel are also calculated based on that criterion.
So the actual execution price may differ slightly.
This is a design feature. I’m not hiding it, so please know this before purchasing.
This isn’t a tool that guarantees 100% wins, and nothing like that exists. I’d rather say this openly than hype it.
Better to say “still being improved” than “selling well”
Fortunately, this indicator is the best-selling product of mine. It has over 150 units sold cumulatively, and reviews are highly rated.
But what I consider important isn’t that.
I am still continuing to update it.
Signal tools aren’t a finish line the moment you buy. Markets change. Volatility changes. Tools left as they were when first made will eventually become inappropriate.
I’ve been continually fixing this tool up to version 7.
・Corrections to the logic that affect signal accuracy
・Improvements to the readability of the display panel
・Improvements based on user feedback
There were adjustments based on buyer feedback. The earlier note about entry price was prompted by feedback from someone considering purchasing.
I won’t just sell and end it there.
That’s why I believe this keeps selling over a long time.
Beginners and intermediate users use it differently
Finally, I’ll outline how to use it by level.
For beginners
Just follow the arrows.
Don’t overthink. The TP and SL are displayed, so follow them. Don’t try to apply discretionary judgment.
At first, results are more stable if you don’t mix in your own judgment. If you add judgments when you have nothing to base them on, things usually go wrong.
For intermediate users
I think the best use is as a way to check your own discretion.
Is the signal appearing at the moment you wanted to enter? If not, why not?
If you repeat this, you’ll see your own judgment biases. One former discretionary trader said, “My signals were beating my own discretion.”
Then adjust the amount you trade according to the signal’s quality rank. Trade more in strong-signal situations and less in weaker ones.
When you can do this, your results improve even with the same win rate.
Summary
・For beginners, the enemy is not “not knowing” but “thinking you know when you don’t.”
・The more judgments you make, the more you drift. So reduce judgments.
・If entry, TP, and SL all appear on the chart, there are fewer moments of doubt.
・Entry price is based on moving averages. There can be a discrepancy with the actual trade price (design
)
・Over 150 total sales. But what matters is that I’m still actively refining it.
・Beginners should follow the arrows. Intermediates should use it to check their own decisions.
How many trades did you take this week just because you entered “by feel” after looking at the chart?
If you reduce that, your performance will likely improve significantly.
This is the exact pattern I’m using displayed on the chart as-is.
[New Release] KURAMA GOLD SWING AUTO
▼KURAMA GOLD SWING AUTO (¥59,800)Gold-only swing EA. Auto trading plus a control panel for semi-discretionary operation. Auto risk percentage lot sizing, grade-based signal selection, forward performance disclosed. One unit to let gold run, but you still act when needed.
https://www.gogojungle.co.jp/tools/indicators/82015

[This is all you need]
▼ KURAMA Complete Set (¥64,800) Two indicators +教材 + one-on-one guidance + videos. The ultimate set that has everything a trader needs
https://www.gogojungle.co.jp/tools/rooms/78023?via=users_products

【Very popular indicator value set】
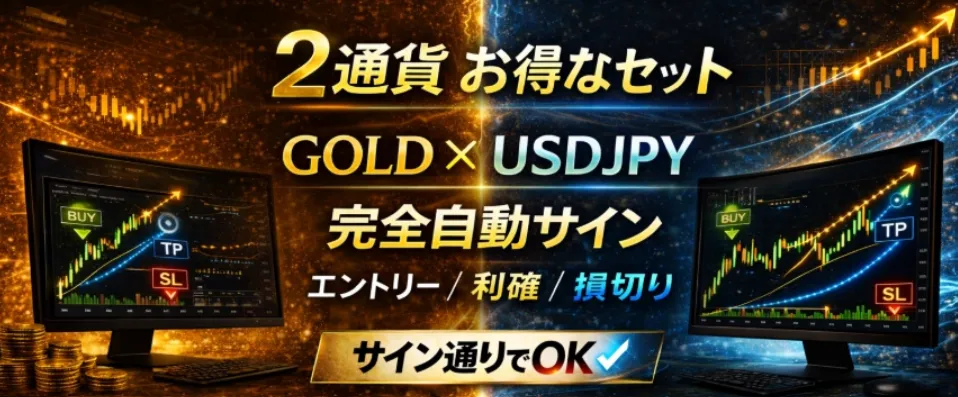
▼ GOLD × USD/JPY Complete Set (¥39,800) KGS (Gold-only) + KUS (USD/JPY-only) +教材 + one-on-one guidance + video教材 → two currencies for opportunities from morning to night
https://www.gogojungle.co.jp/tools/ebooks/77857?via=users_products
▼ GOLD Complete Mastery Set (¥39,800) KGS (scalping/day) + GOLD SWING (swing) → covers M5 to H4. Busy days for swing, when you have time for scalping
https://www.gogojungle.co.jp/tools/ebooks/80024?via=users_products