
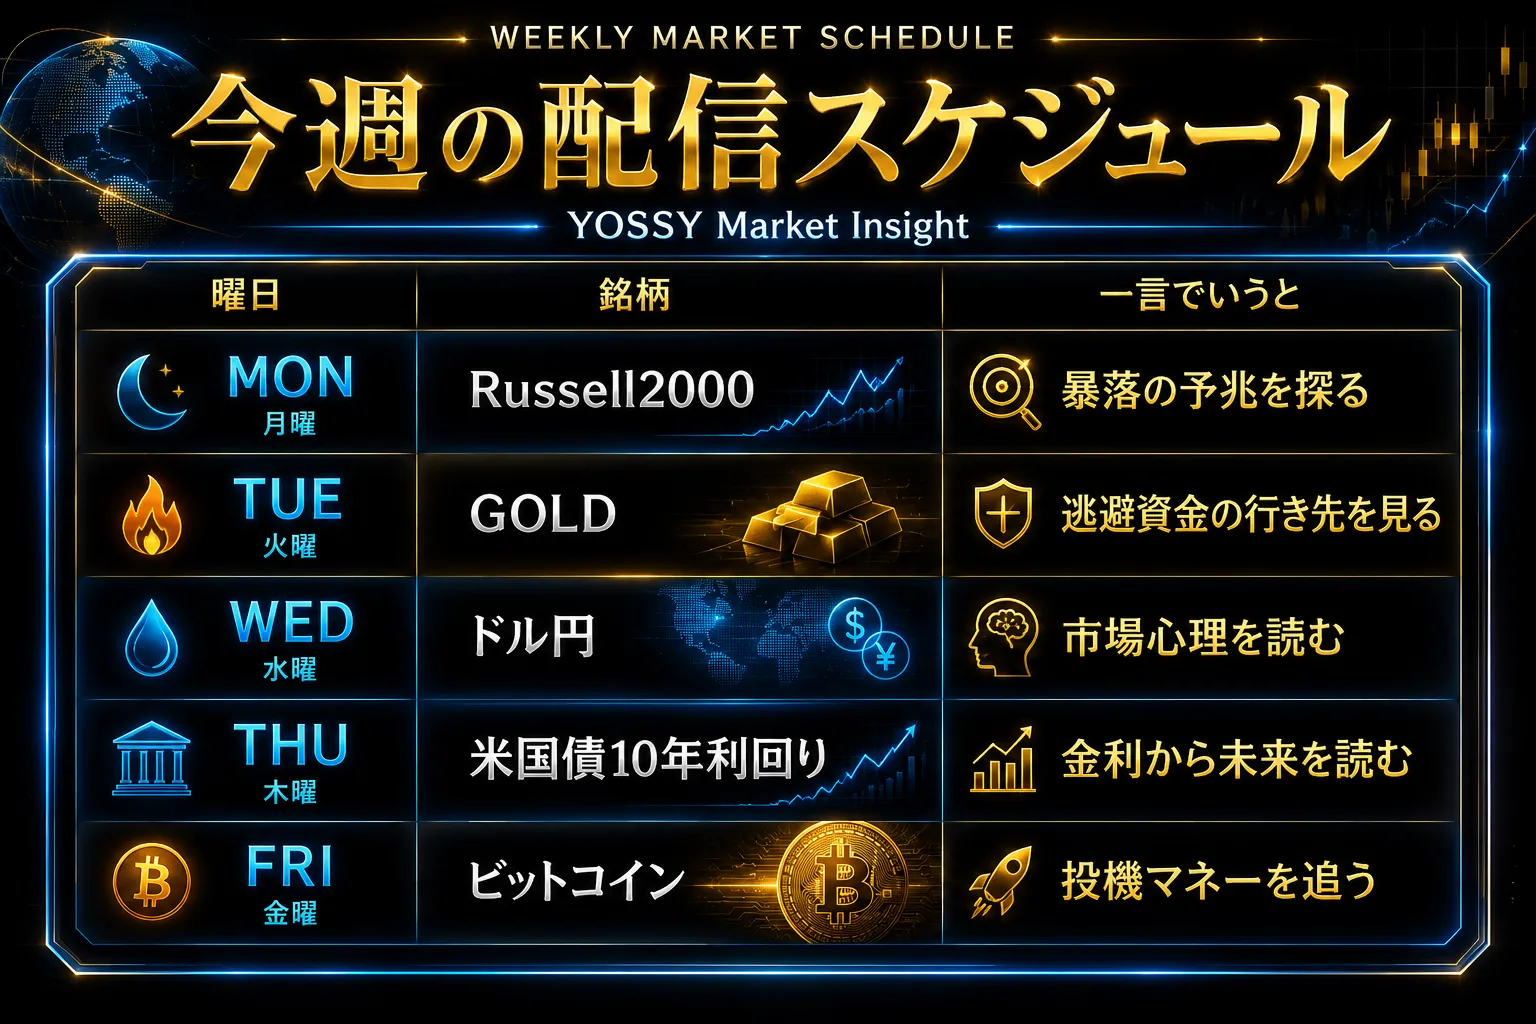
July 30 (Thu): [BB & HM] Nikkei 225 vs US 10-Year Treasury Yield
【Notice】
I will return to my parents-in-law's home by the end of July.
Therefore, there may be delays in magazine posting times and replies to inquiries, but please understand.
This time
is referred to as the
“Economic Temperature”
comparison with
【Overall Scenario Probability】
This week's overall market is…
“Rising: 45% / Falling: 55%”
※While a reversal up scenario based on the Nikkei 225 weekly moving average is emerging, the continued decline of NASDAQ and the lack of directional clarity in GOLD and the U.S. 10-year yield make judgments difficult.
※Presented as a reference level.
【This Week's Market Focus Points】
This week's market shows a reversal upward on the Nikkei 225 weekly moving average, but among the four major U.S. indices there are signals clashing: continued NASDAQ decline and a Doji-like upside pin-bar on the Dow, among others.
The U.S. 10-year yield, dubbed the “economic temperature,” has strong resistance bands in both directions, and a breakout in either direction could lead to a strong move.
Also notable is the movement from GOLD in its sideways consolidation (blue Zone) as a time adjustment, with each market at an important turning point this week. Details will be explained in the paid section.
➥The continuation is explained in detail in the members-only report.
If you are not registered yet, please register here ↓
【Integrated Edition】
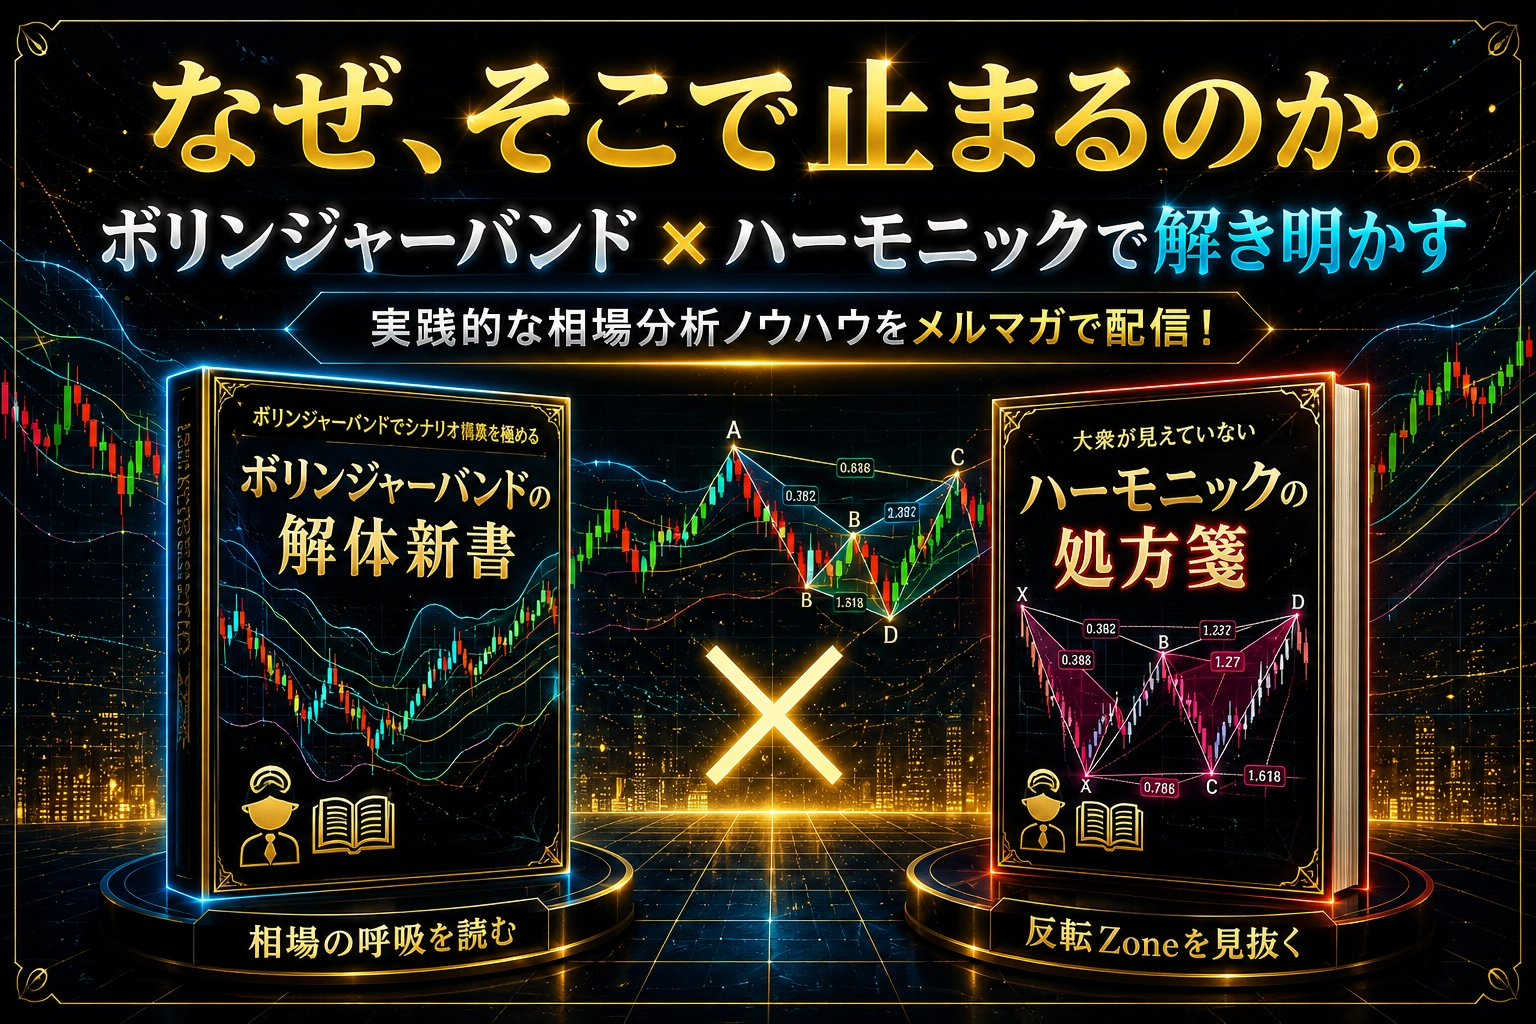
“Why does the market stop there? Bollinger Bands ✕ Harmonics A fusion of statistics and geometry to capture turning points in the market with high precision!”
https://www.gogojungle.co.jp/finance/navi/series/1613?via=articles_detail_aside
(※Below is for members only.)
--------------------------------
【Environmental Awareness】