
How much should you bet per trade? — How to set the risk percentage by working backward from the total drawdown
When you start a challenge at Prop Firm, the first thing you stumble on is, "What percentage of capital to bet on in one trade"
The correct answer wasn’t a feeling.The risk percentage per trade is determined by reversing from the plan’s “overall drawdown limit”.Once I arrived at this formula, my challenge became almost stupefyingly stable.
Apologies for the delay in introducing myself,I’m Lulu.fx. I’m a current discretionary trader who trades mainly GOLD (XAUUSD), and I’m now challenging a prop firm (Company A). For the past six months I’ve been building and validating my own EAs, and I’ll write about the numbers-driven decisions that emerged from that experience.
In the latter half of this article,the problem where calculations still fail in real operation, andtwo tool concepts that physically solve that problem, will be discussed. For those who decided by feel, this may change their perspective.
? Table of Contents
▼ Free公開
- Why people who start with “somehow 1%” end up failing
- A simple approach: calculate from the overall drawdown
▼ After reading more,公開
- Original capital × Plan-specific “1-trade risk%” quick reference
- Even with calculation, the problem of not being able to protect in real operation
- Solution 1: concept of a tool that automatically calculates risk
- Solution 2: concept of a tool that visualizes remaining drawdown capacity
- What changes when you combine the two
- Turn “feel” into “numbers,” and “numbers” into “machines”
Why people who start with “somehow 1%” end up failing
First, I’ll honestly describe the common mistake many people make.“People say to risk 1% of the trading capital per trade, so I’ll do 1%.”—There really are many who start this way around me. I was like that too. Because it’s in the textbook, it feels natural.
But this “1%” may not fit your plan.Prop plans differ in how much drawdown across the whole plan will eject you. A plan that ejects at overall −3% and a plan that ejects at overall −10% will tolerate a completely different number of consecutive losses. With the same 1% risk, the former will be ejected after only a small downward wiggle, while the latter still has room to spare, which is a common occurrence.
Why did I fail while challenging at 1%?
If you take on a plan with overall drawdown −3% at 1% risk, what happens?A simple calculation shows you’re ejected after three straight losses. In practice, wins mix in, so you don’t often hit exactly three consecutive losses, but with “6 wins and 3 losses,” if the winning margin is smaller than the stop-out, the drawdown deepens on a loss-streak basis. The fundamental flaw was designing for too few acceptable consecutive losses. That’s what I realized afterward as the root cause.
In other words, there is no universal truth in “1%.” It should be determined by reverse-calculation from the plan’s limit and your method’s loss characteristics.Reverse-calculation.
A simple way to think: reverse-calculation from the overall drawdown
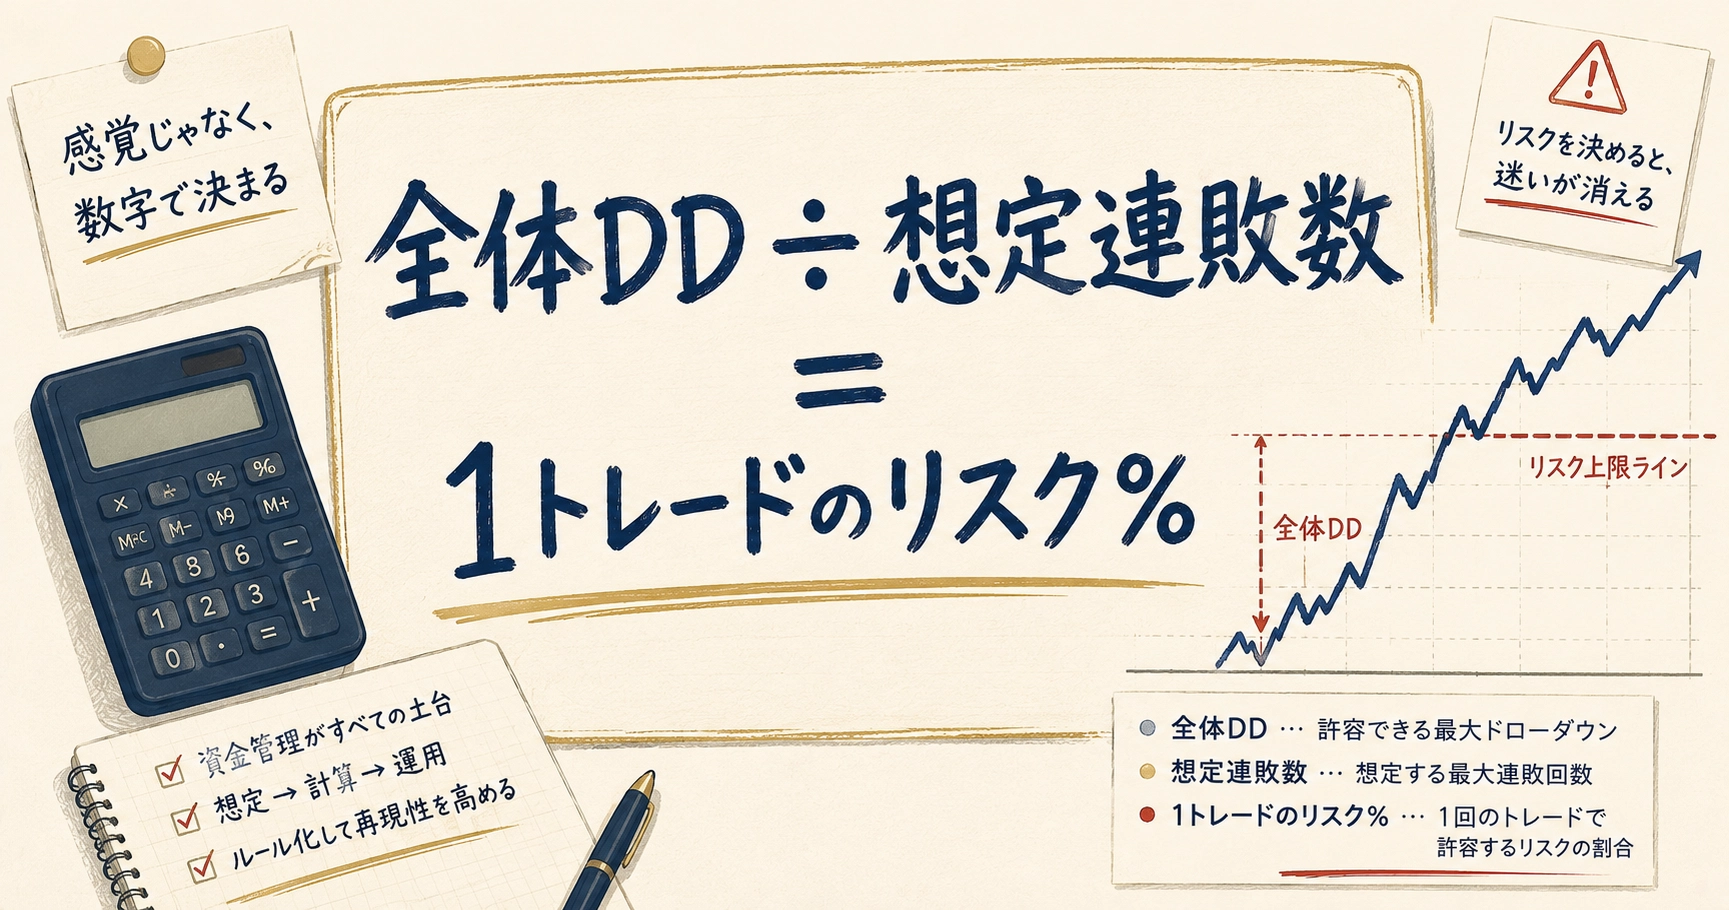
So how do you decide? Here is the core idea, extremely simple:“Divide the plan’s overall drawdown limit by the expected maximum number of consecutive losses.” When written as a formula, it looks like this.
Estimate the number of consecutive losses as “higher”
The key is toestimate the number of consecutive losses higher. My method has a win rate of 50–55%, but even in past tests, occasionally7–8 consecutive losses occur. If you naively assume only 2–3 consecutive losses because you think a 50% win rate should keep things under control, you’ll be blindsided by unexpected drawdowns.
For an overall drawdown plan of −3%, dividing by 8 consecutive losses yieldsapproximately 0.37%. Applying a safety factor of 0.7–0.8 for adverse events,about 0.28% per tradeis a practical guideline for real operation. For an −10% plan, dividing by eight similar losses yieldsapproximately 1.25%, and after applying the safety factoraround 0.94%. Plans differ this much.
That completes the free portion of this article. From here, I will covera concrete quick reference of risk% by capital size and plan, andthe real-world problem of “calculation still cannot be protected in operation”, and thetwo tool concepts that physically solve this issue.