

[Technical Report] The true causes of forward-test drift and PF deterioration — Logic reconstruction using WFA and a case study on controlling maximum drawdown
This is a technical report from Semura Lab., pursuing robust system development capable of withstanding real-world operation.
Currently, in our lab, we are conducting long-term walk-forward analyses (WFA) on multiple systems to advance performance measurement and evaluation. In this paper, we explain the structural factors and solutions for questions such as “Why do high profit factor (PF) systems degrade in forward tests?” and “How far should the maximum drawdown be tolerated?”, using a concrete reconstruction case (USDJPY v4).
Reconstruction Case 001: USDJPY v4 — From a single moving-average crossover to a developed operating logic
This records the process of diagnosing a single moving-average crossover with the lab’s three axes, reconstructing it into an operating logic after walk-forward validation and embedding real-world constraints. Ten years of validation, eight years positive; compound growth of 8.29x. But what I want you to look at in this paper is not the numbers themselves. When the raw idea and the post-reconstruction are placed side by side using the same data, same period, and same accounting, how large is the difference between them? That difference is the essence of the reconstruction process.
1. Seed ── The focal pointIf you plot two moving averages on the USDJPY trend and buy when the fast line crosses above the slow line and sell when it crosses below, can you not just ride the trend? This is the starting point. Sizing is fixed. There is no post-entry verification. Margin, spread, and weekend risk are not considered. It's just a single question whose outcome is unknown whether it moves or not. First, rotate this focal point as is, with no waiting for confirmation, no walk-forward, fixed lot size, and including actual spread of 0.6 pips. The result is as shown.
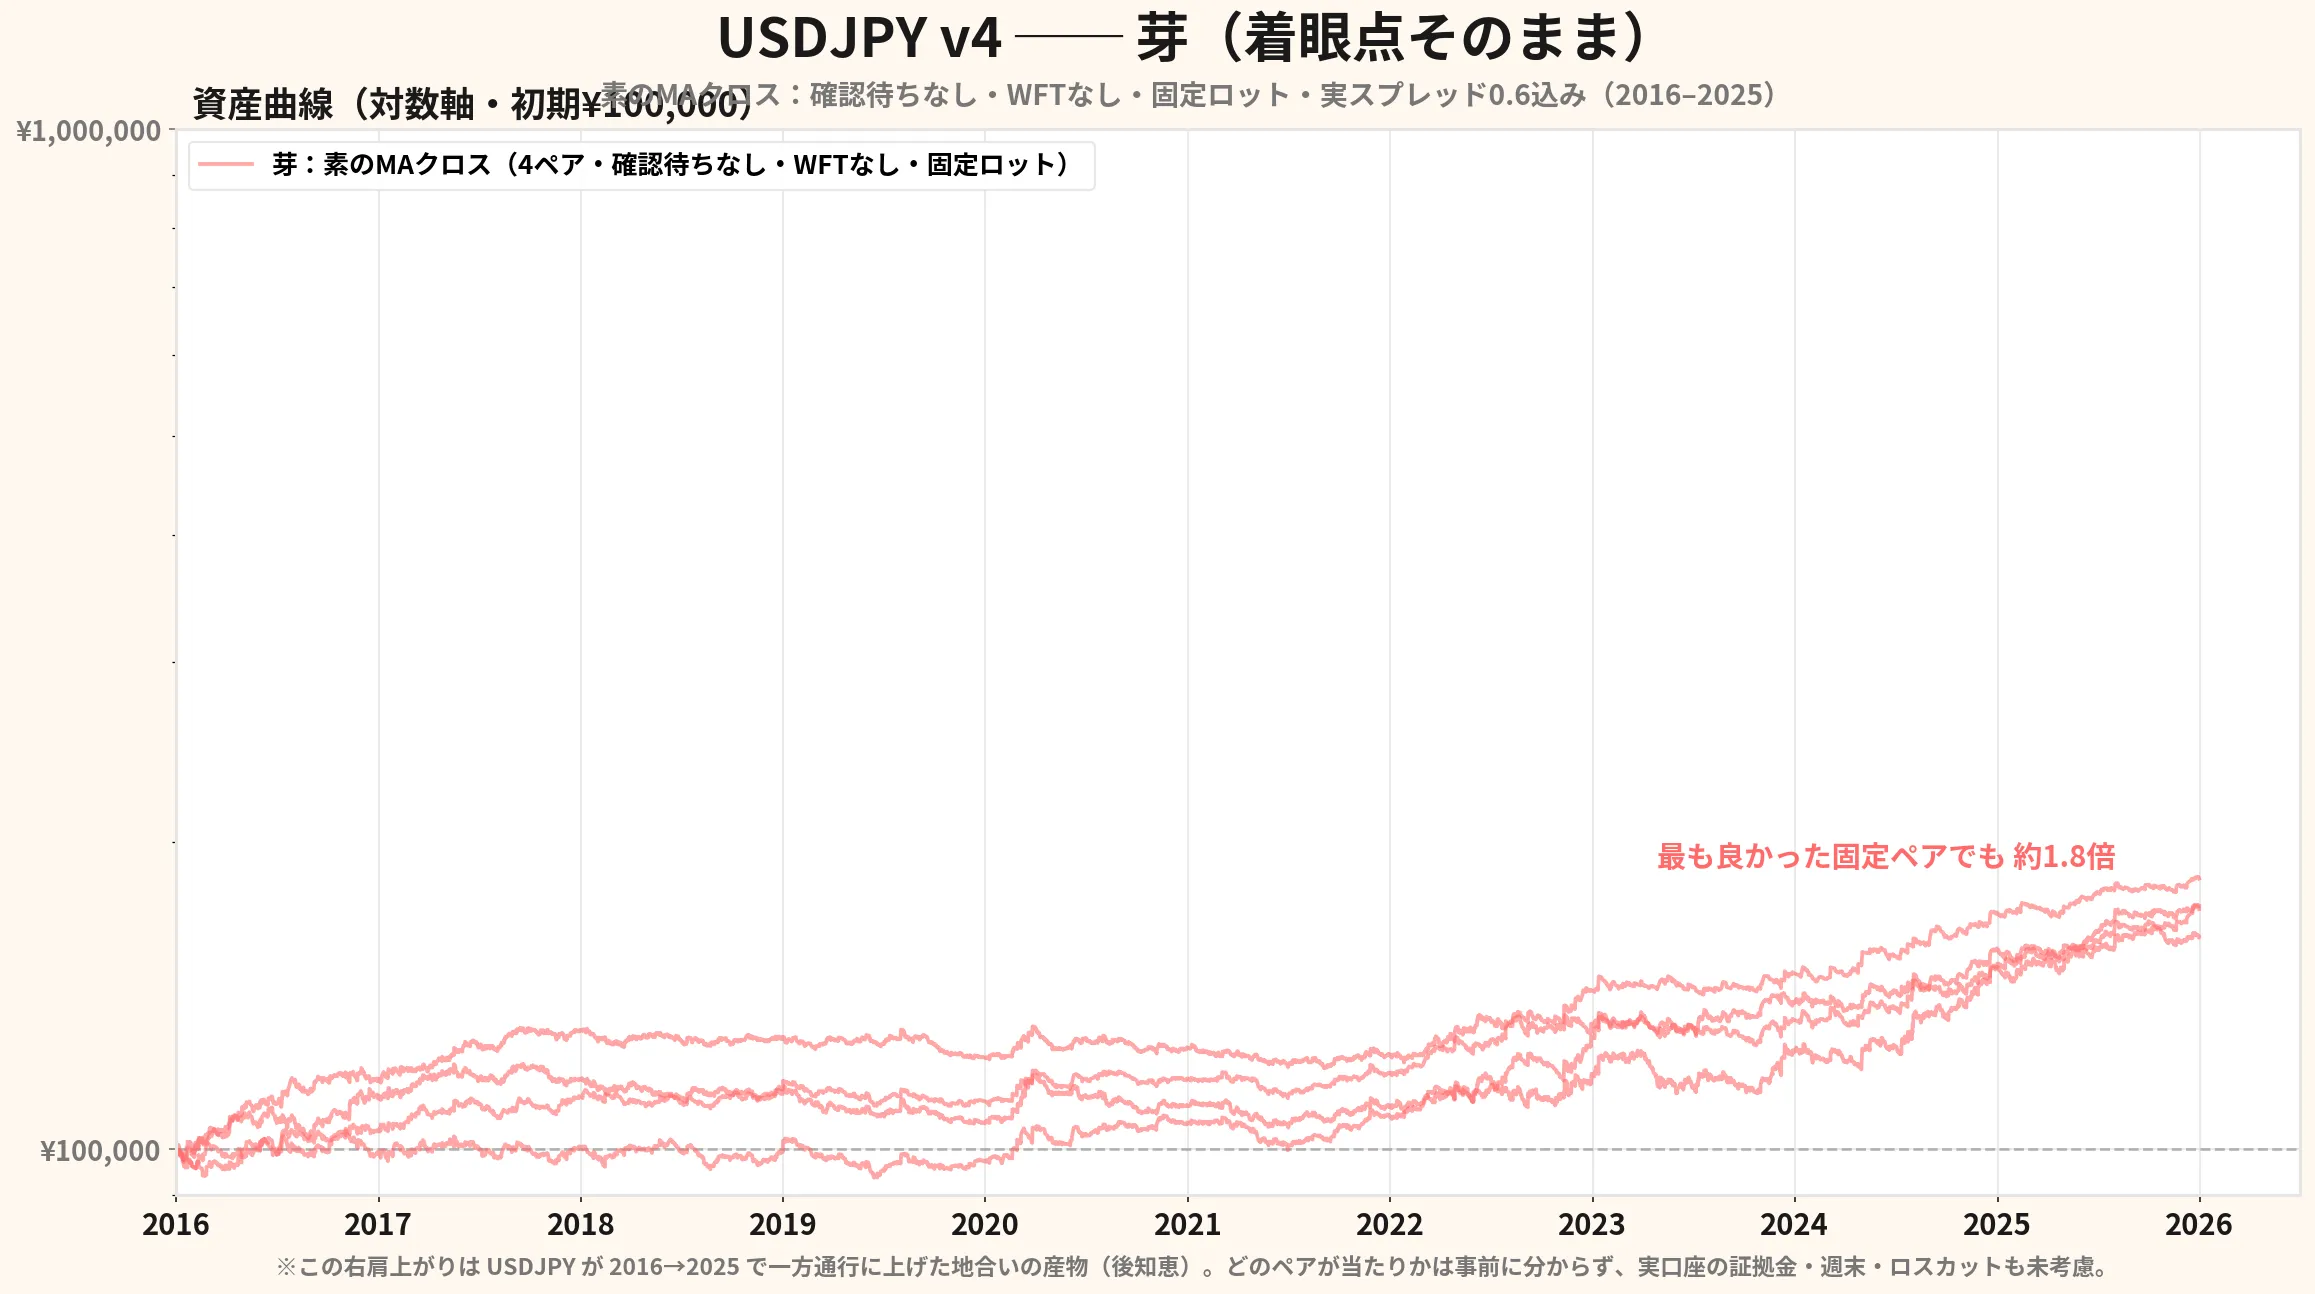
At first glance, it looks upward sloping. This is the first trap. A backtest that trends upward does not automatically translate to real account profits. The reason this curve is upward is largely due to the overall market condition from 2016 to 2025, where USDJPY rose almost unidirectionally from around 108 to the 158 range, rather than the superiority of the logic. Simple trend-following will yield positive results as long as a strong trend exists. Mistaking a curve that rose thanks to favorable market conditions for the strength of the logic is a common trap that leads many EAs to look good in backtests but fail in live trading. At Semura Lab., we do not call this stage “logic.” It is a focal point. The focal point must first be subjected to diagnosis.
2. Diagnosis ── Evaluation by three axes
Evaluate the focal point using the same three axes as for diagnosis of the specimen.
Axis 1 Physical feasibility ── Can it withstand real account constraints
The curve in Figure 1 has no concepts of margin, concurrent positions, or margin calls. It is drawn under the assumption that all positions can be held unlimitedly. In a real account, maintenance would trigger forced liquidation if equity falls below a threshold. This curve is effectively a “theory-only” upward tilt that cannot be guaranteed to be sustainable on a real account.
Axis 2 Logical coherence ── Is future data being looked at
If you cross with an incomplete bar and execute, that becomes a future reference. Trades entered with information that has not yet been confirmed only hold within backtests. The first step to verify whether the logic holds is to question whether the bar’s decision includes the future of that bar. If this remains ambiguous, validation results will appear overly optimistic.
Axis 3 Real-world adaptability ── Does it hold when the period changes
And the most commonly overlooked part is here. The approximately 1.8x in Figure 1 is the best among four candidate pairs, chosen after the fact. Which pair will be the winner is unknown in advance. If you exclude it, it drops to about 1.6x with a maximum drawdown of −13%. Fixing parameters to fit all past periods is to tailor numbers to the validation period and is essentially curve-fitting. Detecting curve-fitting is easy: ask, “Were those parameters decided without considering the validation period?” If the answer is No, that beautiful curve is merely an illustration fit to the past. An unnaturally upward curve that has been over-optimized will diverge and collapse as soon as you move the period forward and test it in forward conditions.
Many externally supplied EAs show this unnatural upward curve while the logic itself is not disclosed. Because the contents are hidden, buyers cannot determine whether the strength comes from genuine capability or overfitting. Semura Lab. aims to mechanically explain the contents to eliminate this anxiety at its root.
Diagnosis result: redesignable.
All three axes have gaps. However, the core concept of following the trend is physically valid. The core is alive. The gaps can be plugged one by one according to lab standards.
3. Cultivation ── Annual growth rings
For a focal point judged redesignable, we add the lab’s growth rings one by one. Each step corresponds to one of the three axes.
Confirmation waiting (Axis 2):Even if a cross appears, do not enter immediately. After confirming that a certain number of crosses occur under the same condition, you place orders on bars after the confirmation bar. The confirmation bar must be placed earlier than the trade bar. This eliminates any future-reference from the structure.
Walk-forward validation (Axis 3):Instead of fixing parameters, for each validation year select the top three performers from the previous three-year training period and apply those three to the following year. Slide this annually. All parameters are determined only from past data, with no look at the validation period at all. This is the backbone to prevent forward drift and to structurally cut overfitting. For Figure 1’s “1.8x post-hoc”, this method builds performance only from entries chosen in real time.
Adaptive sizing (Axis 3 / Axis 1):Do not fix the lot size. Compare recent volatility with long-term standards to adjust exposure (both based only on past bars = causal), and vary the strength of price movement accordingly.
Stop for drawdown (Axis 1):“Where to stop when maximum drawdown keeps updating.” A logic without a clear rule will eventually blow the account. This logic reduces exposure progressively as downside deepens and designs the overall exposure so that maximum drawdown remains within −20% under compound operation. Drawdown is not something to be endured by prayer; it is determined by design.
Built-in real-world constraints (Axis 1):Incorporate real trading conditions from the design phase, not retrofitted. Profits are recognized only at settlement. Margin is evaluated by aggregating all positions. If equity falls below 50%, forced liquidation is applied. Drawdown is measured by the worst value within a bar. Positions spanning weekends are not held. Spread is deducted by the actual value of 0.6 pips.
Additionally, note the deliberate design not to engage in contrarian trading. The win rate of this logic is low. It rejects the typical “high win-rate, steady wins, then a big loss” pattern, which would show high win rate but deplete profits on one loss. The aim is to push the asset curve more upward when winning; a low win rate is not a defect but a consequence of this design.
4. Realization ── Verification results